
At 8:50 a.m. Eastern time on Tuesday, bitcoin is hovering at $93,788 with a market valuation of around $1.87 trillion, making its presence loud and clear even in a quiet trading day. Over the past 24 hours, trading volume stands at $50.09 billion as the price dances between $92,474 and $94,792—tight, tense, and textbook consolidation. Whether it’s coiling for a breakout or bracing for a breakdown, the charts are holding their breath, and the next move could be explosive.
Bitcoin Chart Outlook
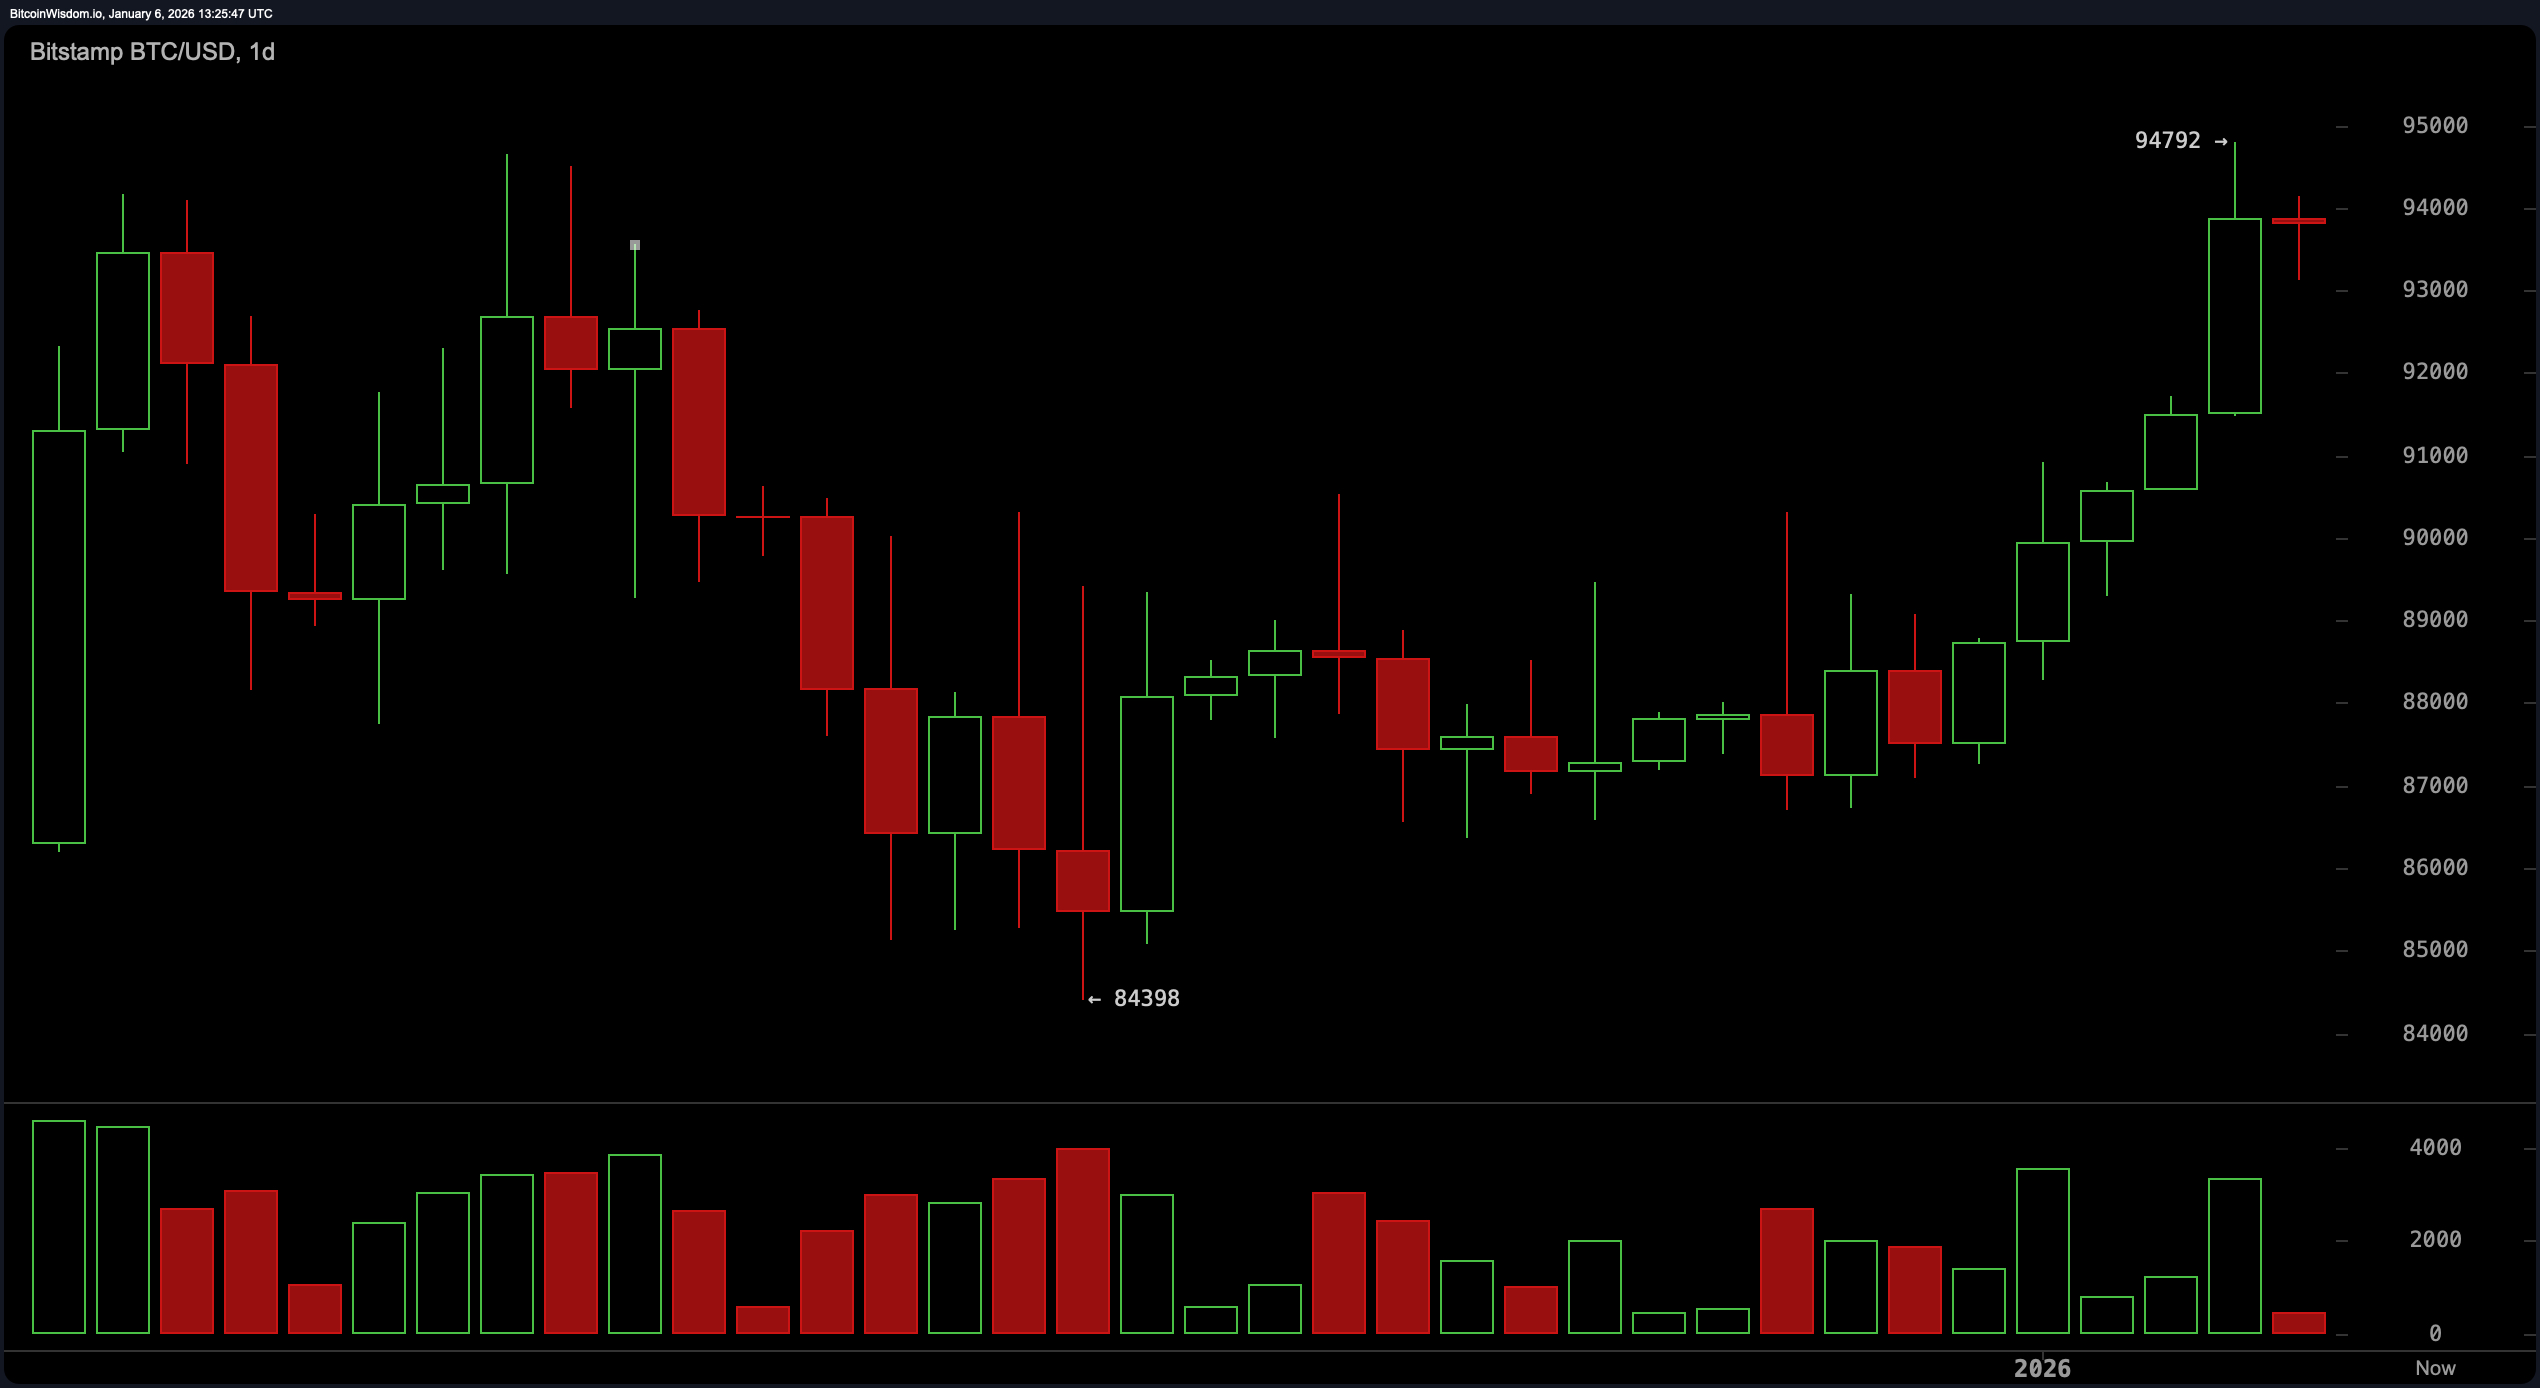
From a daily chart perspective, bitcoin is strutting confidently after defending the $84,400 level, marking a textbook swing low. Its higher-low structure remains untouched, suggesting a market still under the influence of buyers—even if it’s currently catching its breath below the $94,800 resistance zone.
Volume tells a tale of two moods: enthusiasm on the way up, hesitation at the highs. Unless bitcoin slumps below the $90,000 to $91,000 zone on a daily close, the case for a continued upward march remains intact. Consider this a consolidation phase with a flair for drama, not a collapse in disguise.
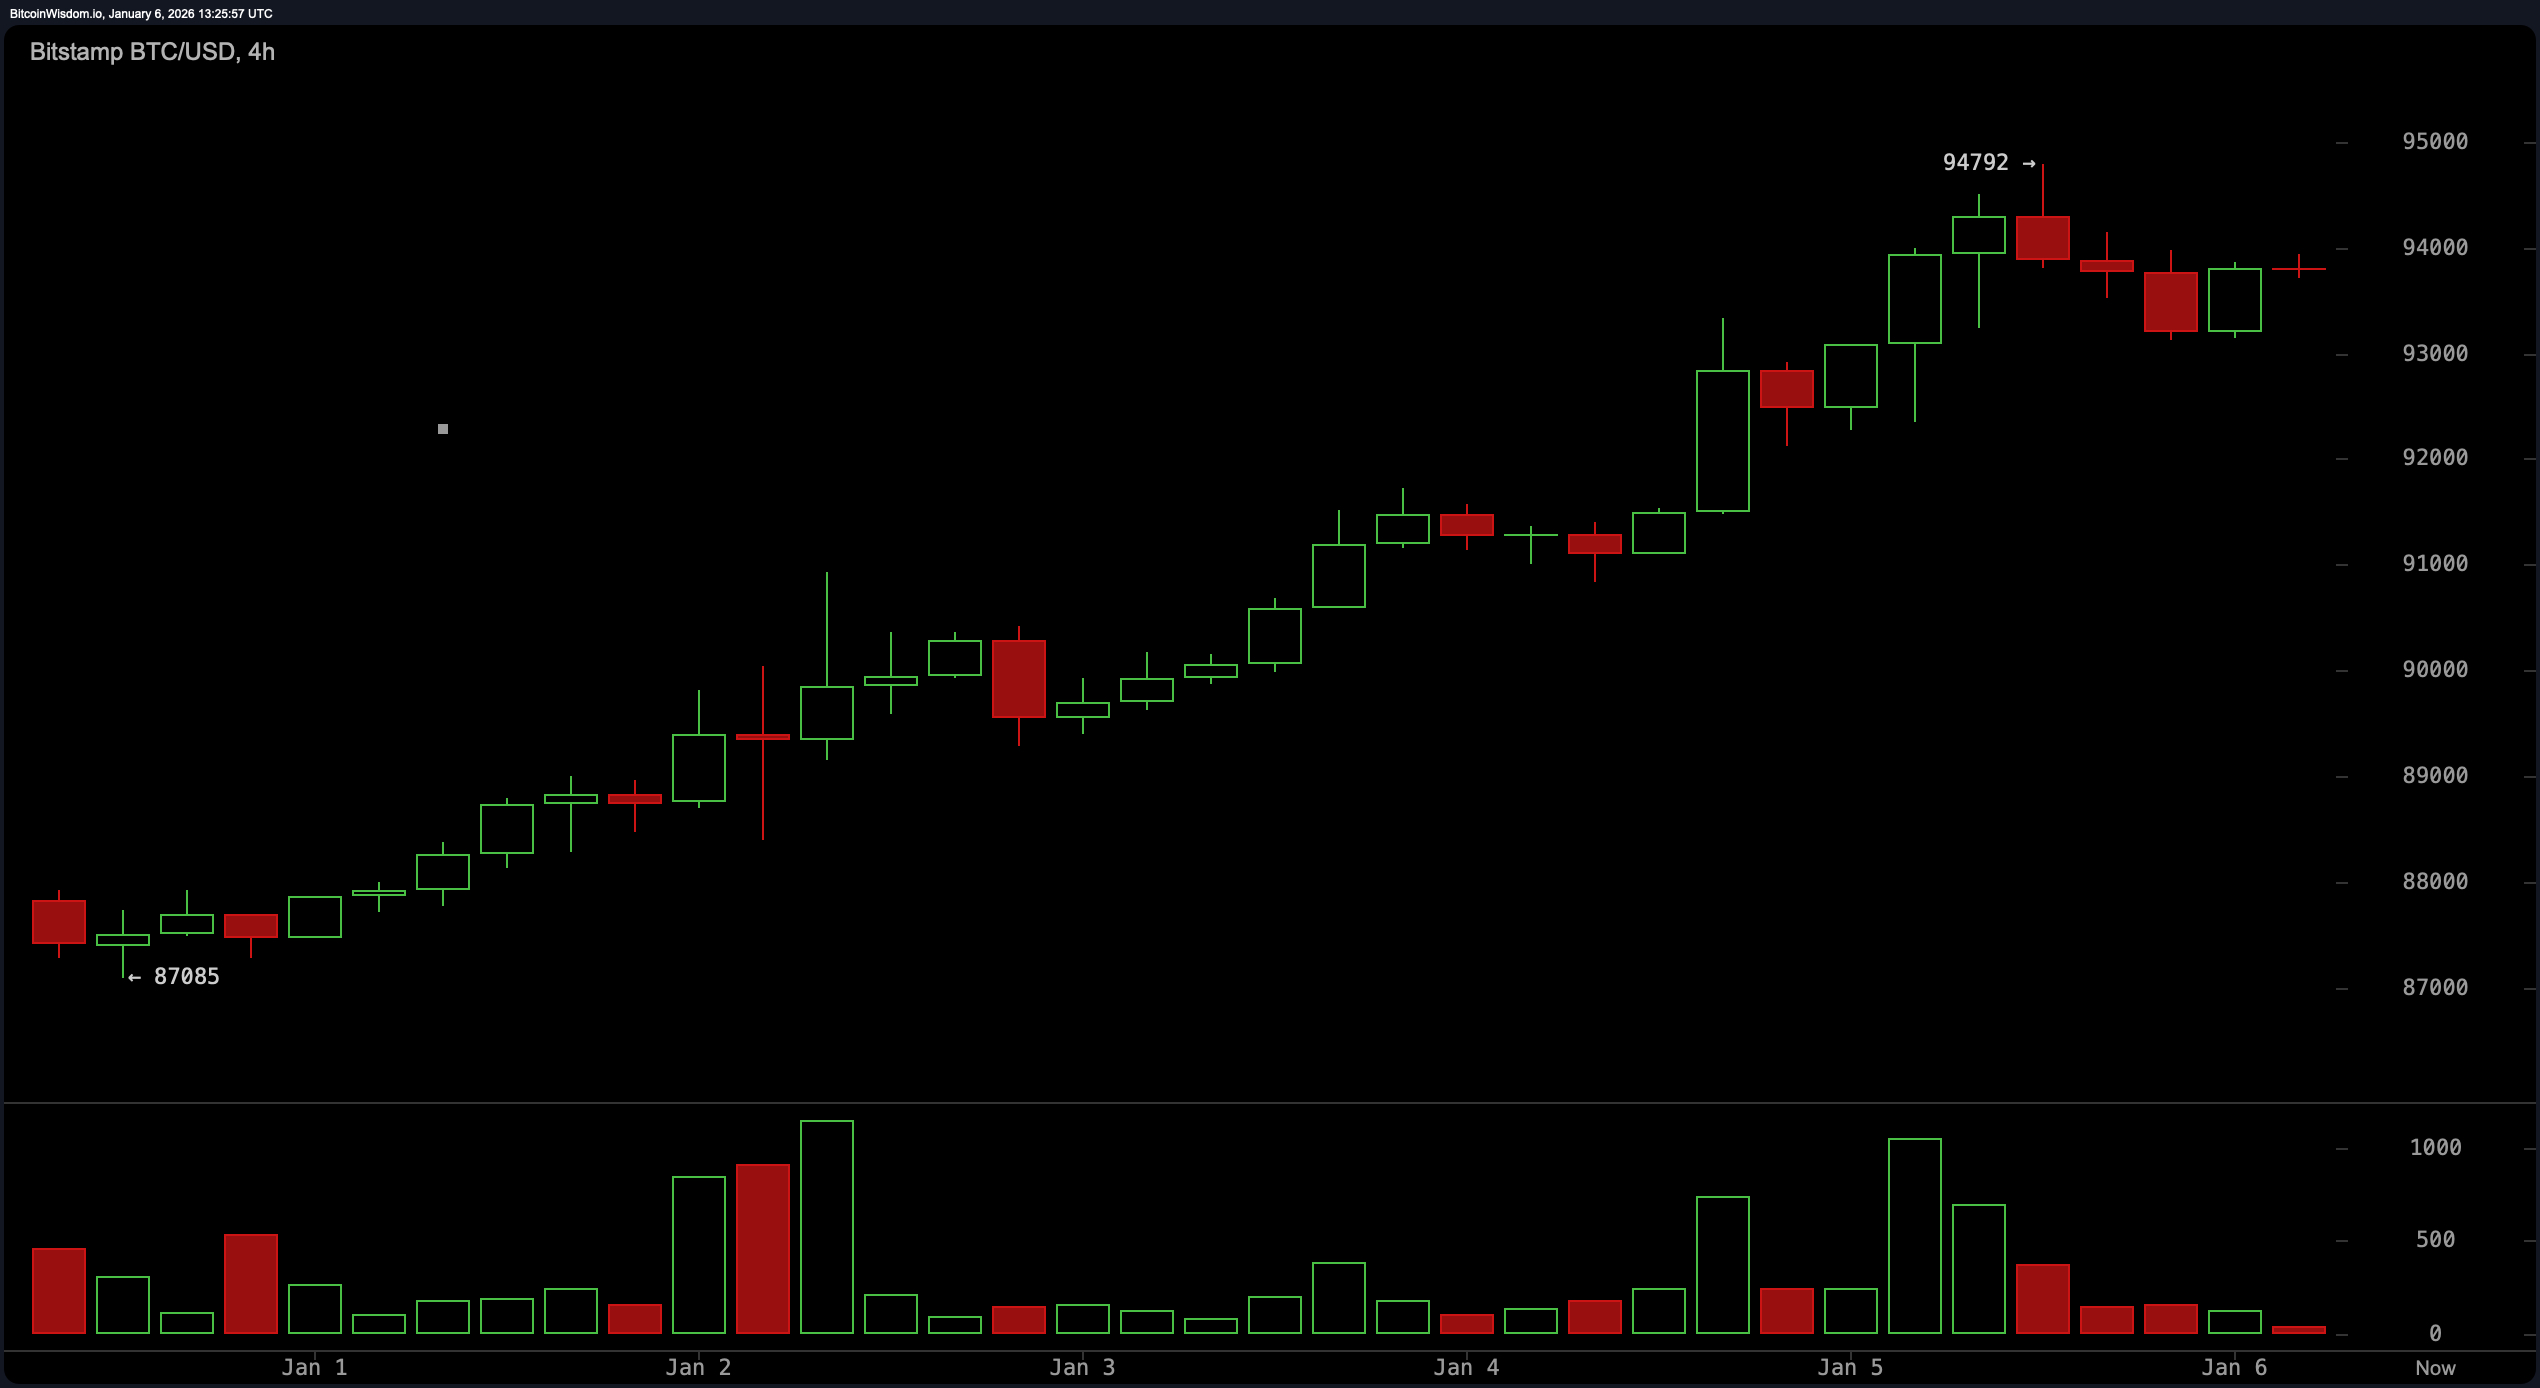
Zooming into the 4-hour chart, momentum may be cooling, but it hasn’t gone cold. Price carved out a tidy ascent from $87,000 to $94,800, followed by a mellow pullback that’s more nap than nosedive. Volume peaked during the breakout and has since tapered, hinting that the market is pausing, not panicking. As long as the $92,500 to $93,000 zone holds, bitcoin‘s bullish sentiment stays in the driver’s seat, with a break above $95,000 potentially lighting a fire under price action. Slipping below $92,000, though, could shift the tone dramatically.
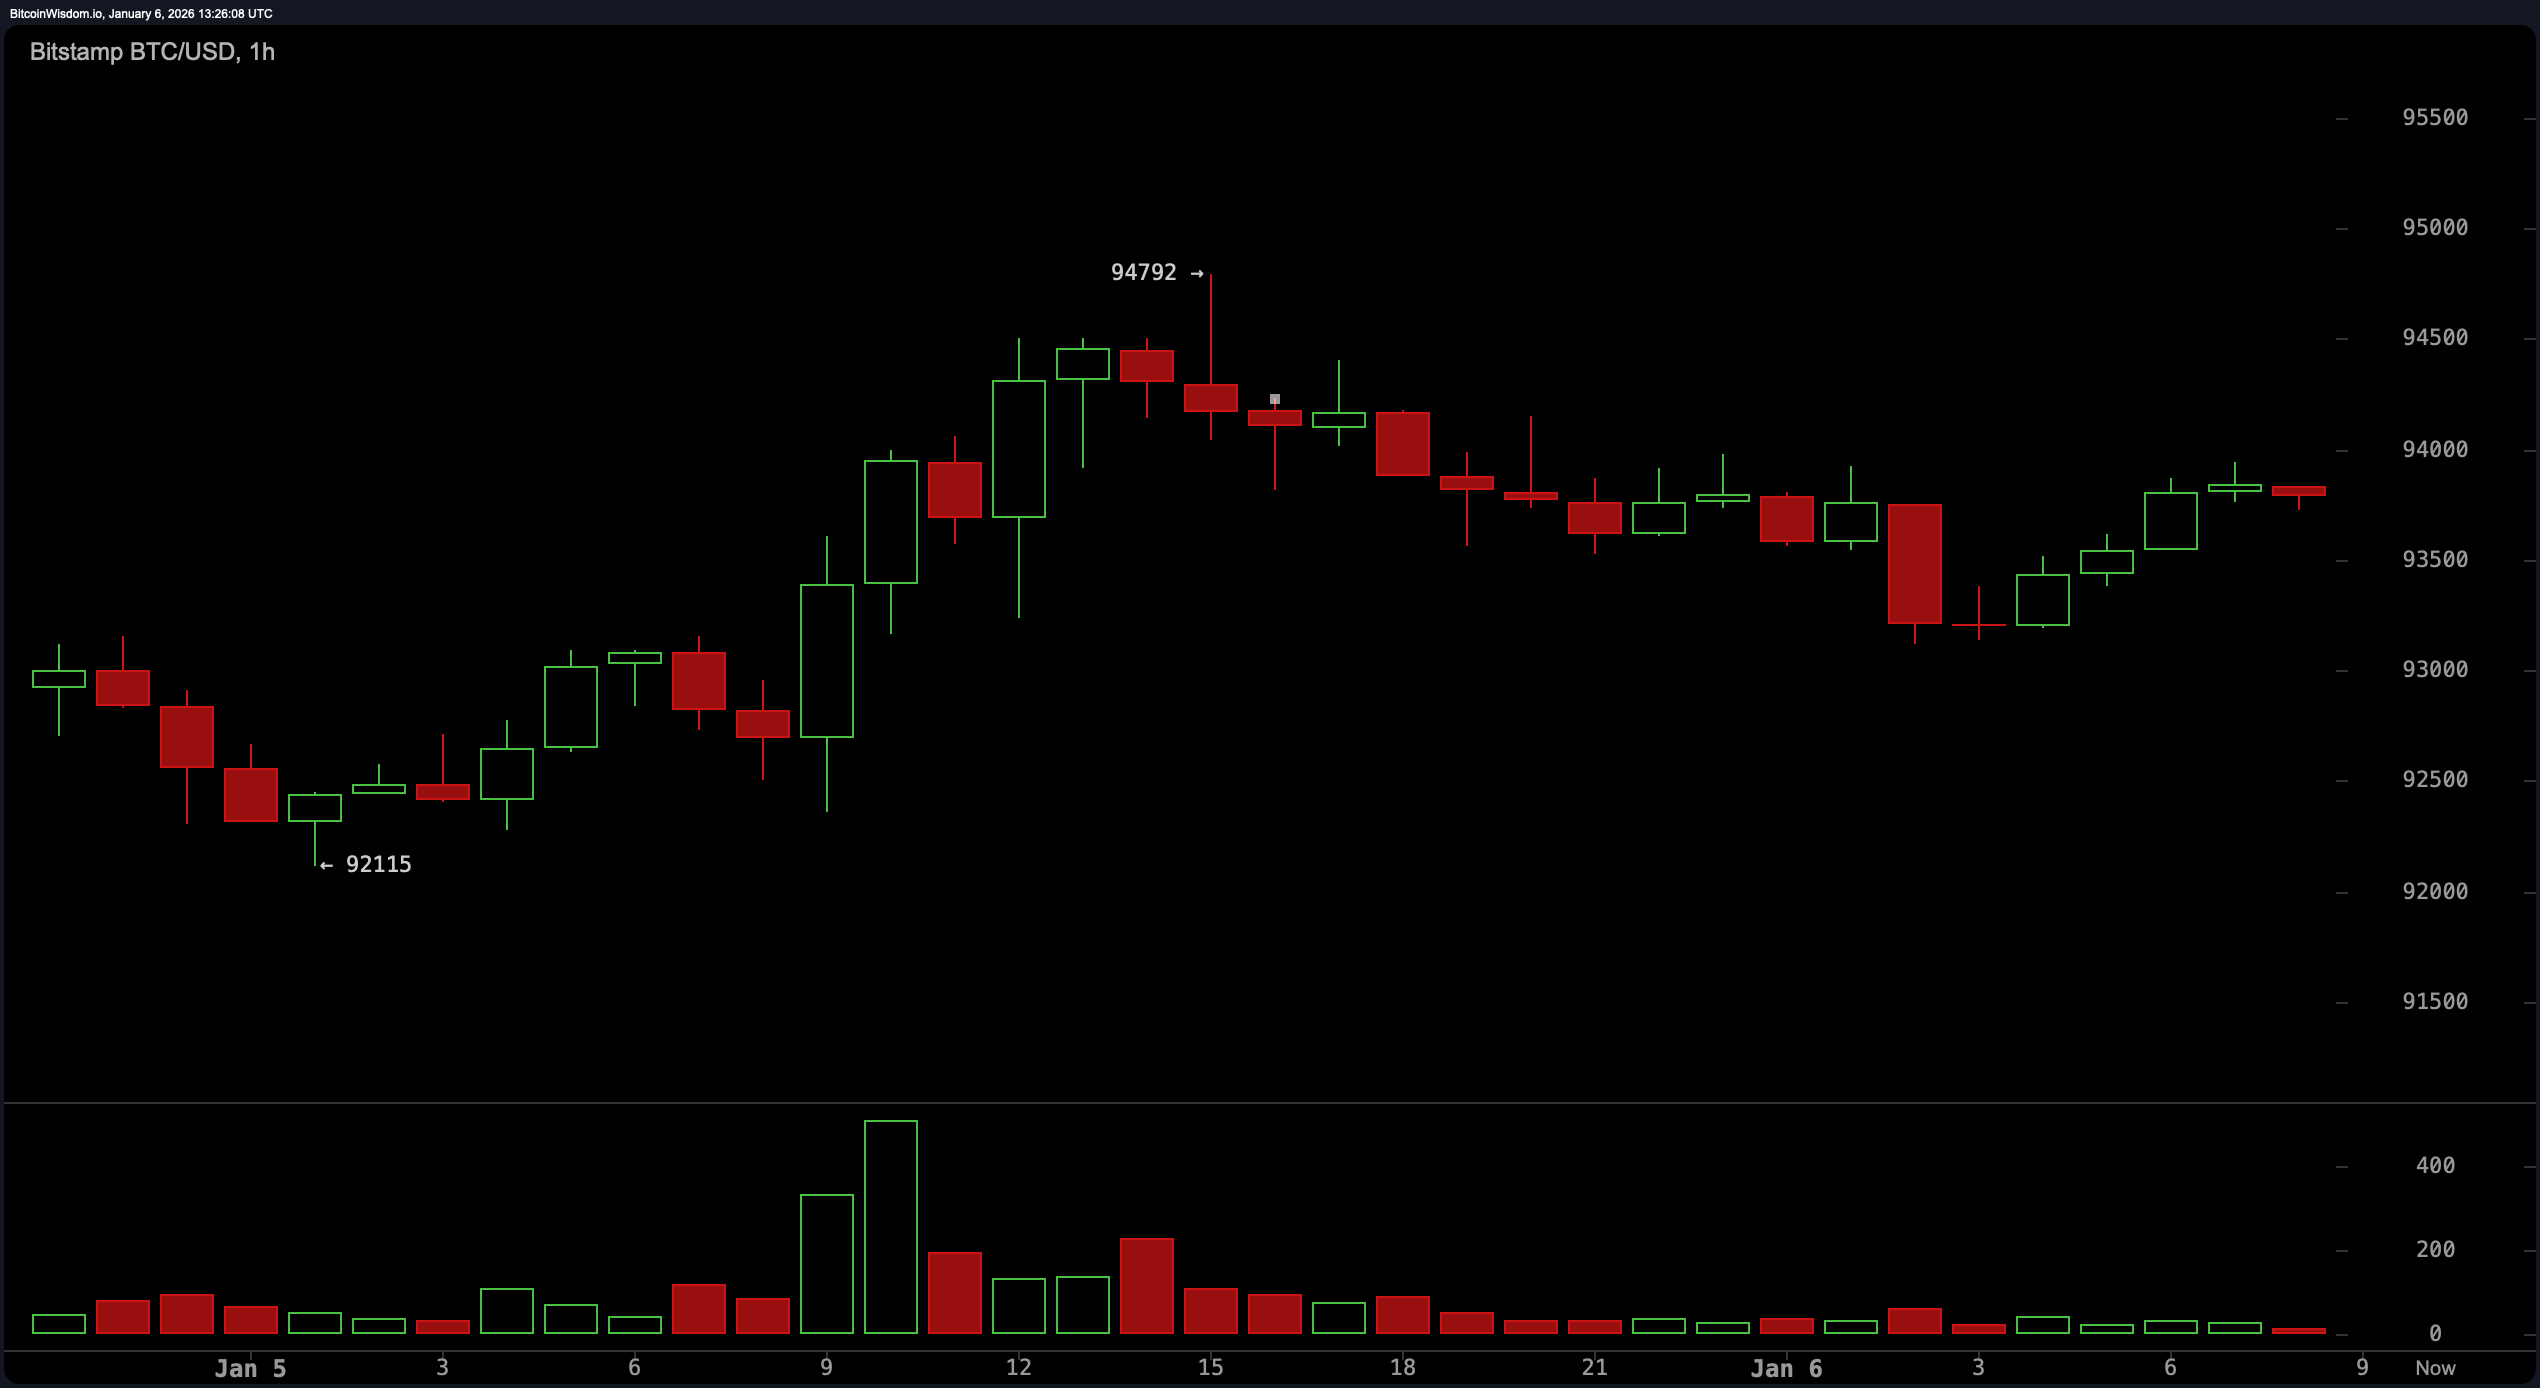
The 1-hour chart, meanwhile, offers a peek into the crypto chess match unfolding in real time. bitcoin is boxed in between $93,000 and $94,800, crafting a range that’s tight enough to rattle scalpers. Short-term support around $93,000 remains sticky, and the shallow nature of recent pullbacks suggests that sellers are more cautious than committed. A breakout above $94,800 could put the wind back in bulls’ sails, while a clean break below $93,000 might usher in a quick trip to $92,000. For now, price is caught in a sideways shuffle, waiting for conviction to show up.
On the technical indicator front, things get a little spicy. The relative strength index ( RSI) is sitting at a neutral 65, neither overbought nor oversold, while the Stochastic oscillator is holding a lofty 91, still not committing to a directional bias. The commodity channel index (CCI) at 225 and the momentum indicator at 5,961 both lean bearish, suggesting underlying exhaustion. However, the MACD ( moving average convergence divergence) flashes a bullish signal at 587, throwing a curveball into the mix. Consider this a cocktail of mixed signals—some sweet, some sour.
Moving averages (MAs) are throwing support behind the current trend, but with a twist. Short- to mid-term averages—such as the exponential moving average (EMA) and simple moving average (SMA) for 10, 20, 30, and 50 periods—are marching in bullish lockstep. However, the 100 and 200-period moving averages are flashing bearish, reminding everyone that the bigger picture still has resistance to clear. The 200-period simple moving average, sitting way up at 106,599, makes bitcoin’s current price look like it’s still auditioning for the heavyweight title. But make no mistake: as long as price stays above the key $92,000 level and continues to put in higher lows, this market is playing offense, not defense.
Bull Verdict:
As long as bitcoin holds above the $92,000 threshold and maintains its higher-low trajectory, the bulls remain in control. The tight consolidation beneath resistance suggests accumulation rather than distribution, and a decisive push above $95,000 could ignite the next leg higher with renewed momentum.
Bear Verdict:
If bitcoin fails to defend $93,000 and breaches $92,000 with volume, the stage is set for a deeper retracement toward structural support near $90,000 and potentially $88,000. Bearish pressure from long-term moving averages and overextended oscillators hint that the upside may already be running on fumes.
FAQ
- Where is bitcoin trading today? Bitcoin is trading around $93,788, consolidating near key resistance.
- What is the current support level for bitcoin?Immediate support lies between $92,000 and $93,000.
- Is bitcoin showing bullish or bearish signs? Bitcoin remains in an uptrend but is facing momentum exhaustion.
- What would confirm a breakout in bitcoin’s price?A clean move above $95,000 would signal bullish continuation.