
Bitcoin faces key resistance at $98K, with recent fluctuations showing strong upward momentum. Can BTC break the resistance?
Bitcoin (BTC) has seen significant price fluctuations over the last 24 hours, particularly after reclaiming $90,000. Following the $92,150 bottom, BTC quickly surged to a high of $94,634. However, the price then experienced a slight pullback, and is currently trading at $93,681, just below its peak.
The price action showcases strong upward momentum, with the market pushing toward the upper side of its price range. The $92,000 area is now acting as support, while the recent peak above $94,600 remains a critical resistance point. Can Bitcoin break out of these resistances areas?
Bitcoin Price Analysis
On the technical analysis side, Bitcoin is currently making an attempt to break through the first weekly Fibonacci resistance at the 0 level, which sits at $98,242. If the price fails to hold above this level and faces a drop, Bitcoin could potentially retest lower areas, exposing it to price points below $90,000.
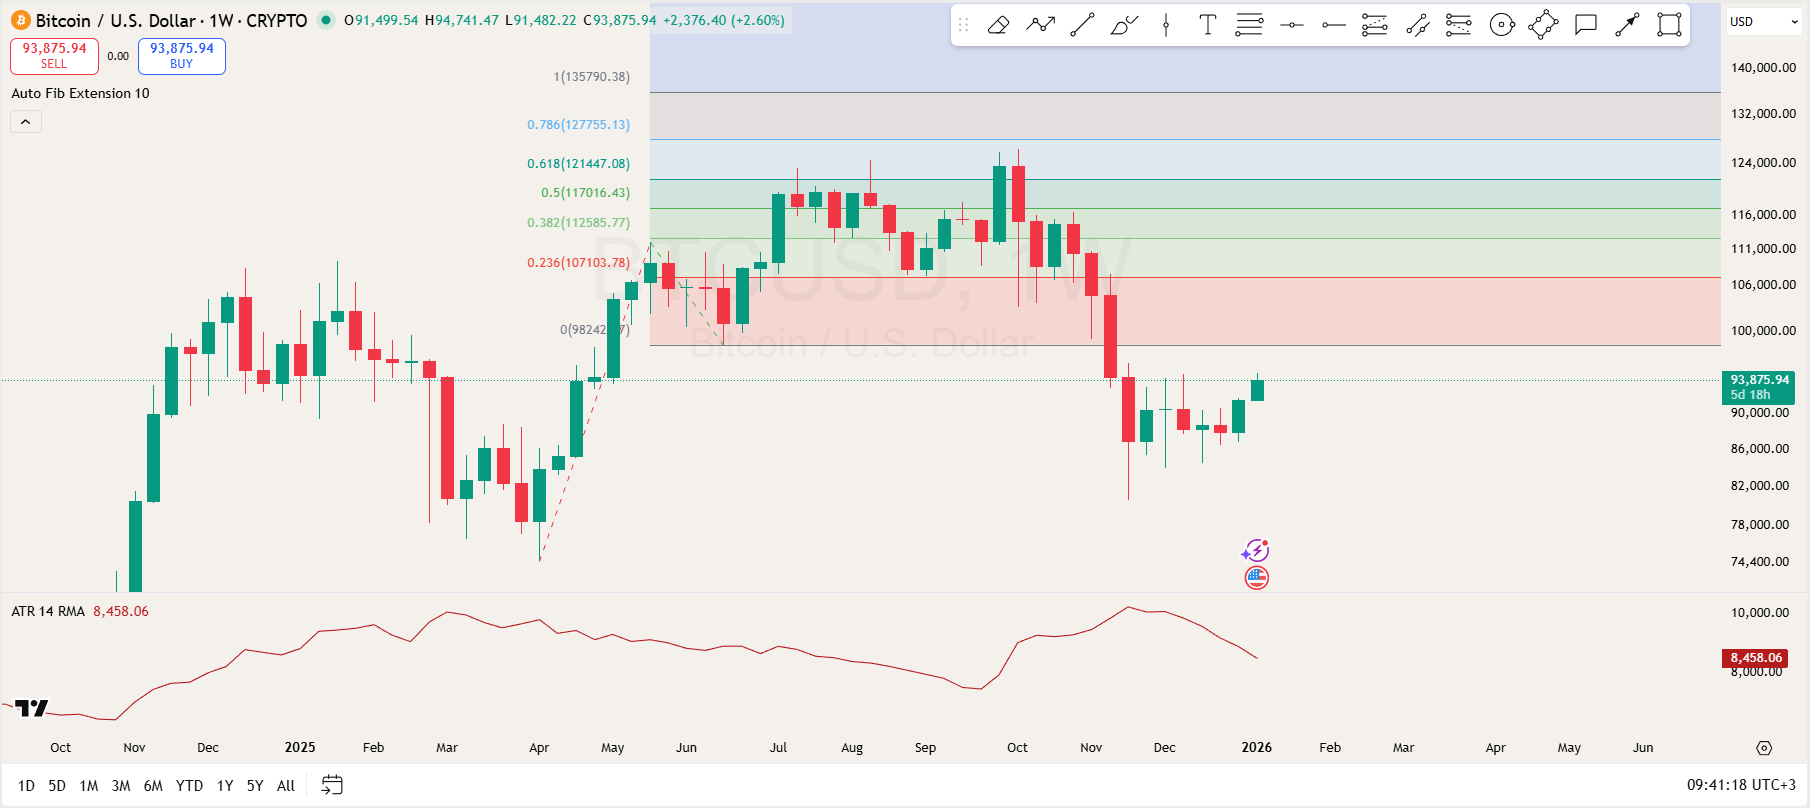
Moving up, the 0.236 Fibonacci level at $107,103 and the 0.382 level at $112,585 are crucial resistance points that Bitcoin would also need to break for further bullish momentum. A successful move past these levels would open the path toward the next Fibonacci resistance at $117,016, followed by the $127,755.
The Average True Range (ATR) at 8,458 suggests declining volatility. Typically, in periods of lower volatility, the price experiences stable price movements with fewer dramatic swings.
Bitcoin Spot Flows
Elsewhere, a spot flows chart shows mixed market sentiment across different time periods. In the short term, the 30-minute and 1-hour inflows are positive, with net inflows of $3.96 million and $13.64 million, respectively.
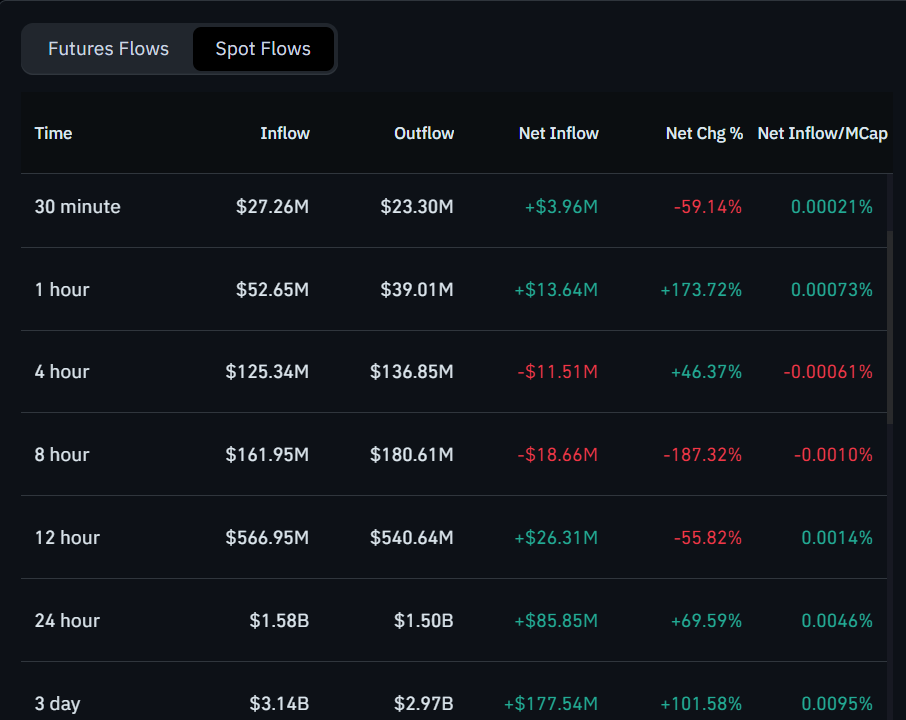
However, the 4-hour and 8-hour periods show increasing outflows, with $11.51 million and $18.66 million leaving the market, suggesting that selling pressure is building up in the short term. Nonetheless, this could also mean traders are moving liquidity out of the market for cold storage, a sign of an upcoming supply constraint. The 12-hour data indicate a smaller net inflow of $26.31 million, but with a slowing momentum, as seen in the 55.82% decrease in inflows.
Despite some short-term volatility, the longer timeframes show stronger positive sentiment. The 24-hour period sees $85.85 million in net inflows, a 69.59% increase, and the 3-day inflows have surged by 101.58%, totaling $177.54 million. This indicates growing investor confidence over the medium term. While this is positive, these inflows could also represent traders moving funds into exchanges in preparation for potential trades.