
A market veteran has identified a strong Bitcoin bullish divergence against gold, leading to speculations of a possible reversal of the bearish trend.
After an impressive start to the year, Bitcoin ($BTC) is on track to end 2025 bearish, representing its first red annual candlestick since the 2022 bear market. Currently, $BTC changes hands at $88,896, down 4.8% year-to-date. Meanwhile, gold (XAU) has been performing exceptionally well while the crypto firstborn declines.
After a stern battle for supremacy throughout 2025, gold had the upper hand in early October, right when Bitcoin’s woes began. Since then, $BTC has collapsed while gold spikes to new all-time highs, leading to a crash in the $BTC/GOLD pair.
Bitcoin Sees Bullish Divergence Against Gold
The pair has since dropped from 32 on Oct. 5 to the current figure of 20, meaning Bitcoin has collapsed from 32 ounces of gold to 20 ounces of gold within this period, representing an over 37.5% decline. However, amid this downtrend, Michaël van de Poppe, a veteran crypto analyst, has called attention to a pattern that may bode well for $BTC.
Specifically, van de Poppe confirmed in a recent analysis that the $BTC/GOLD pair has formed a “strong” bullish divergence on the daily chart.
For the uninitiated, a bullish divergence occurs when prices continue to witness lower lows amid consistent declines, but a momentum indicator, like the RSI, starts recording higher lows. This pattern often occurs during a downtrend and indicates that selling pressure may be weakening, and a bullish reversal could be on the horizon.
With the $BTC/GOLD pair, this bullish divergence started forming in late November. Specifically, on Nov. 21, the pair hit a low of 20, while the RSI dropped to 21.30. While the pair saw a lower low just below 20 on Dec. 1, the RSI witnessed a higher low of 26.83 on the same day.
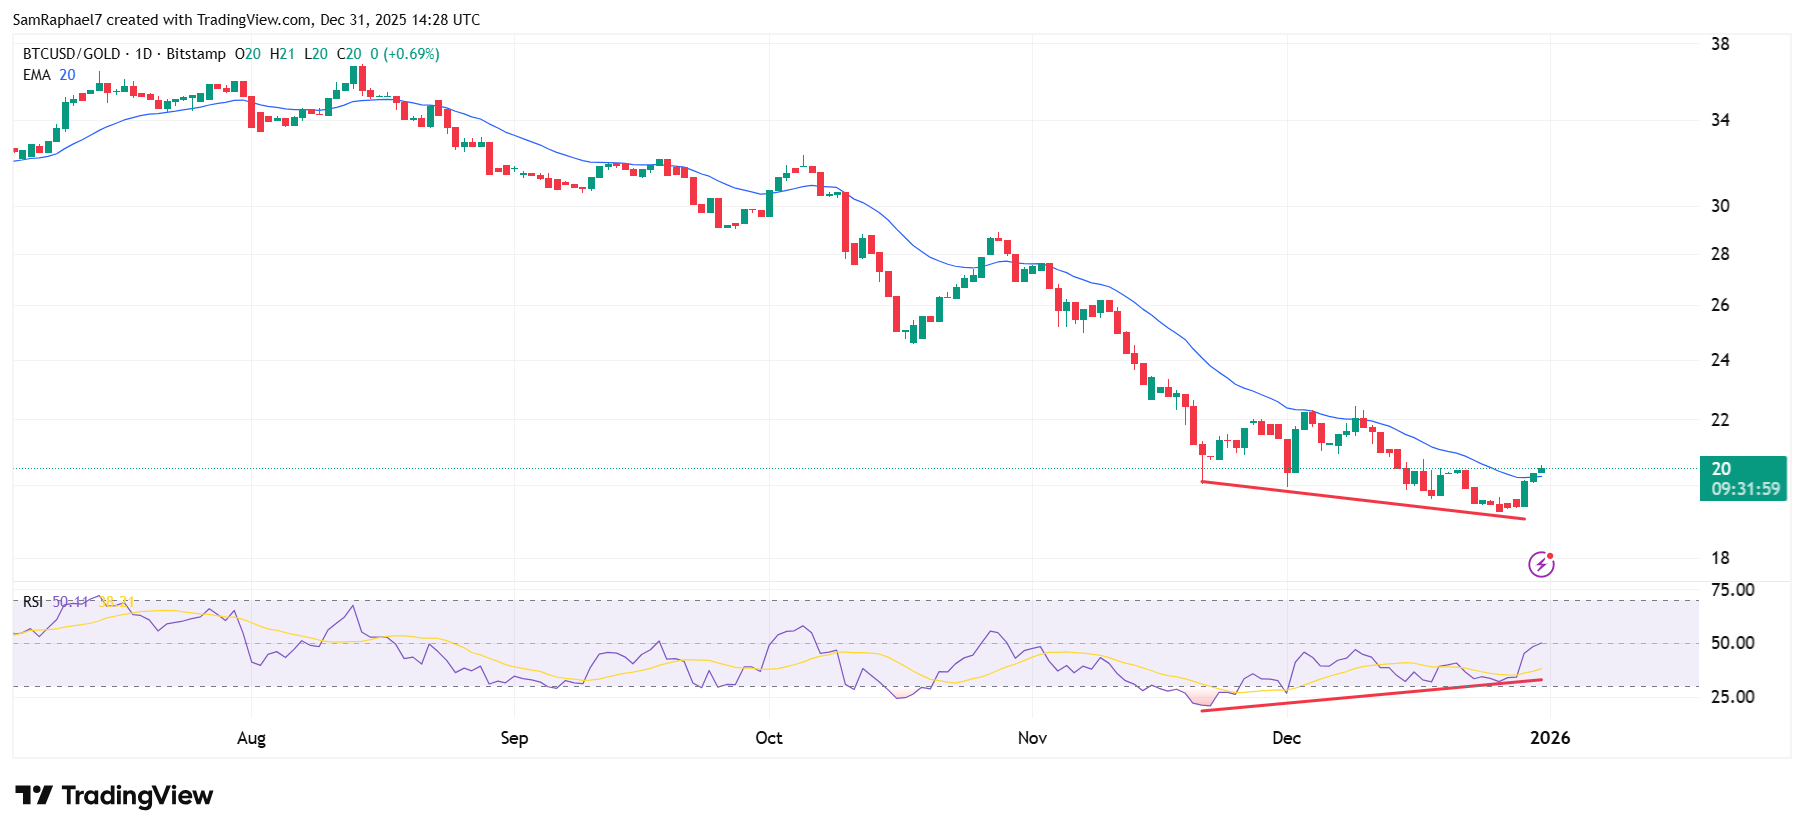
Interestingly, another lower low of 19 emerged on Dec. 26, but the RSI hit a higher low of 32.21. If the proper conditions align, this pattern may represent signs of a potential bullish reversal for Bitcoin, which has continued to underperform against gold this quarter.
Weekly RSI Hits Key Support Level
Meanwhile, Michaël van de Poppe also highlighted that the weekly RSI on the $BTC/GOLD pair recently collapsed to lows last witnessed during Bitcoin market bottoms. Data from the weekly chart shows that RSI has dropped to 31.85 at press time. The last time it saw this low was in November 2022 on the back of the FTX implosion, which marked Bitcoin’s bottom for that bear cycle.
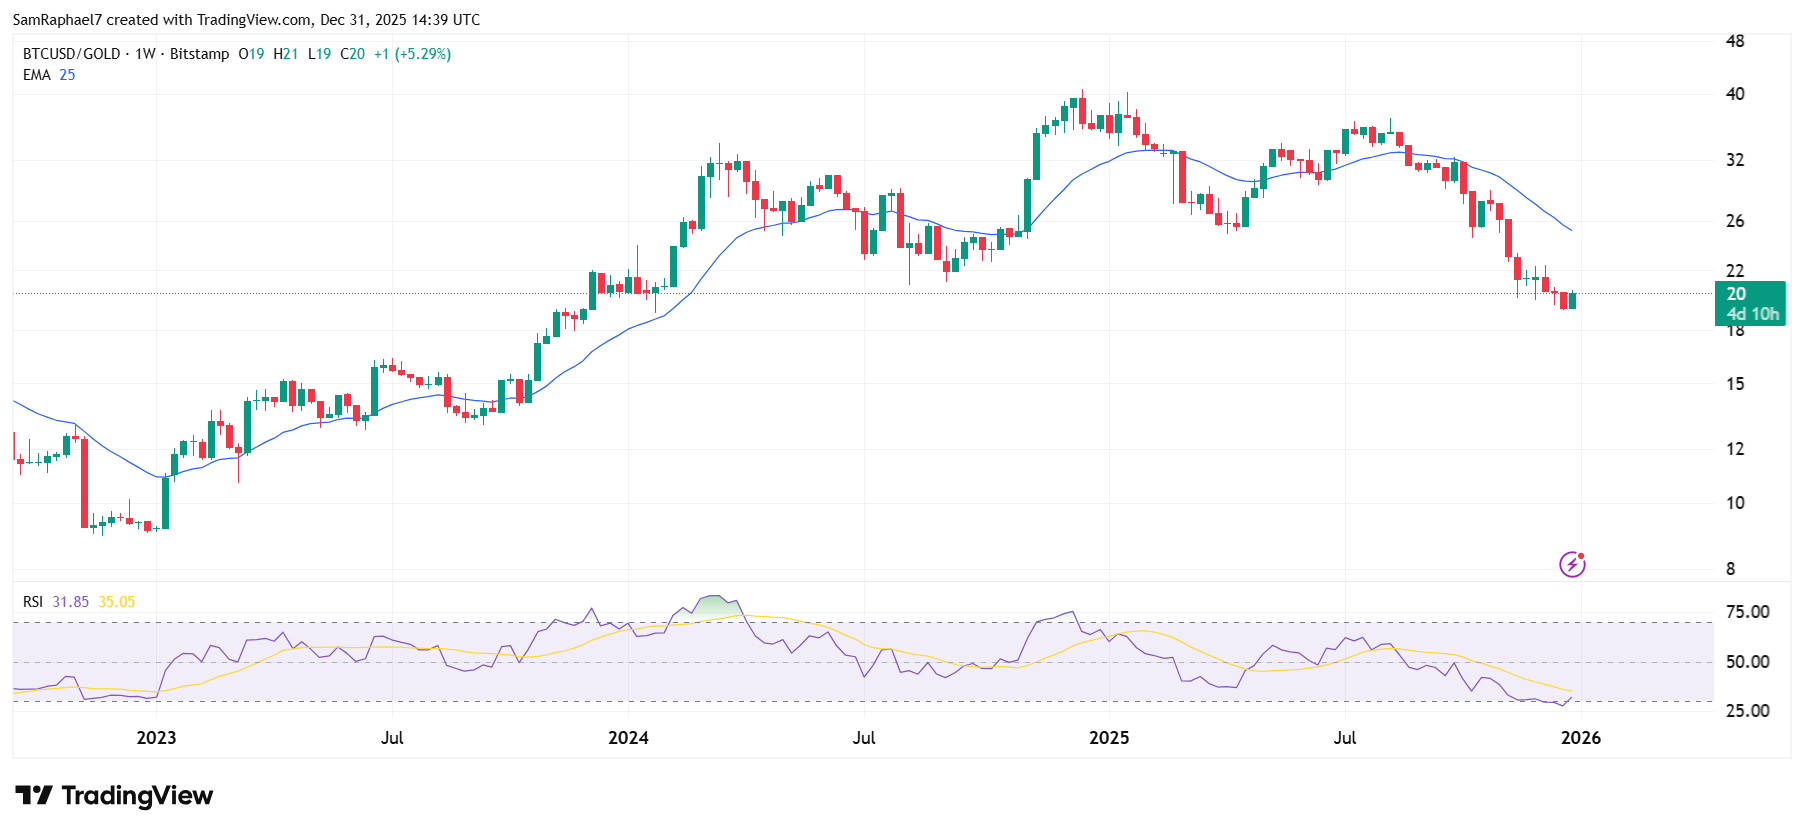
According to van de Poppe, similar RSI levels also marked Bitcoin’s bottom during the 2015 and 2018 bear markets. The combination of the daily bullish divergence and the weekly RSI lows bolsters the case of a possible upcoming reversal for Bitcoin. However, this is not guaranteed.
Meanwhile, $BTC seems to have gained some momentum against gold, rising from a low of 19 ounces of gold to the current value of 20. Yesterday, Bloomberg strategist Mike McGlone also confirmed that while Bitcoin had lost its volatility premium over silver, the crypto firstborn has maintained a historic support level.