
Bitcoin’s price as of Dec. 27, 2025, is a cool $87,382, holding a market cap of $1.74 trillion and logging $30.6 billion in 24-hour trading volume. The digital heavyweight floated between $86,673 and $88,965 in a tight intraday range, while the market exhibited signs of tightening ahead of a probable breakout. Indicators across multiple timeframes—from hourly noise to daily drama—paint a picture that’s less about certainty and more about watching the fuse before the spark.
Bitcoin Chart Outlook
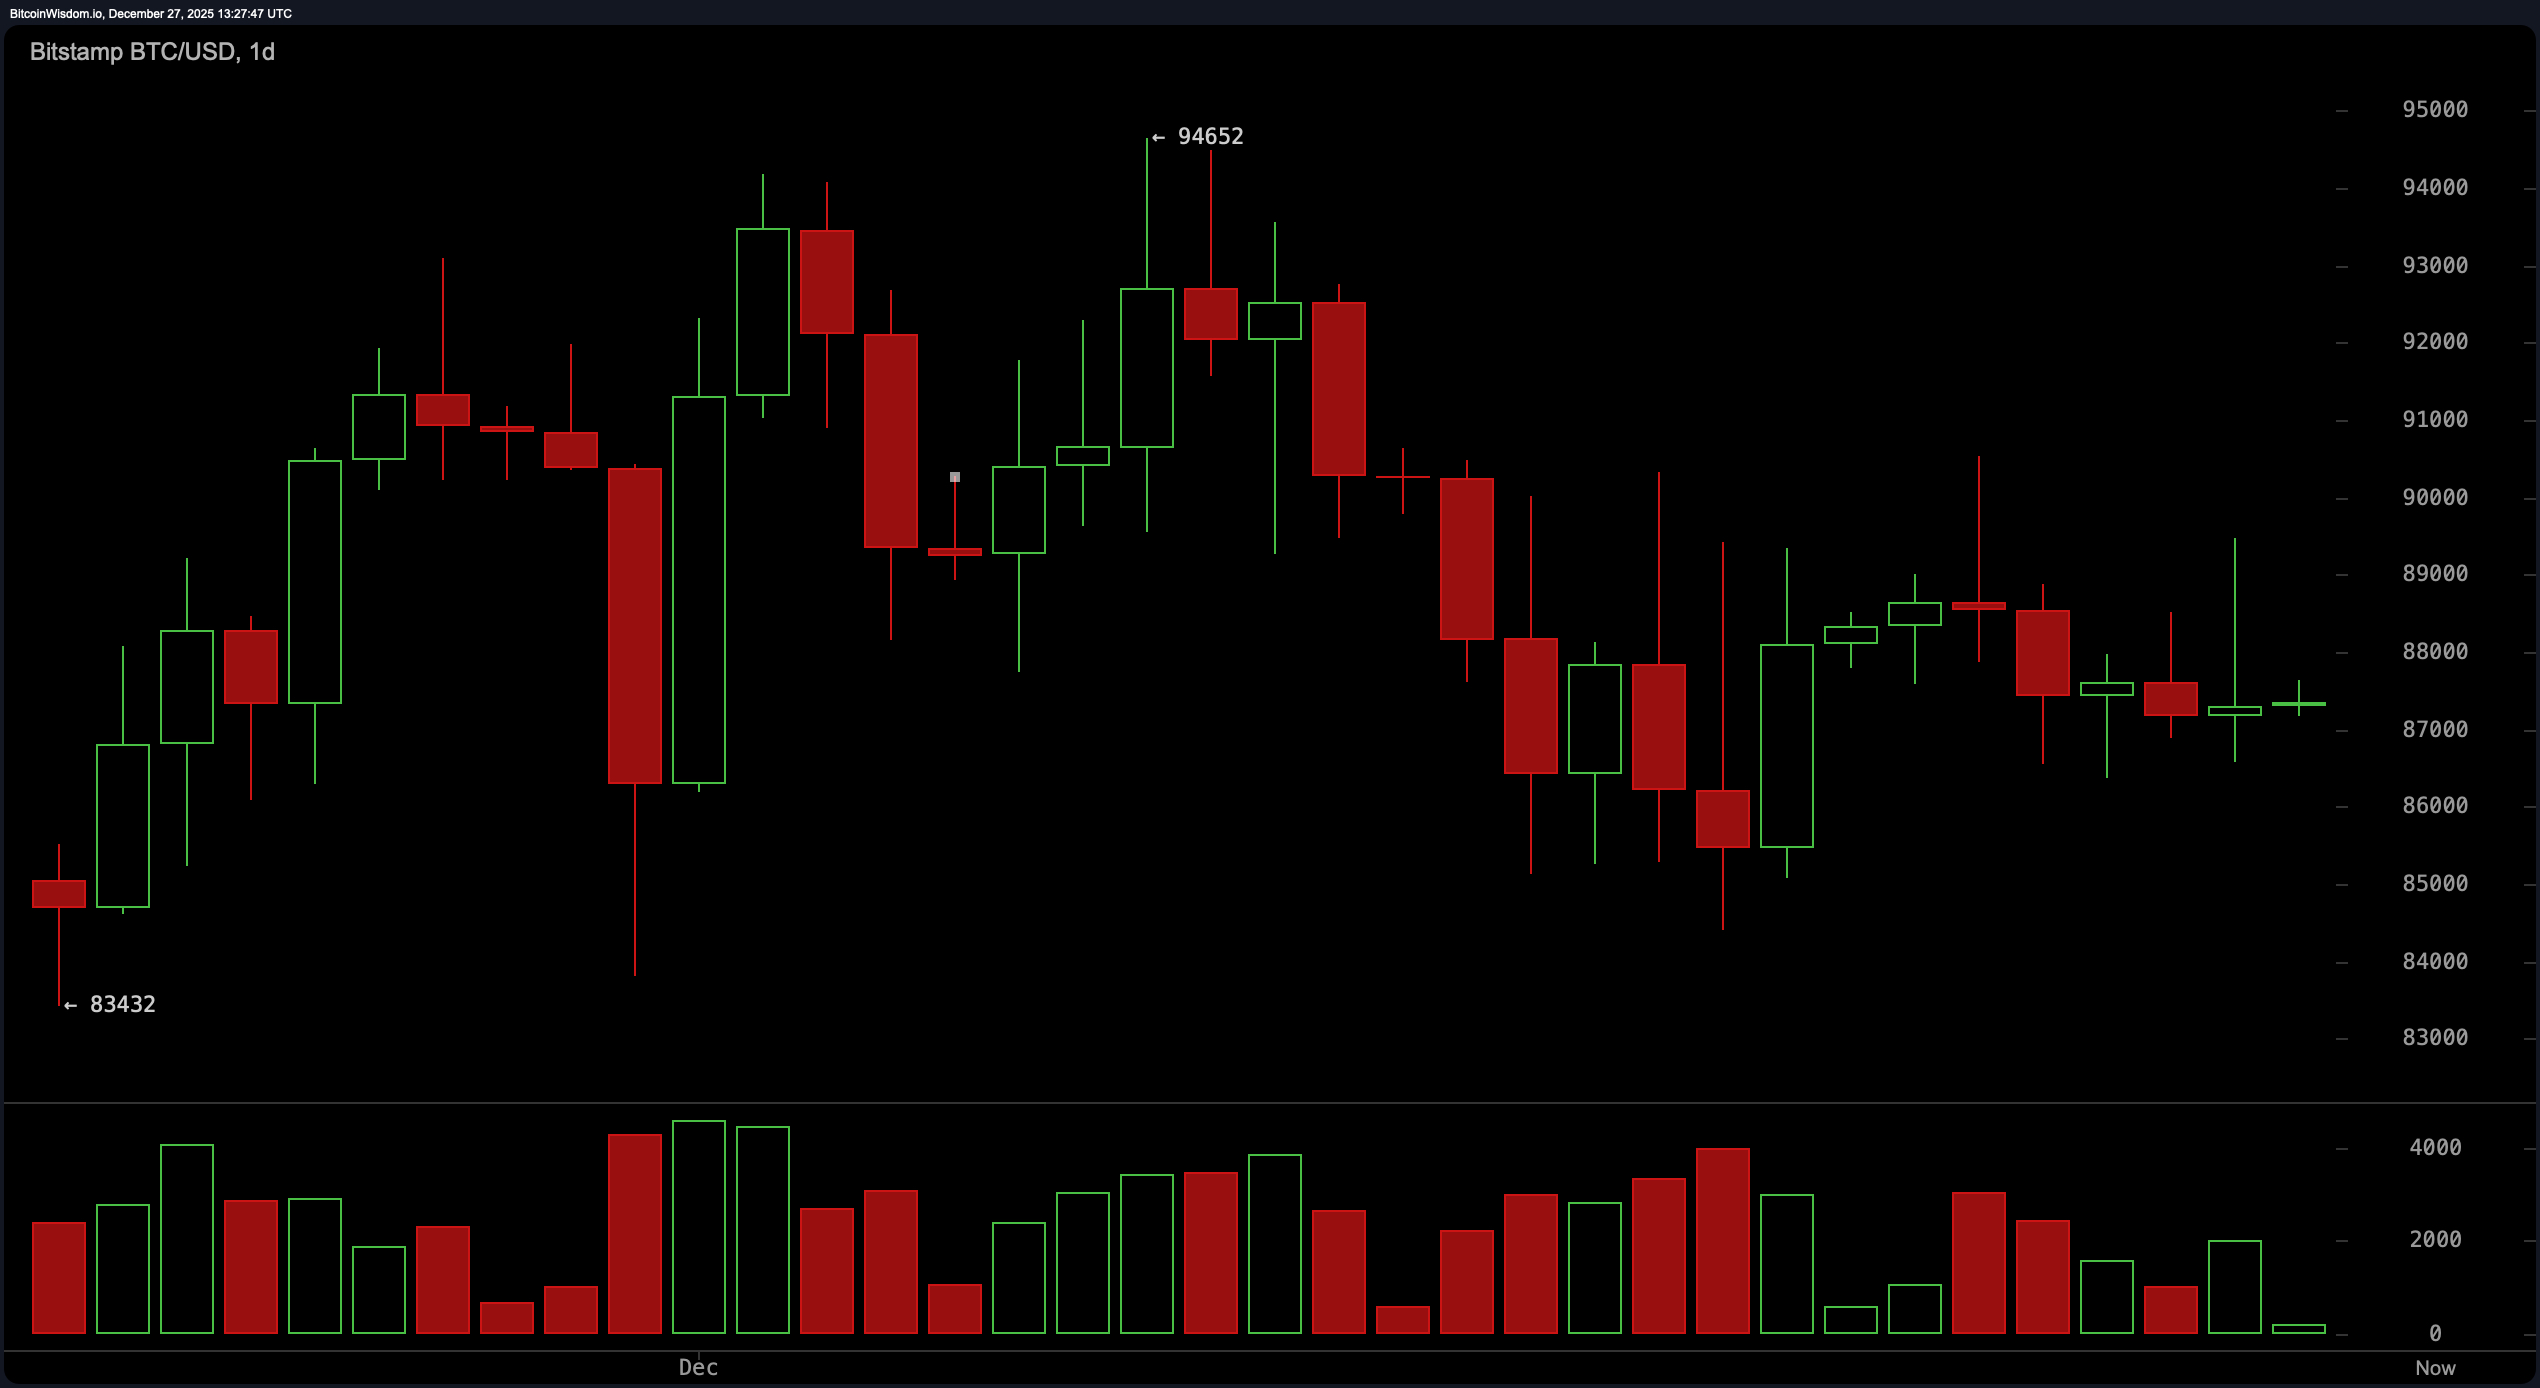
On the daily chart, bitcoin appears to be fashioning itself a robe stitched with lower highs and lower lows—a classic descending structure that hints at bearish sentiment without making a dramatic entrance just yet. After topping near $94,652, the price took a leisurely slide down into the $87,000–$88,000 zone, where it now hums quietly.
However, the dwindling volume is the real whisper here: reduced buying pressure is often the intermission before the next act. Traders would be wise to monitor a reclaim of the $90,000 level, especially with some volume fireworks, before declaring the bulls back on stage.
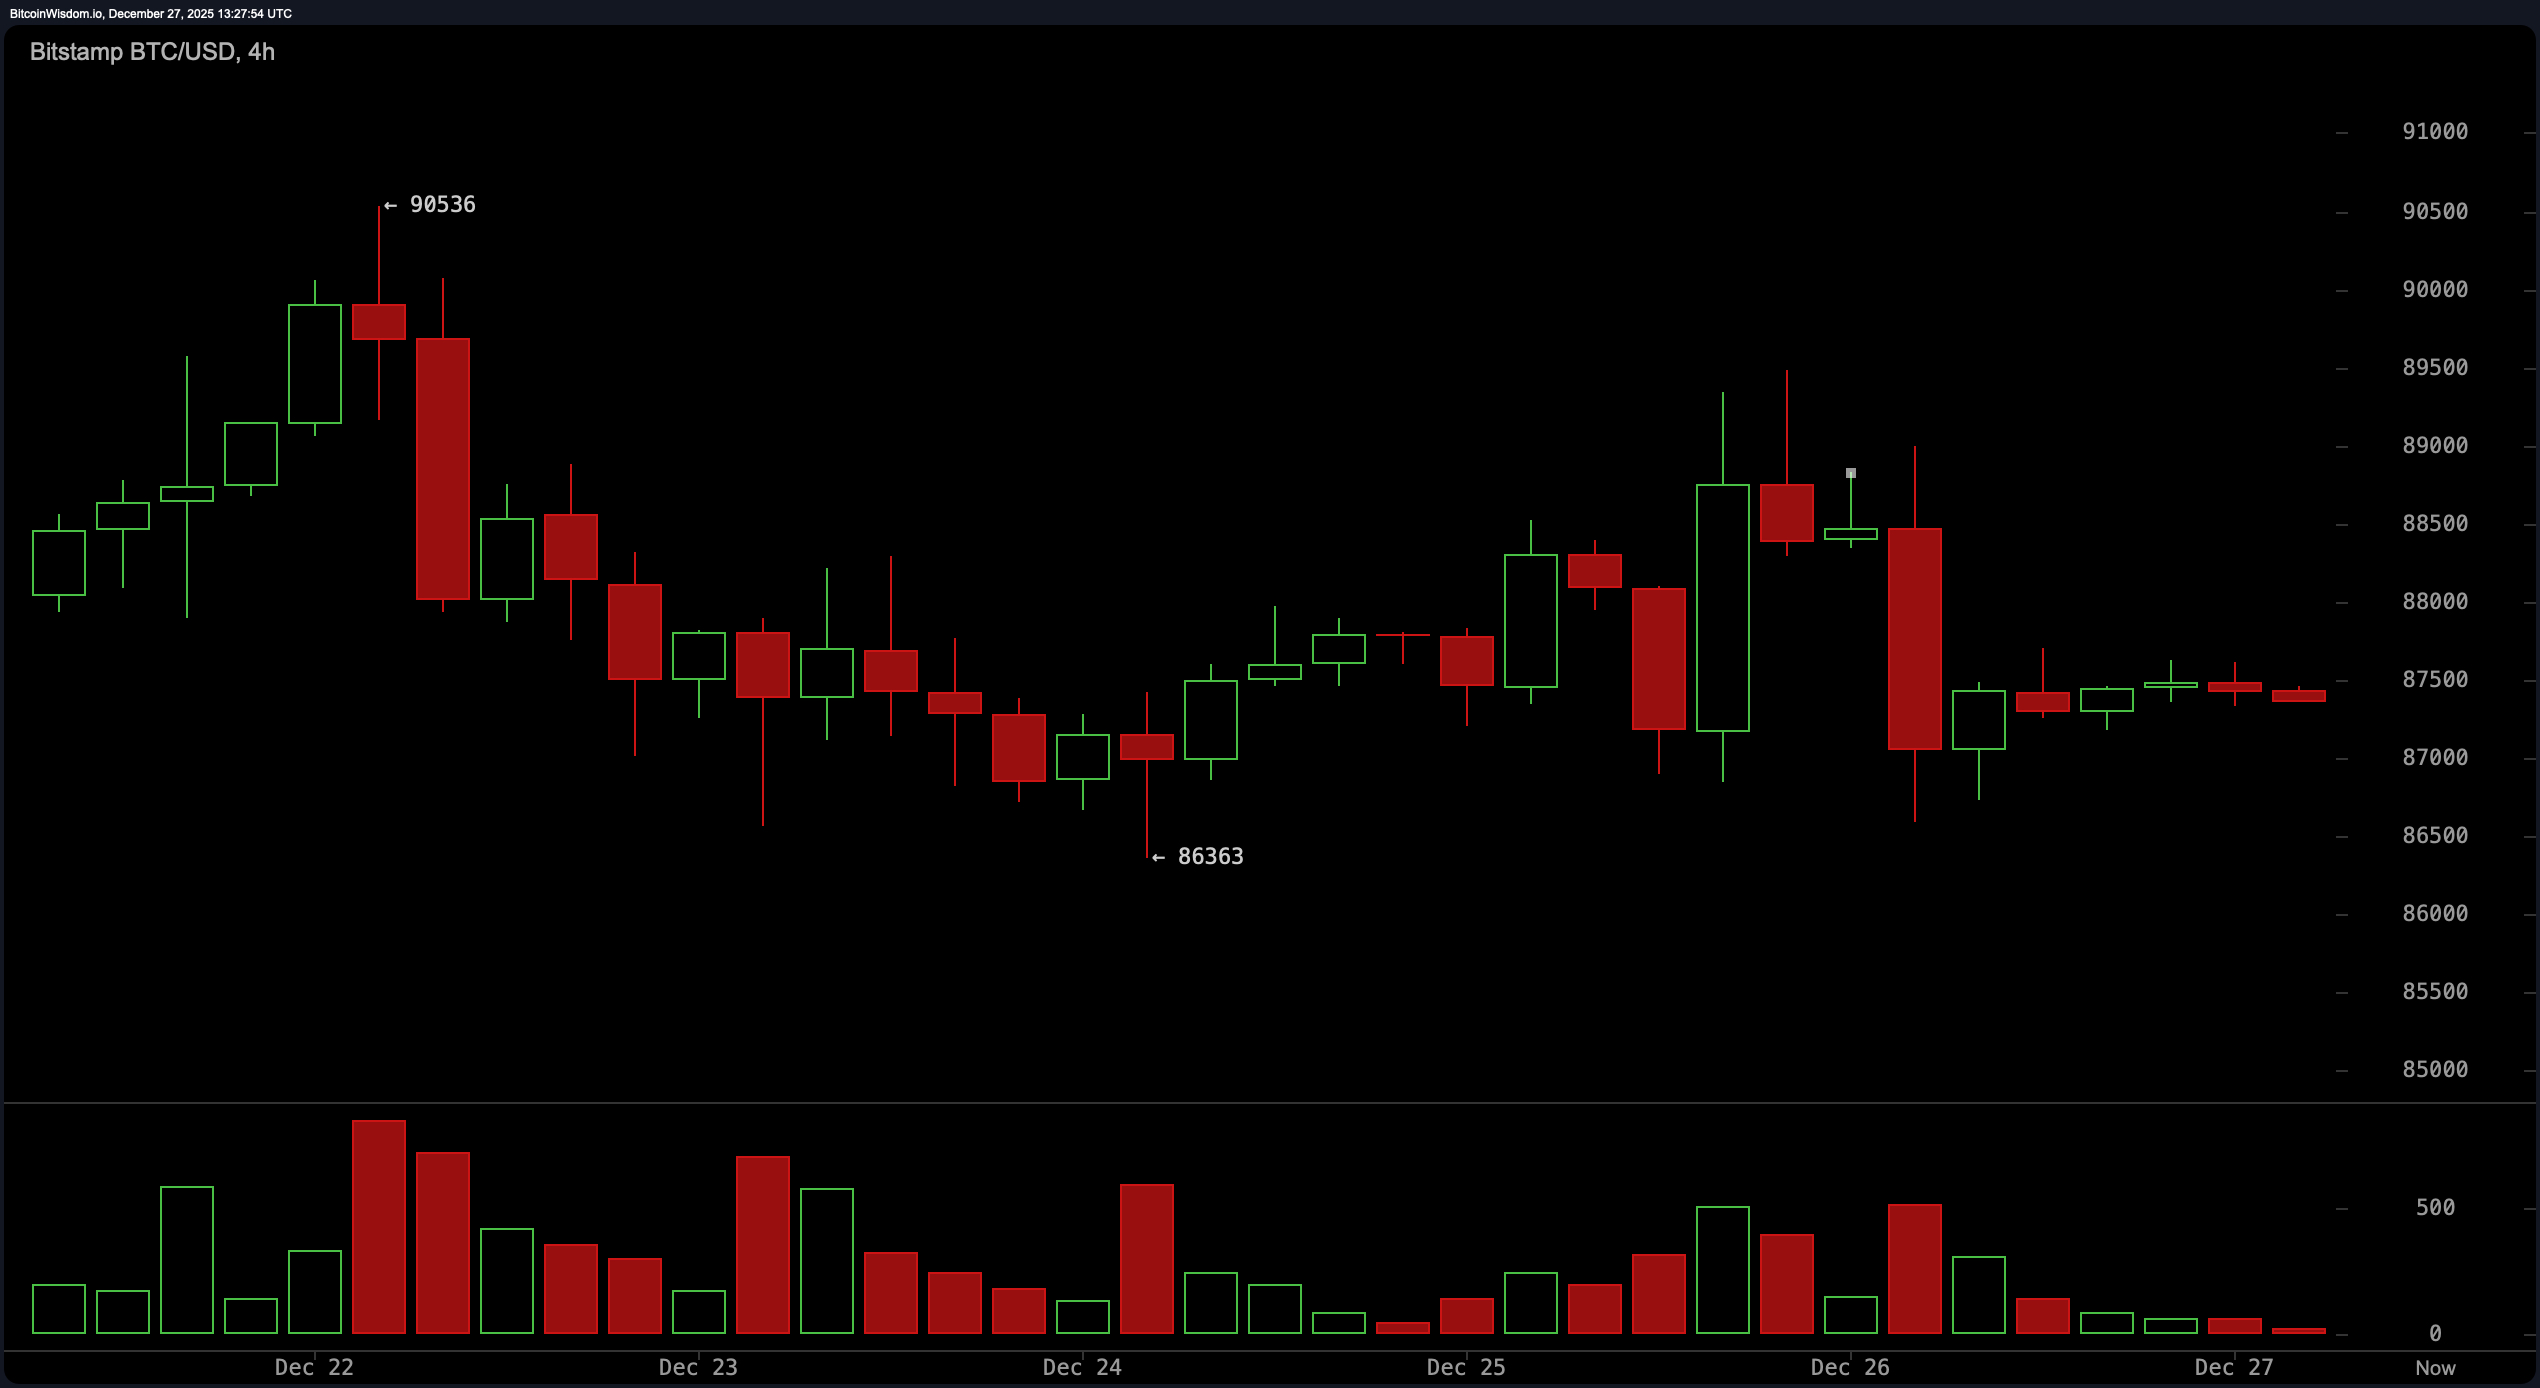
On the 4-hour chart, bitcoin’s mood gets a little more jaded. The $90,536 rejection came in hard and fast, escorted by a brigade of red candles—clearly, someone didn’t RSVP to the rally. Support at $86,363 has thus far stood firm, like a bouncer at the $86K club door, but consolidation under resistance tells us sellers still have the louder voice in the room. Notably, upswings are being met with lighter volume, while sell-offs are making more noise—a classic case of bearish pressure masquerading as a sideways market.
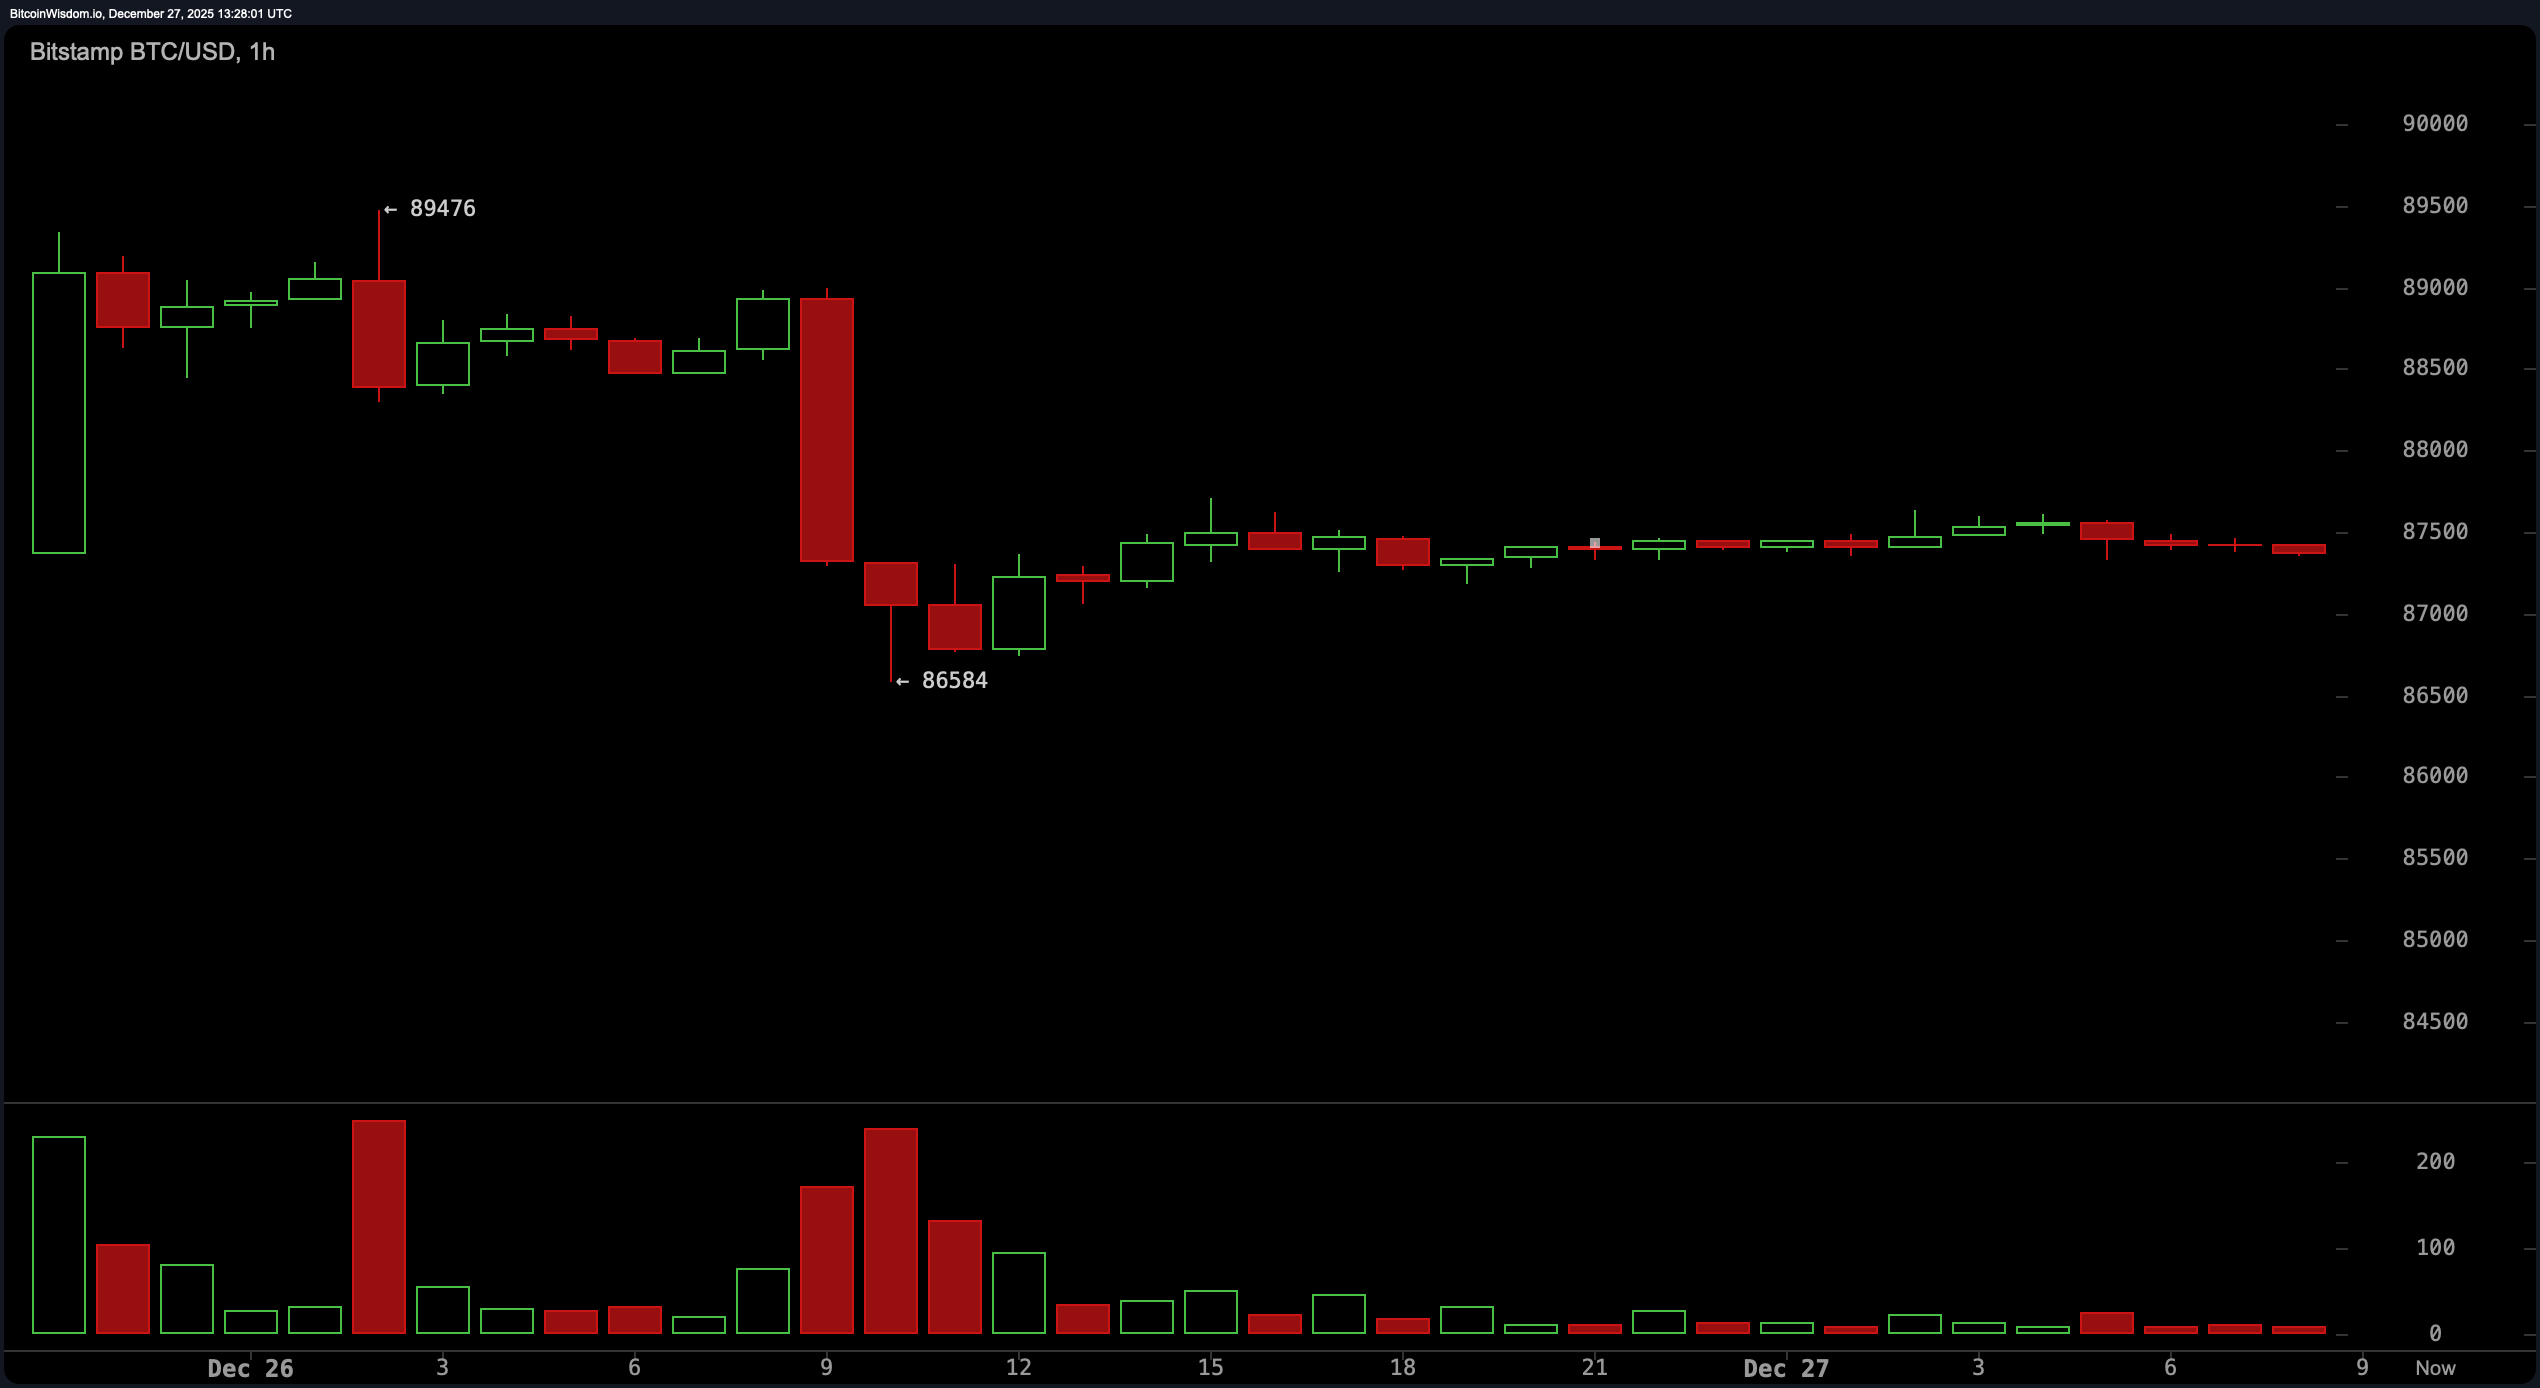
Zooming into the 1-hour chart is like stepping into a cryptographic fog. A flash drop from approximately $89,400 to $86,500 spooked the tape, only to be followed by price action that can best be described as… politely indecisive. The range is tight—between $87,000 and $87,500—and the volume? Practically whispering. This could be a textbook accumulation zone, preparing for a breakout above $88,000, or it could be a cunning bear flag, winding up for another leg down should $86,000 crumble.
The oscillators don’t exactly scream clarity either, which is perfect if you enjoy ambiguity served with a side of caution. The relative strength index ( RSI), Stochastic, commodity channel index (CCI), average directional index (ADX), and Awesome oscillator are all flashing the ultimate non-committal status: neutral. Only the momentum and moving average convergence divergence ( MACD) are nodding slightly upward. If the market were a cocktail party, these two would be the only guests holding espresso shots while everyone else clutches water.
As for the moving averages (MAs)? They’re putting on a masterclass in collective skepticism. All short-term and long-term moving averages—from the exponential moving average (EMA) 10 through the simple moving average (SMA) 200—are parked above the current price and leaning bearish. It’s like the entire moving average family got together and decided bitcoin needed a timeout. Whether price can break through $88,000–$88,500 resistance will determine if it’s merely resting or plotting its next moonshot. Until then, the advice is simple: watch the volume, respect the chop, and remember—breakouts don’t RSVP, they crash the party.
Bull Verdict:
If bitcoin can push decisively above the $88,500 threshold with meaningful volume, the setup favors a short-term revisit to the $90,000–$91,000 resistance zone. With the momentum (10) and moving average convergence divergence ( MACD) indicators flashing green while others snooze, there’s a slim but tangible window for upward continuation. For the bulls, it’s not a question of strength—it’s a question of timing and conviction.
Bear Verdict:
Failure to hold above the $86,000 support risks confirming the bear flag pattern spotted on the 1-hour chart, with potential downside targets around $83,500–$84,000. The ensemble of moving averages unanimously towering above price—and volume favoring sell-offs over rallies—suggests the path of least resistance could still tilt south. Bears may not be roaring yet, but they’re definitely circling.
FAQ ❓
- What is bitcoin’s price today? Bitcoin is trading at $87,382 as of Dec. 27, 2025.
- Is bitcoin going up or down right now? Bitcoin is consolidating in a tight range with mixed technical signals.
- What are key levels to watch for bitcoin?Watch $88,500 for potential upside and $86,000 for possible downside.
- Why is bitcoin’s volume so low today?It’s the holiday season, and quite normal. Low volume also suggests market indecision or a setup for a larger move.