
Bitcoin faces pivotal Fibonacci retracement levels as support and resistance amid bearish MACD signals and dominant long liquidations.
Bitcoin is teetering on the edge of a potential market shift, with its price dipping to $89,675.70 amid a 0.6% 24-hour decline. Yet, further red flags are evident: a 24-hour trading volume of $35.43 billion suggests sustained interest, but performance metrics paint a concerning picture, including a 2.0% weekly drop, 6.8% monthly slide, and an 11.8% annual retreat.
However, the 14-day performance stands out as a modest bright spot amid the broader pullback, showing a +3.7% gain that suggests short-term resilience. Could this 14-day uptick signal a brewing rebound, or a pause before further downside pressure takes hold?
Bitcoin Price Analysis
Diving deeper into Bitcoin’s price action through a technical lens, the weekly chart reveals Fibonacci levels serving as pivotal guides for support and resistance. Drawn from the October peak near $126,030 to a swing low around $74,458, these levels highlight key zones.
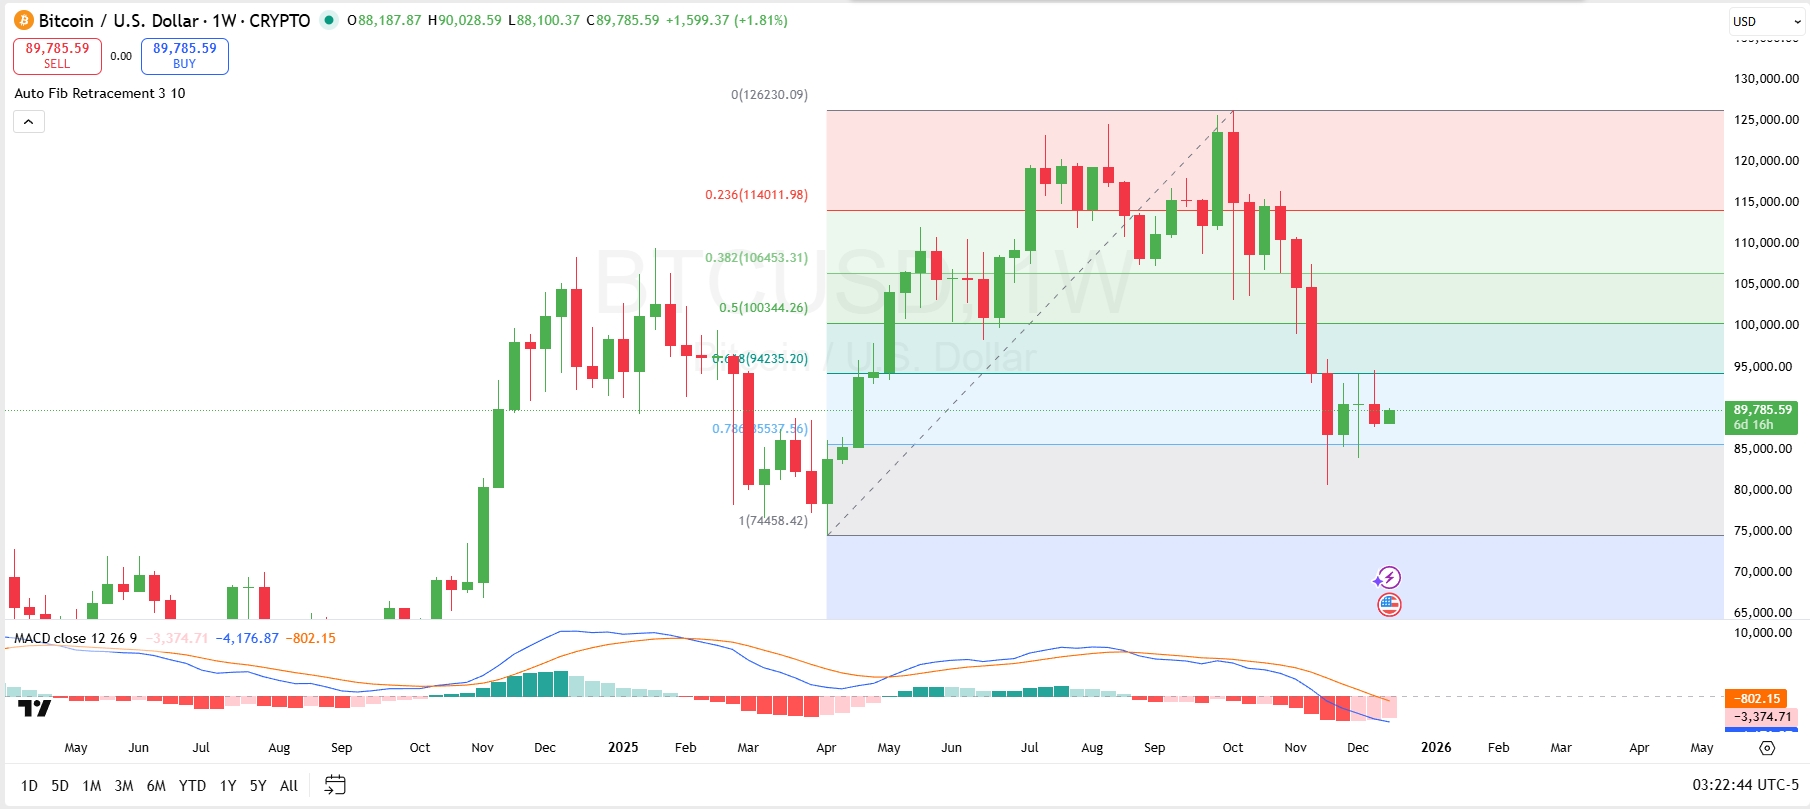
Immediate resistance looms at the 61.8% retracement ($94,235), a golden ratio often acting as a formidable barrier in recoveries, followed by the 50% midpoint ($100,344) and 38.2% ($106,453) as potential upside targets if bullish momentum rebuilds.
On the downside, support has materialized around the 78.6% level ($85,537), where price appears to be consolidating after a sharp wick just above $80,000. This potentially signals a deeper floor if breached, with the 100% extension back to $74,458 as the next critical buffer against further declines.
Moreover, technical indicators further underscore caution, with the MACD (Moving Average Convergence Divergence) flashing bearish signals: the MACD line has crossed below the signal line, and the histogram displays expanding red bars, indicating accelerating downward momentum and a potential continuation of the correction.
Bitcoin Liquidation Data
Elsewhere, the Coinglass liquidation dashboard reveals a story of surging pain, particularly skewed toward long positions in the medium term.
Over the past 12 hours, the total rekt (liquidated) value has reached $52.18 million, with longs bearing the brunt at $36.41 million, compared to shorts at $15.77 million, indicating a downward price thrust that caught bullish speculators off guard.
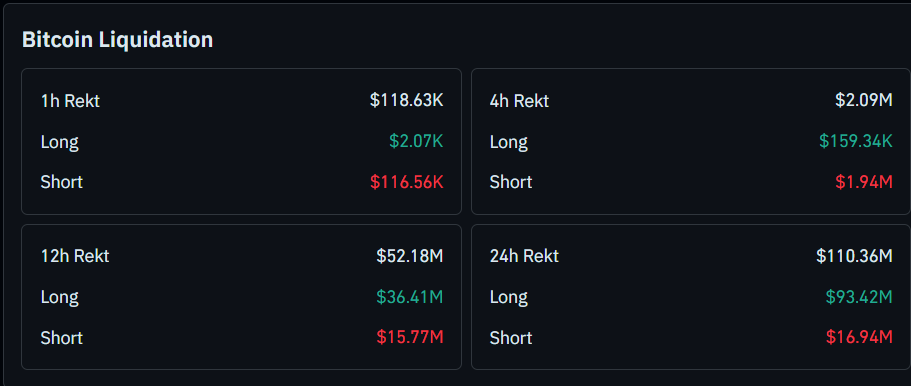
Extending to the 24-hour window, the wreckage amplifies to $110.36 million overall, dominated by $93.42 million in long liquidations against a comparatively modest $16.94 million for shorts. This has possibly contributed to the observed volatility and hinting at bearish dominance in the session.