
This is a technical analysis post by CoinDesk analyst and Chartered Market Technician Omkar Godbole.
Bitcoin's $BTC$89,629.86 three-week price bounce looks vulnerable to a reversal as the Nasdaq, Wall Street's tech-heavy index, hit a wall last week, hinting at potential trouble ahead.
Since hitting $80,000 lows on Nov. 21, $BTC has steadily bounced above $90,000, carving higher lows and highs in a countertrend rising channel within the broader downtrend.
The recovery appeared to have legs, as the dollar index declined following Wednesday's Fed rate cut, and a longer-duration trend indicator hinted at a potential bullish shift in $BTC momentum.
Yet these failed to spark a sustained rally. Instead, $BTC retreated from $93,000 Friday to nearly $88,000 on Sunday before stabilizing around $89,600 at press time.
$BTC ended last week with a bearish candle comprising long upper wick, indicating rejection above $94,000 and a small red body with negligible lower wick. This classic rejection pattern signals fading bullish momentum and "sell-the-rallies" dominance at highs.
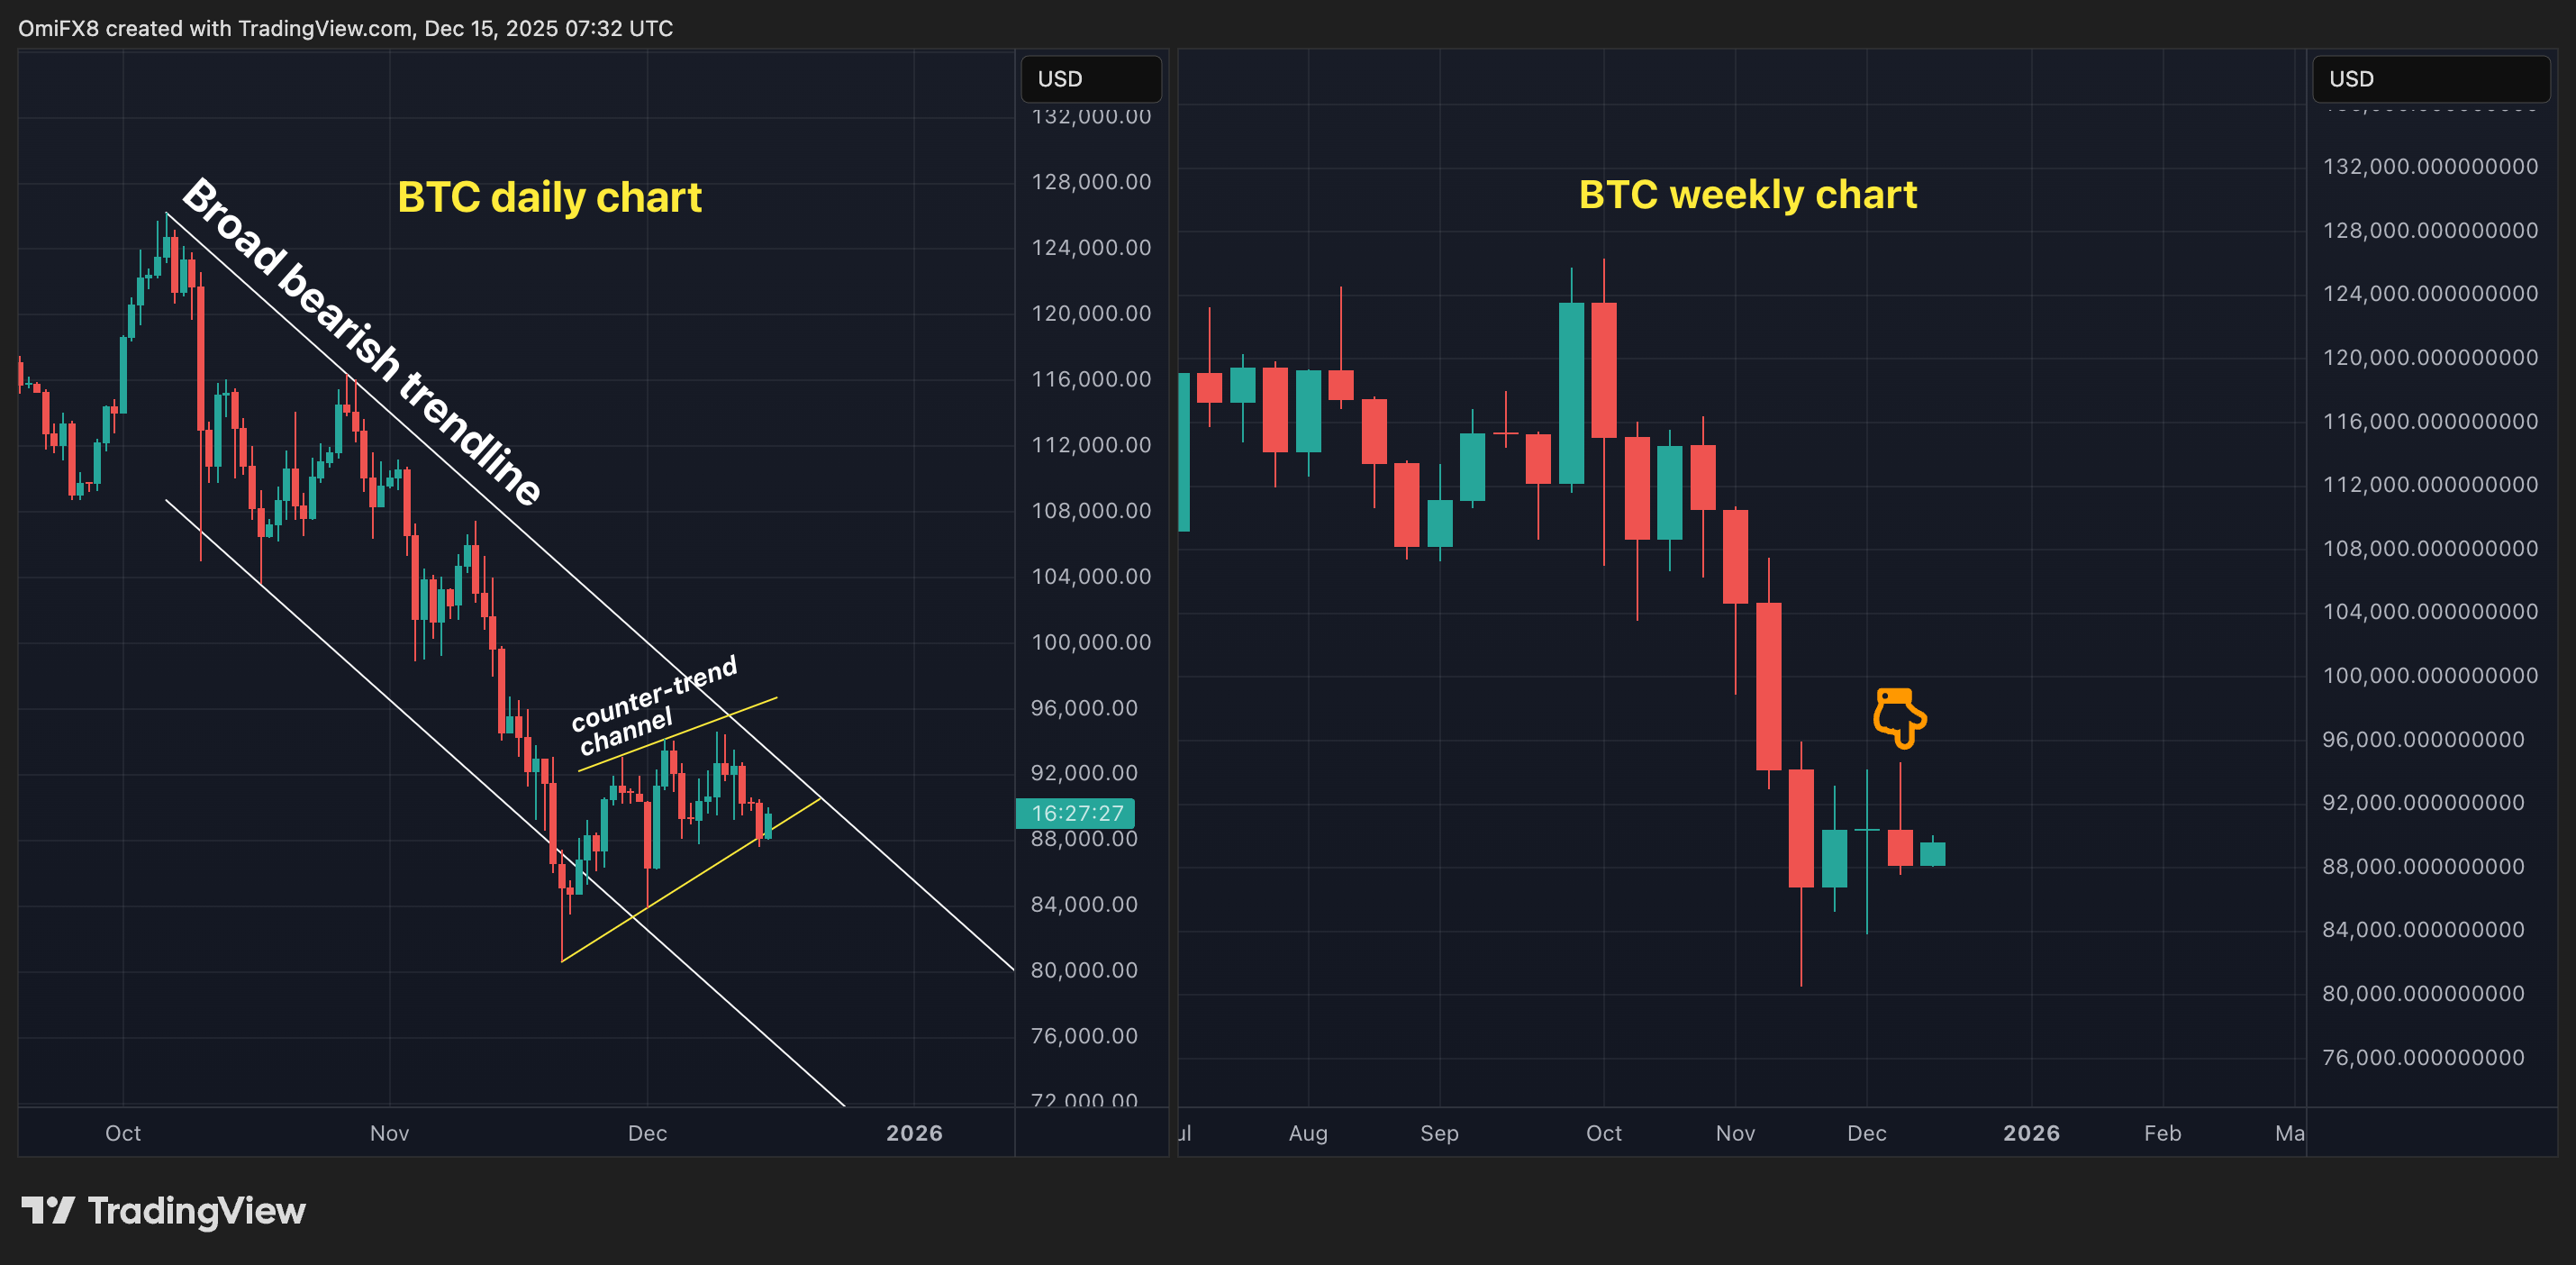
This pattern, alongside Nasdaq's stalled rebound from November lows, raises concerns of a deeper $BTC drop toward $80,000.
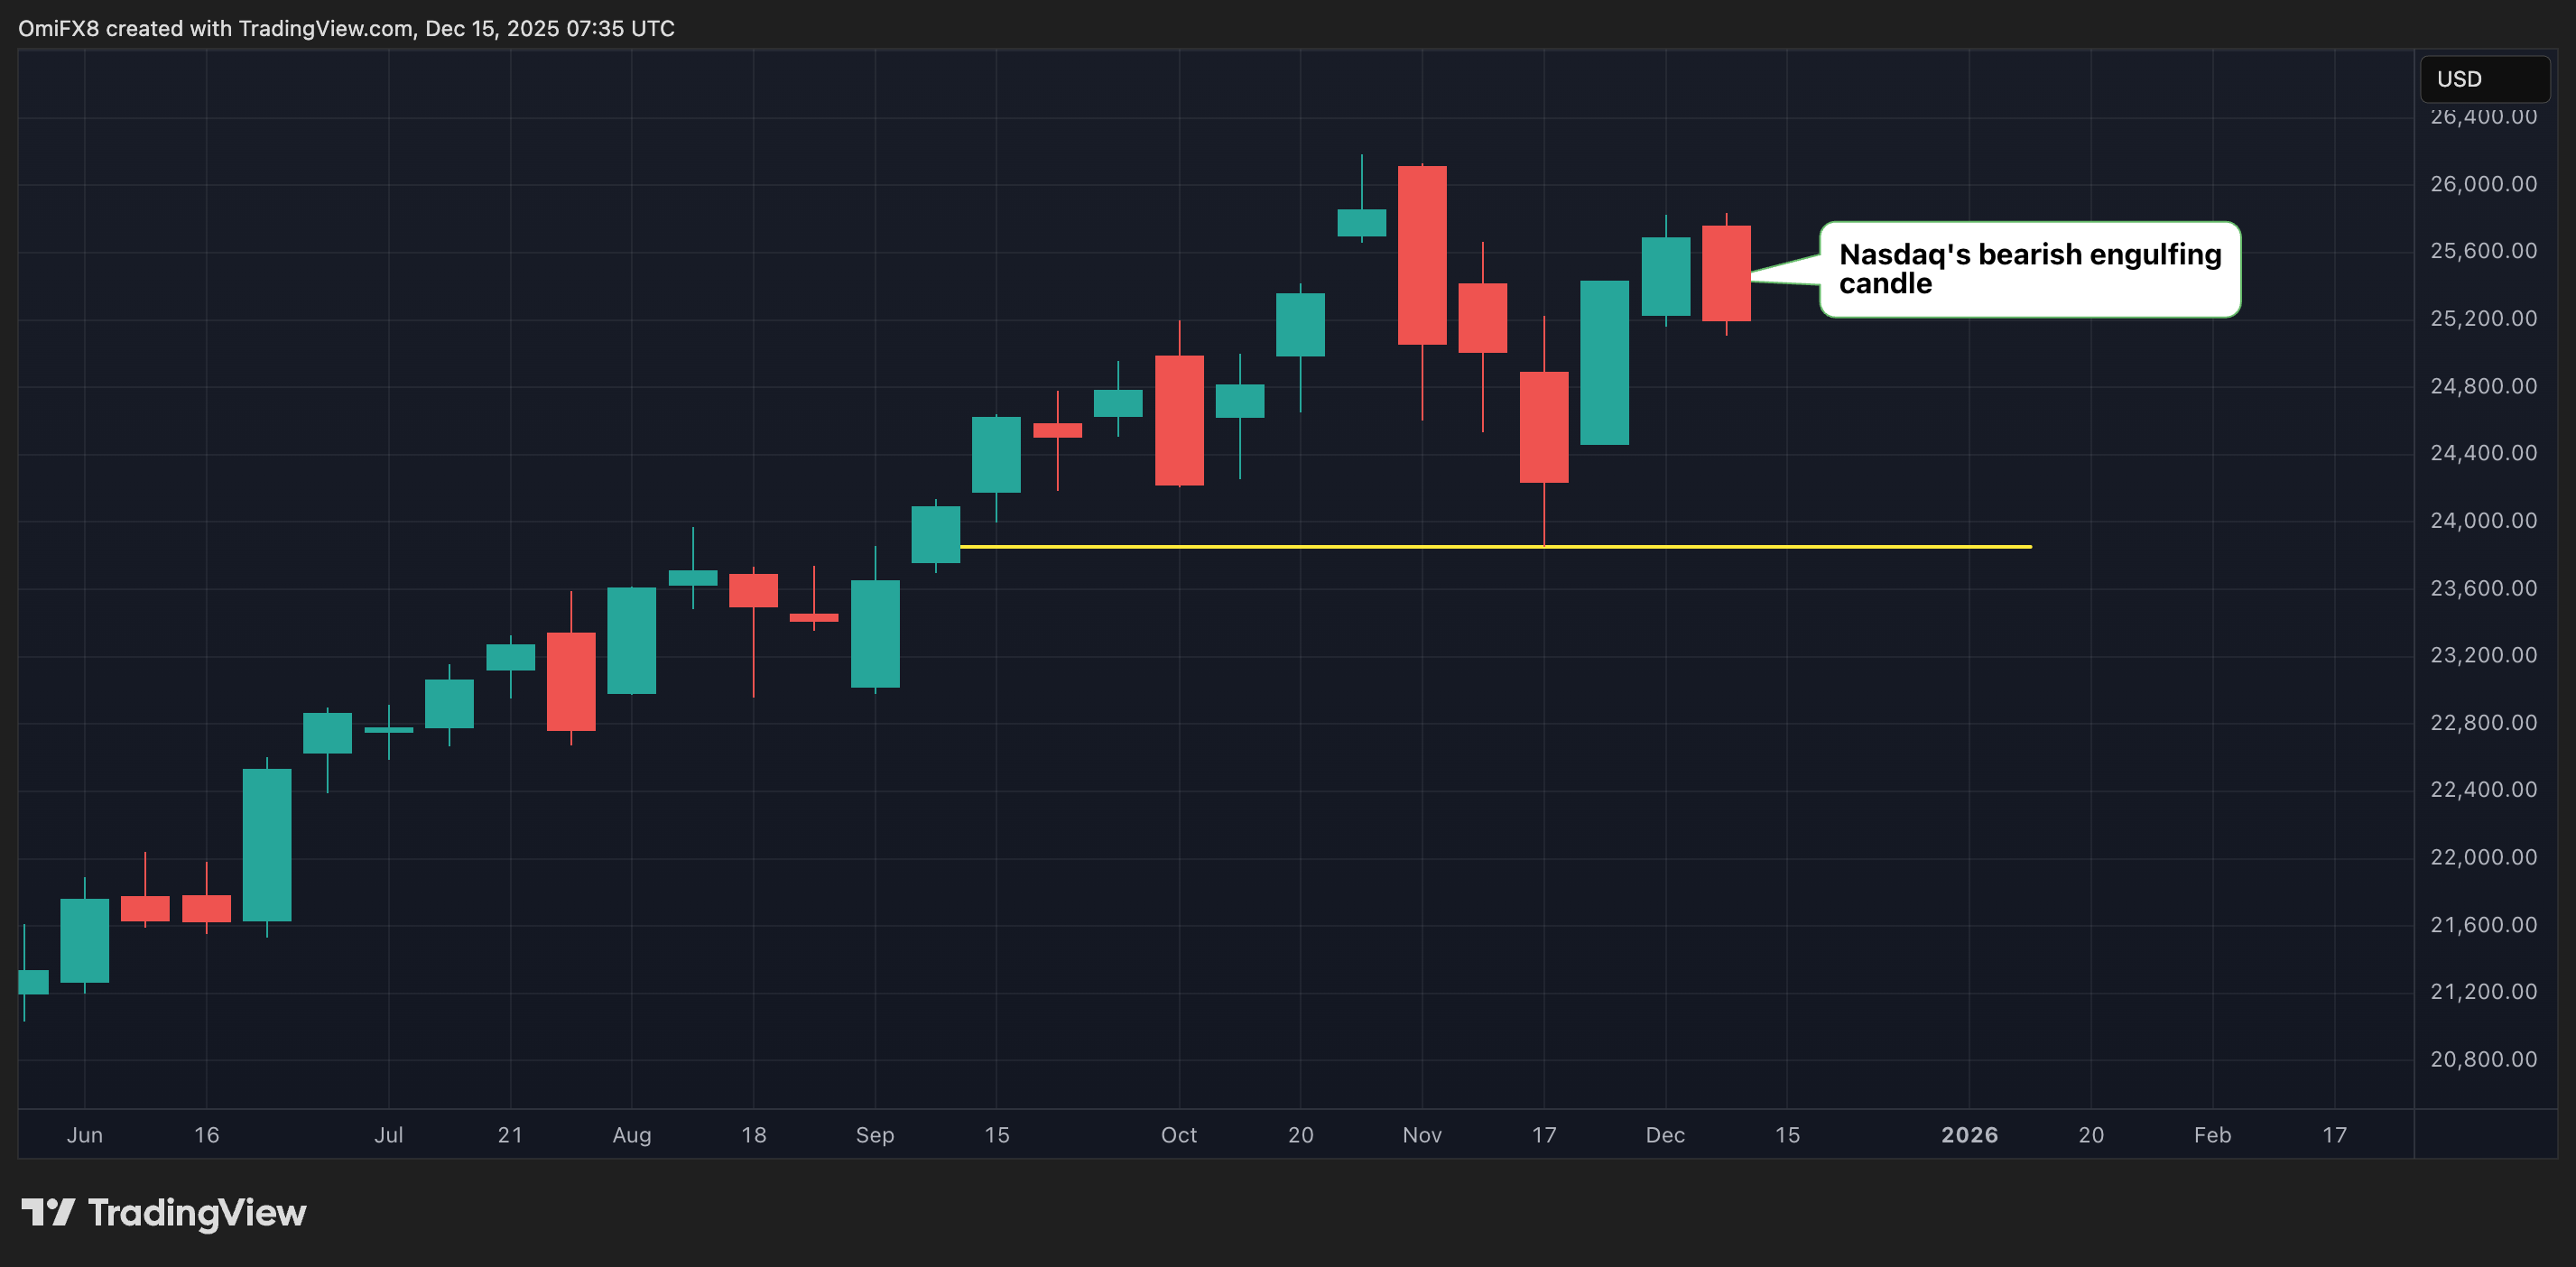
Nasdaq dropped nearly 2% last week, forming a bearish engulfing candle that reversed the prior week's gain. Coupled with a bearish MACD on the weekly timeframe, it signals potential downside volatility that could spill into $BTC, given their strong positive correlation, especially pronounced during NDX's downtrends when $BTC often amplifies the hit, as Wintermute recently noted.
Another yellow flag for risk-asset bulls is the $MOVE index, which measures the 30-day implied volatility in U.S. Treasury notes.
The $MOVE index put in an inverted hammer candle last week. This candlestick pattern, appearing after a prolonged downtrend as in $MOVE's case, is taken to represent an early sign of bullish revival.
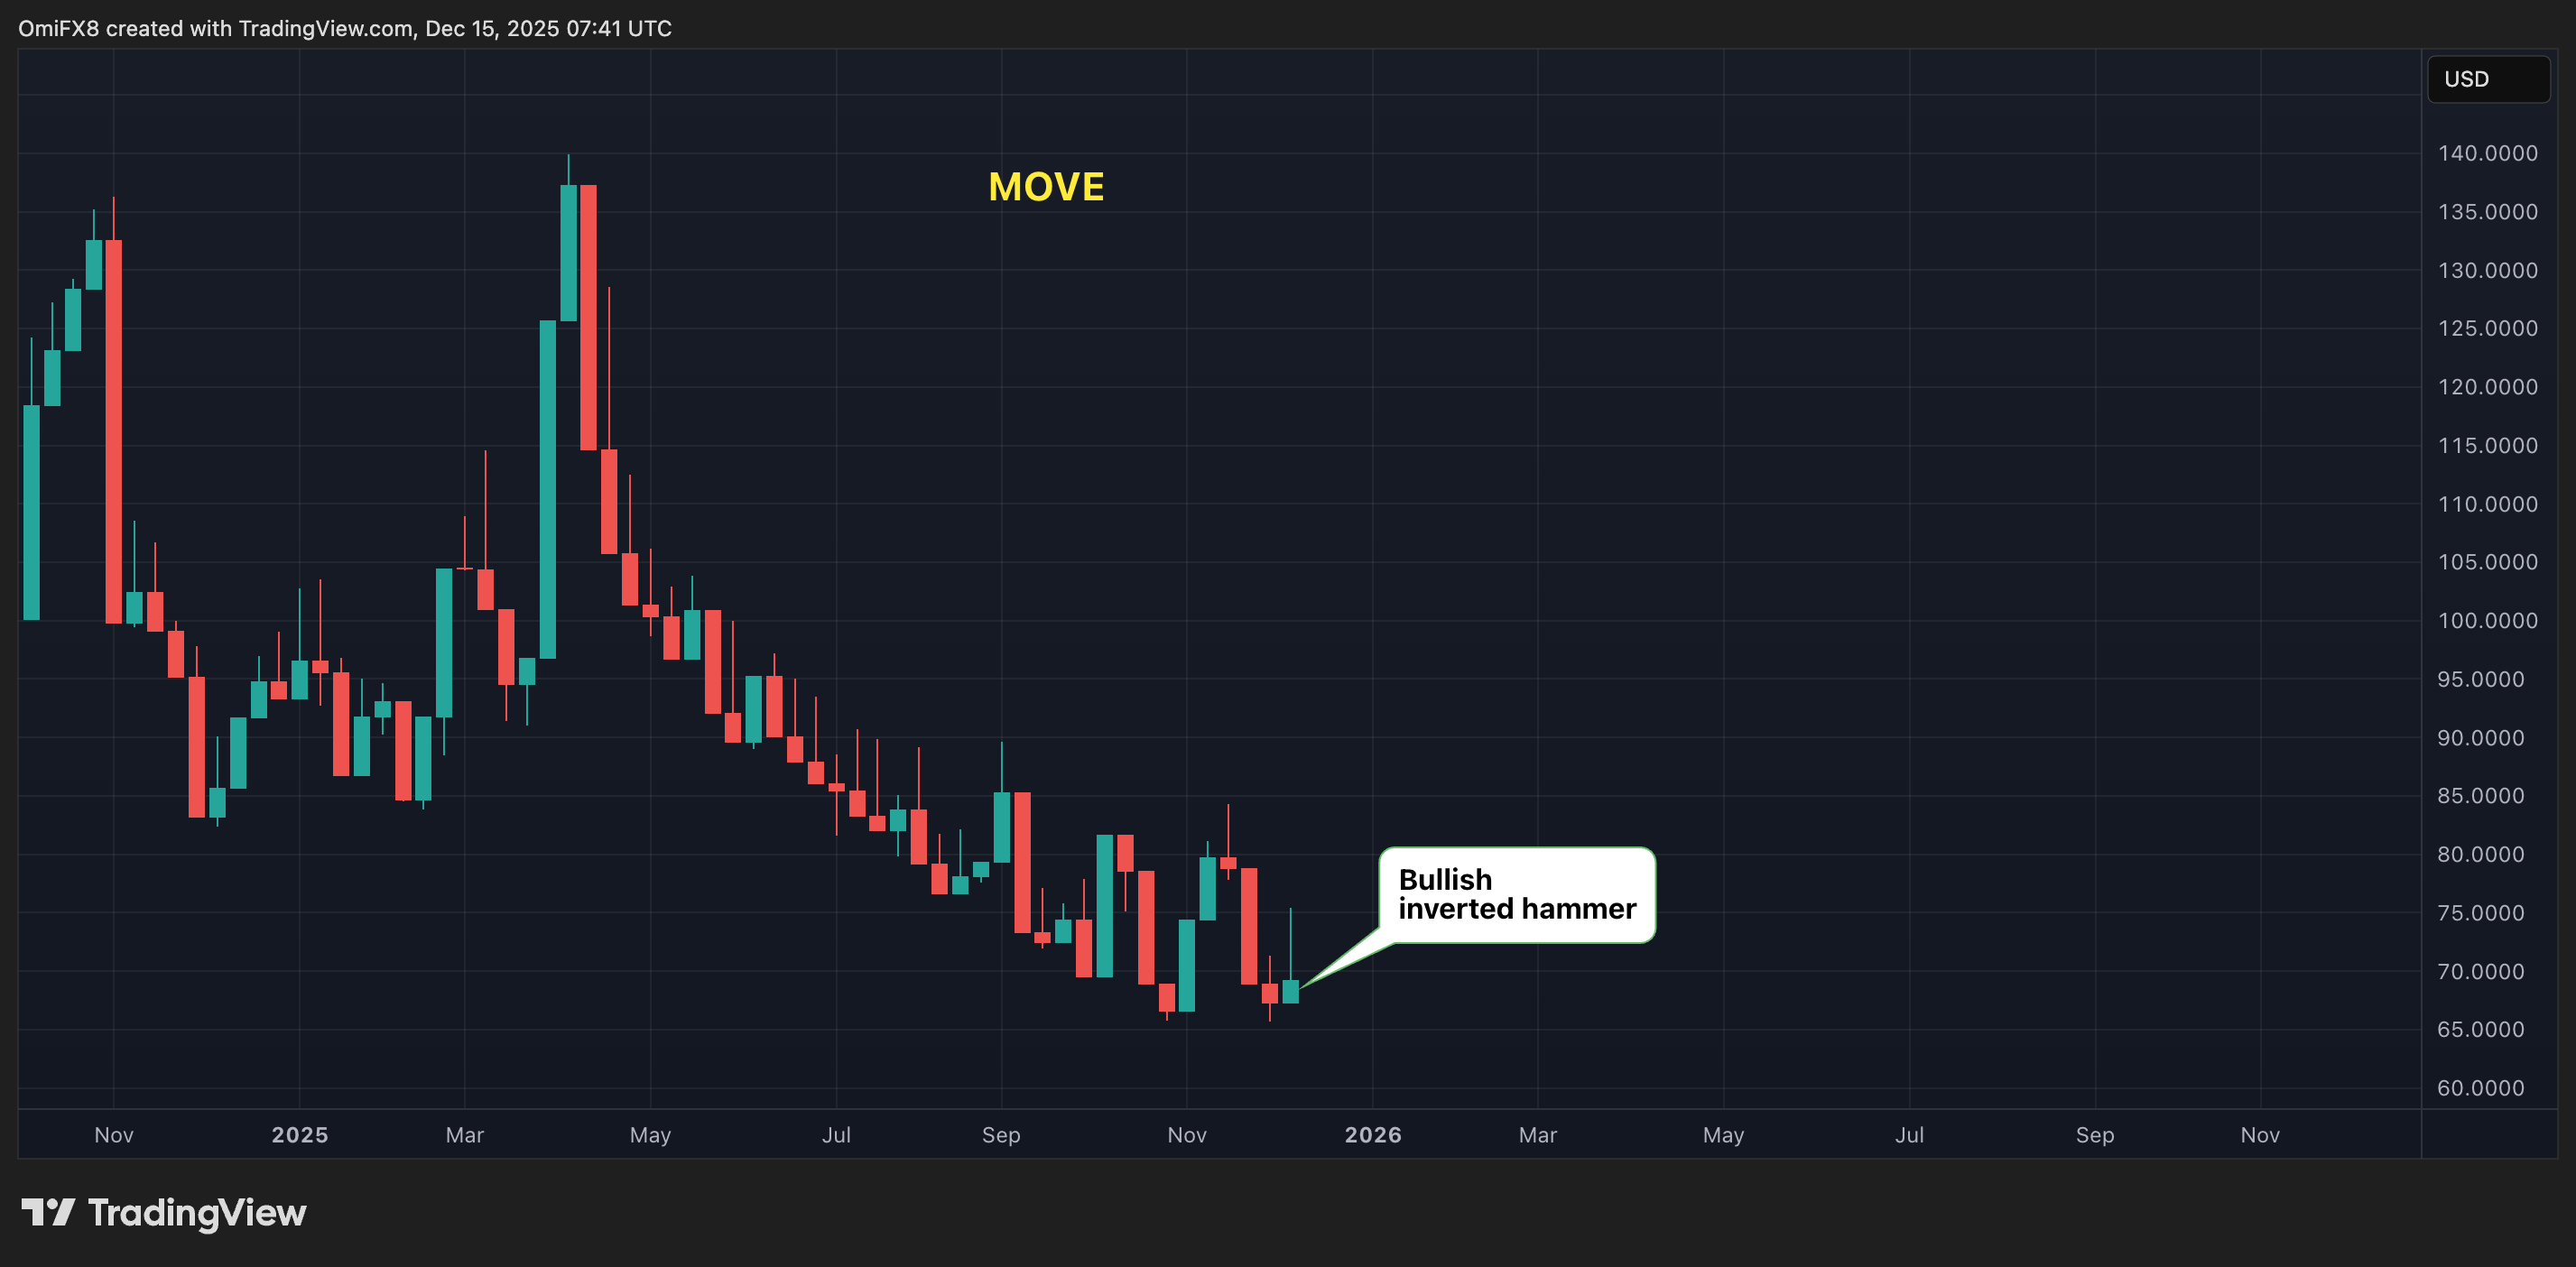
In other words, the $MOVE index may turn higher as a sign of increased volatility in Treasury notes, which tends to cause financial tightening worldwide and cap gains in risk assets. Historically, $BTC has tended to move in the opposite direction of the $MOVE index.
Key levels
All things considered, $BTC appears more likely to break down from the counter-trend channel than higher, opening the door for a re-test of recent $80,000 lows.
On the upside, clearing $94,000-$95,000 is needed to reclaim short-term bullishness, though heavy resistance awaits from $96,000 to $100,000, including the 50-day SMA and Ichimoku cloud.