
Bitcoin has taken a breather just shy of the $95,000 mark after a whiplash rally that screamed from the ashes of $80,537 earlier this month. The digital darling has been stuck in a tightrope act between $90K and $94K, keeping market participants nibbling their fingernails and squinting at charts. With volume softening and indicators sending mixed signals, the short-term path seems anything but dull.
Bitcoin Chart Outlook
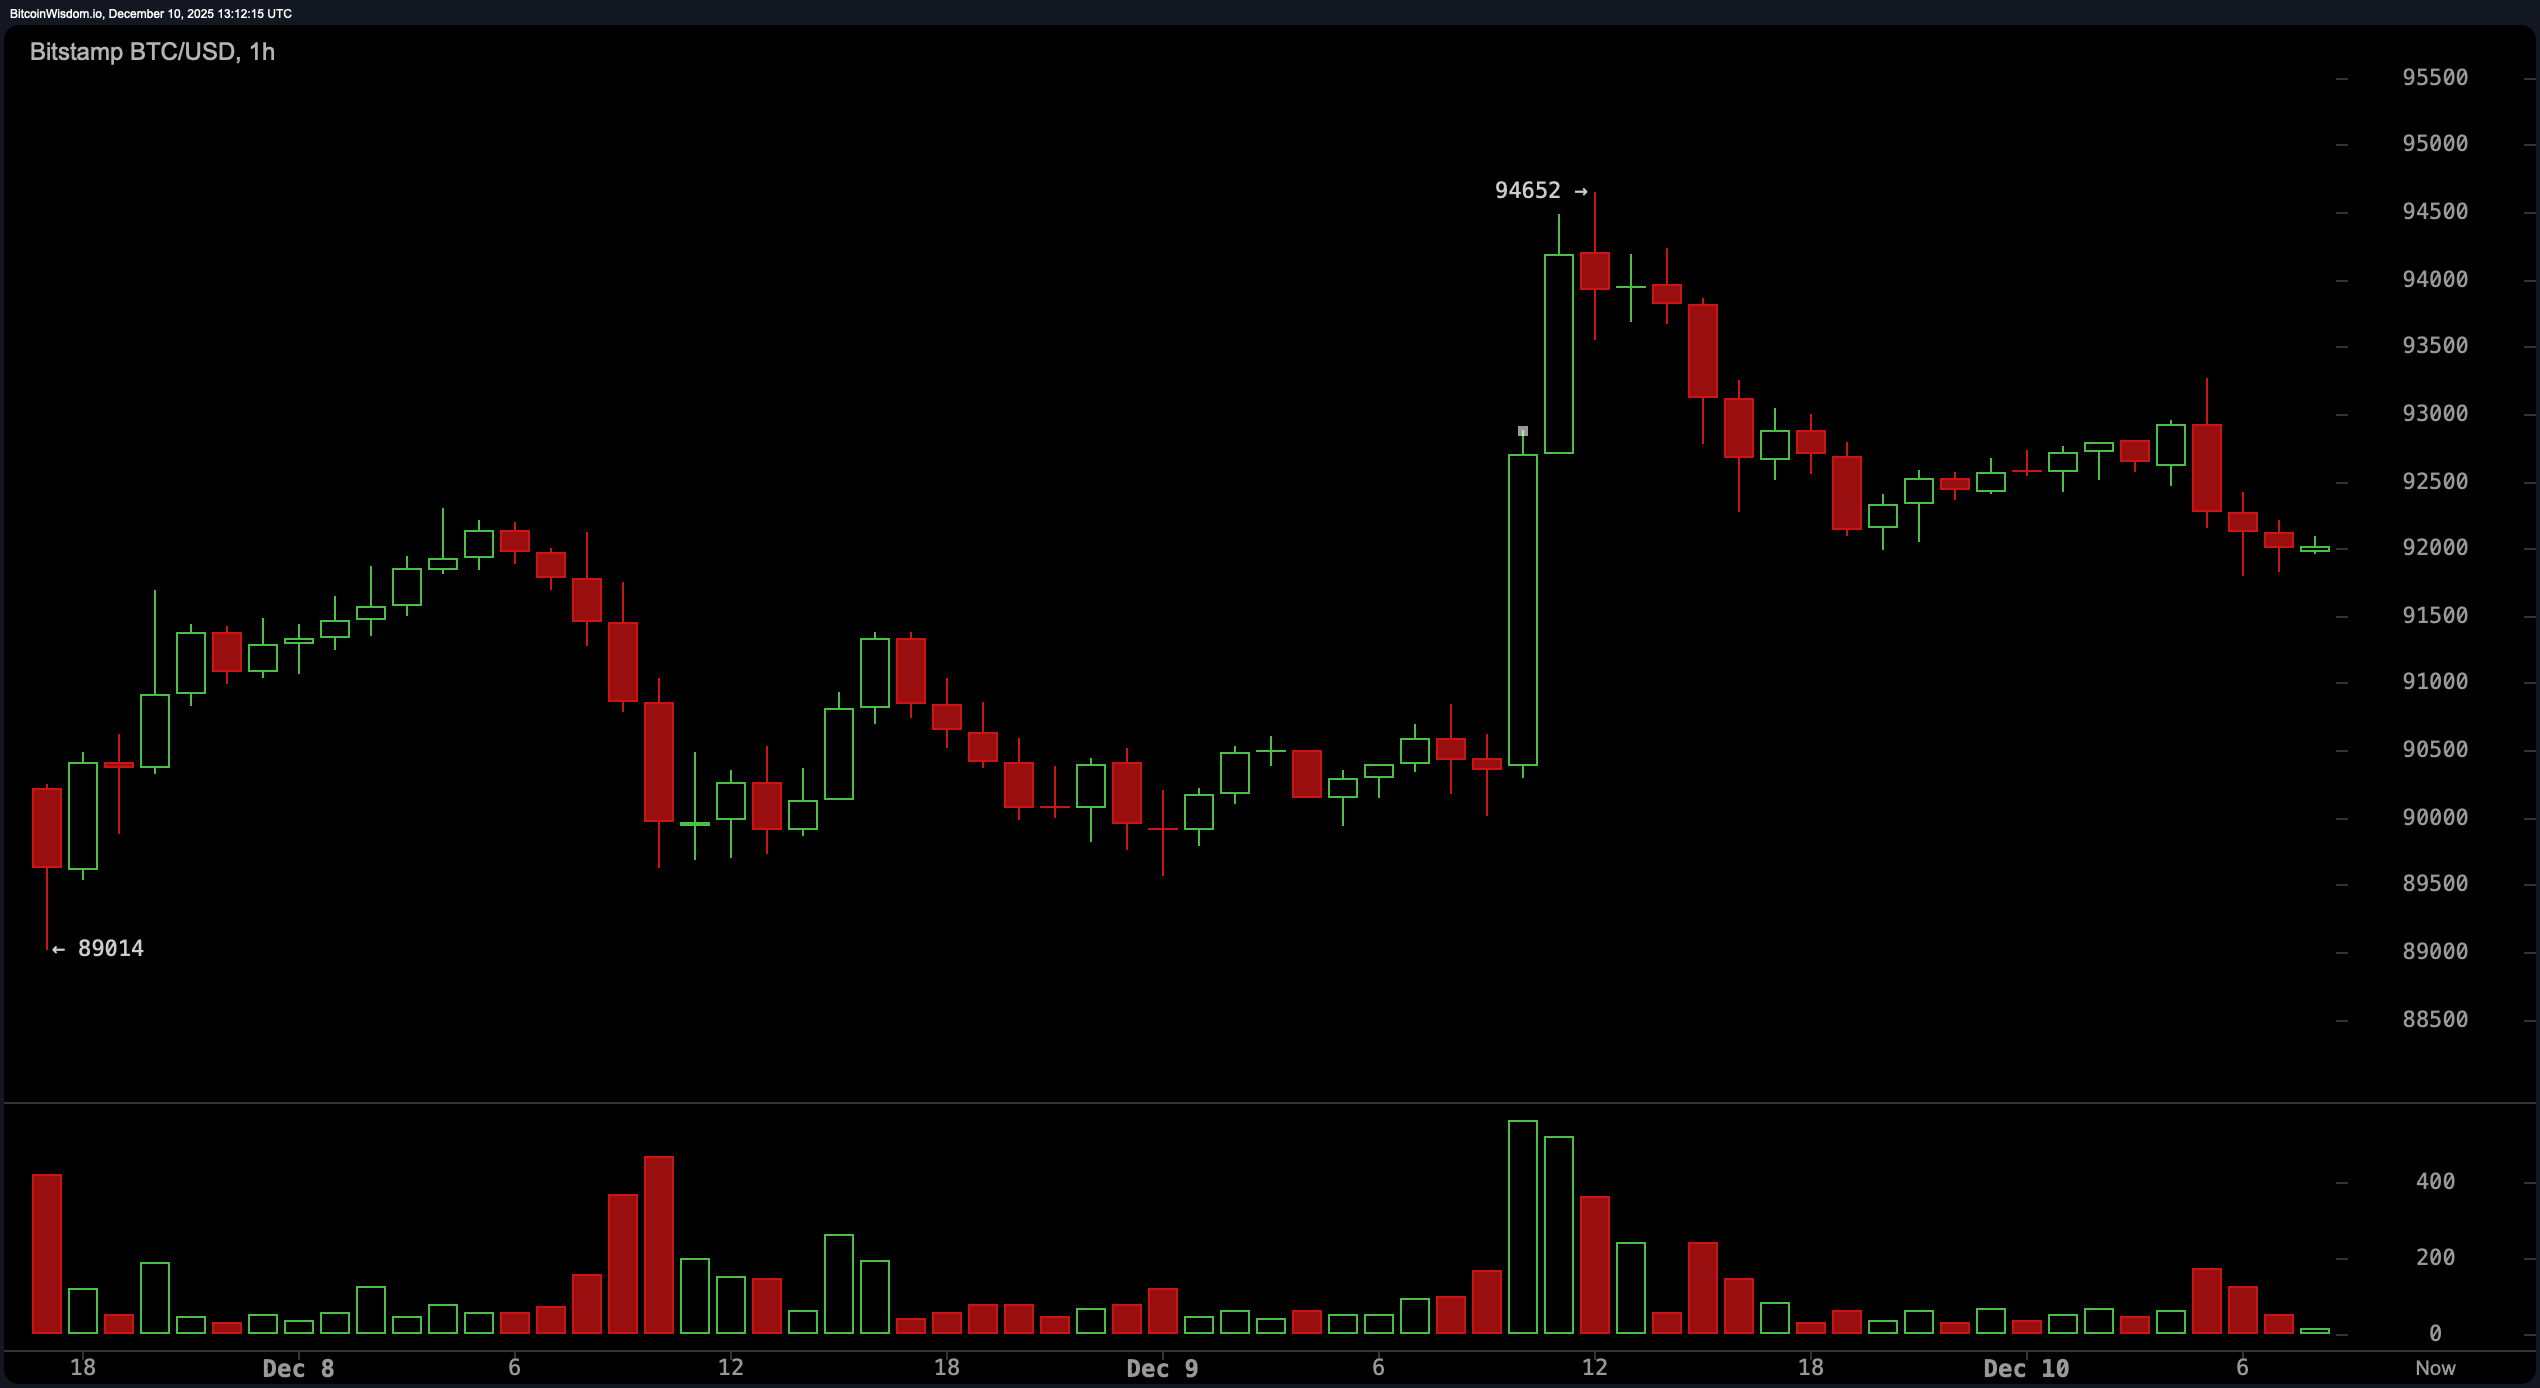
On Wednesday, the 1-hour chart paints a tale of exuberance and fatigue. After a rocket-fueled rally that peaked at $94,652, bitcoin’s price has cooled off, consolidating between $92,000 and $93,000. Volume has taken a post-party nap—once euphoric, now subdued—hinting that the crowd might be catching its breath.
Technicians will note a potential bullish flag or ascending triangle brewing. If the price slices above $93,500 with renewed volume, it could ignite another leg up. Should the price dip below $91,000, however, this bullish thesis might be headed for a short vacation.
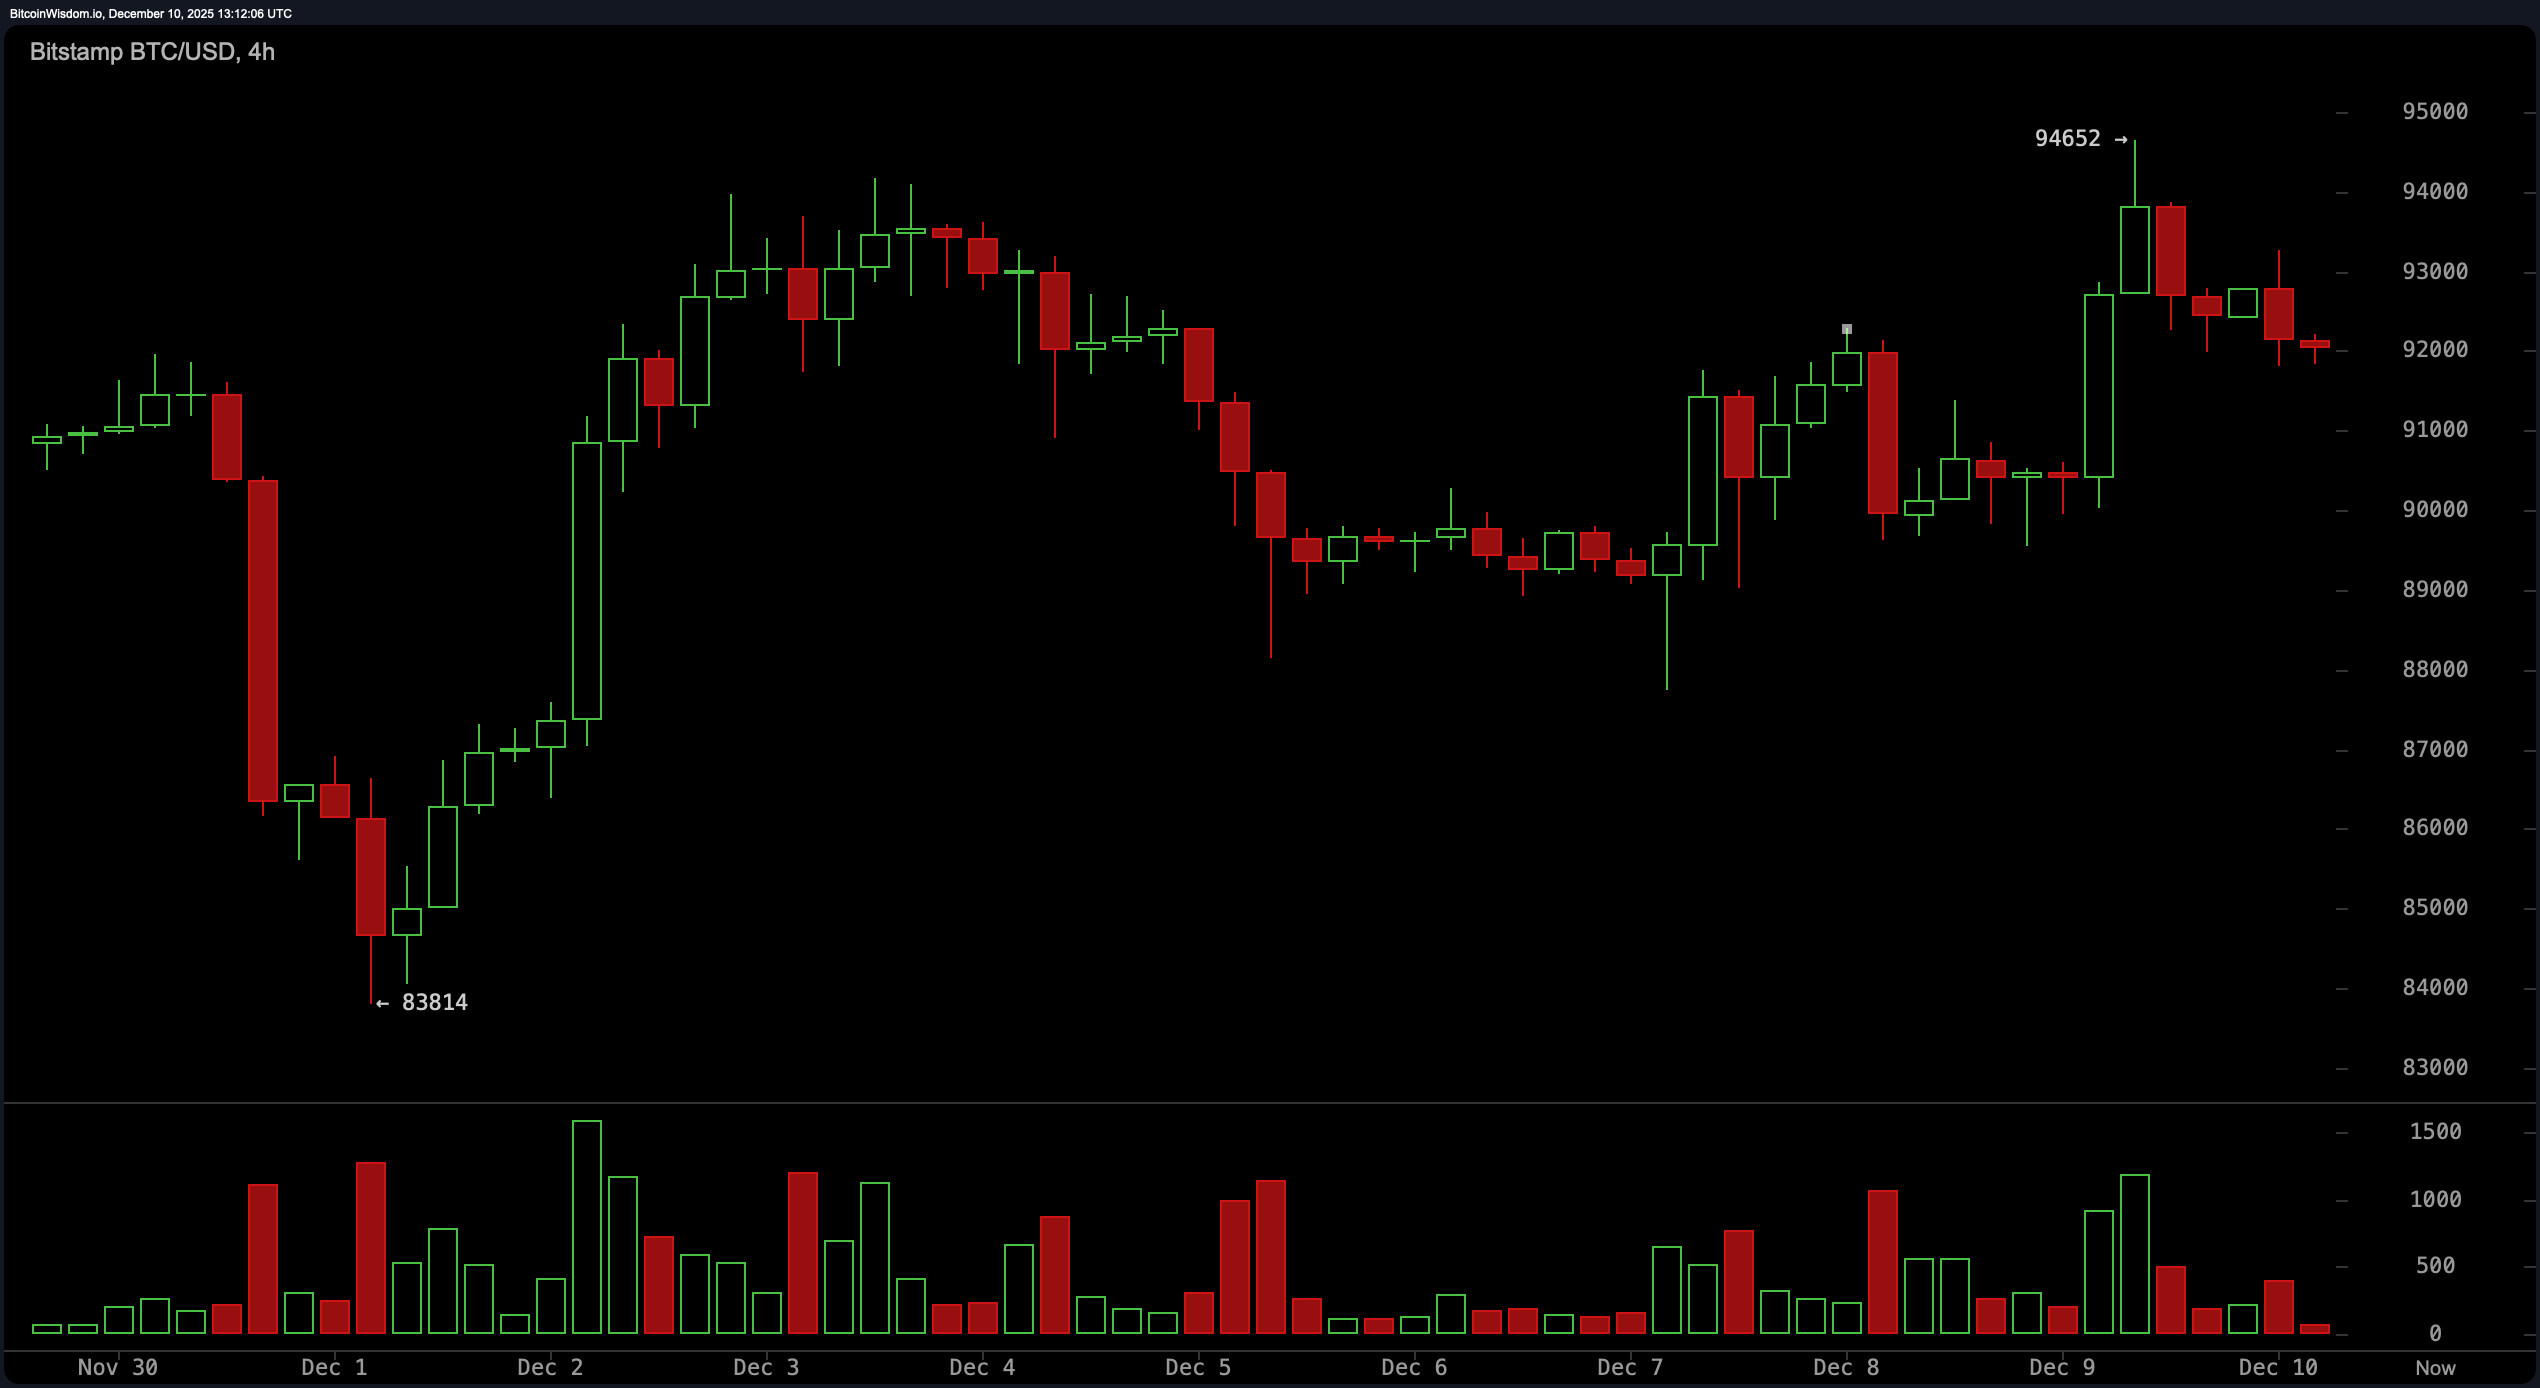
Stepping up to the 4-hour chart, bitcoin’s recent bounce from $83,814 to its local high seems to have birthed a double bottom-esque structure. Yet now it hovers in a range-bound limbo between $91,000 and $94,000, digesting gains like a marathon runner gulping electrolytes mid-race. Volume spikes during the initial surge suggest serious interest, but the declining flow since implies that momentum is cautiously being reassessed. If $94,500 is taken out convincingly, that could reaffirm bullish intentions. Below $90,500, however, it’s back to the drawing board for momentum chasers.
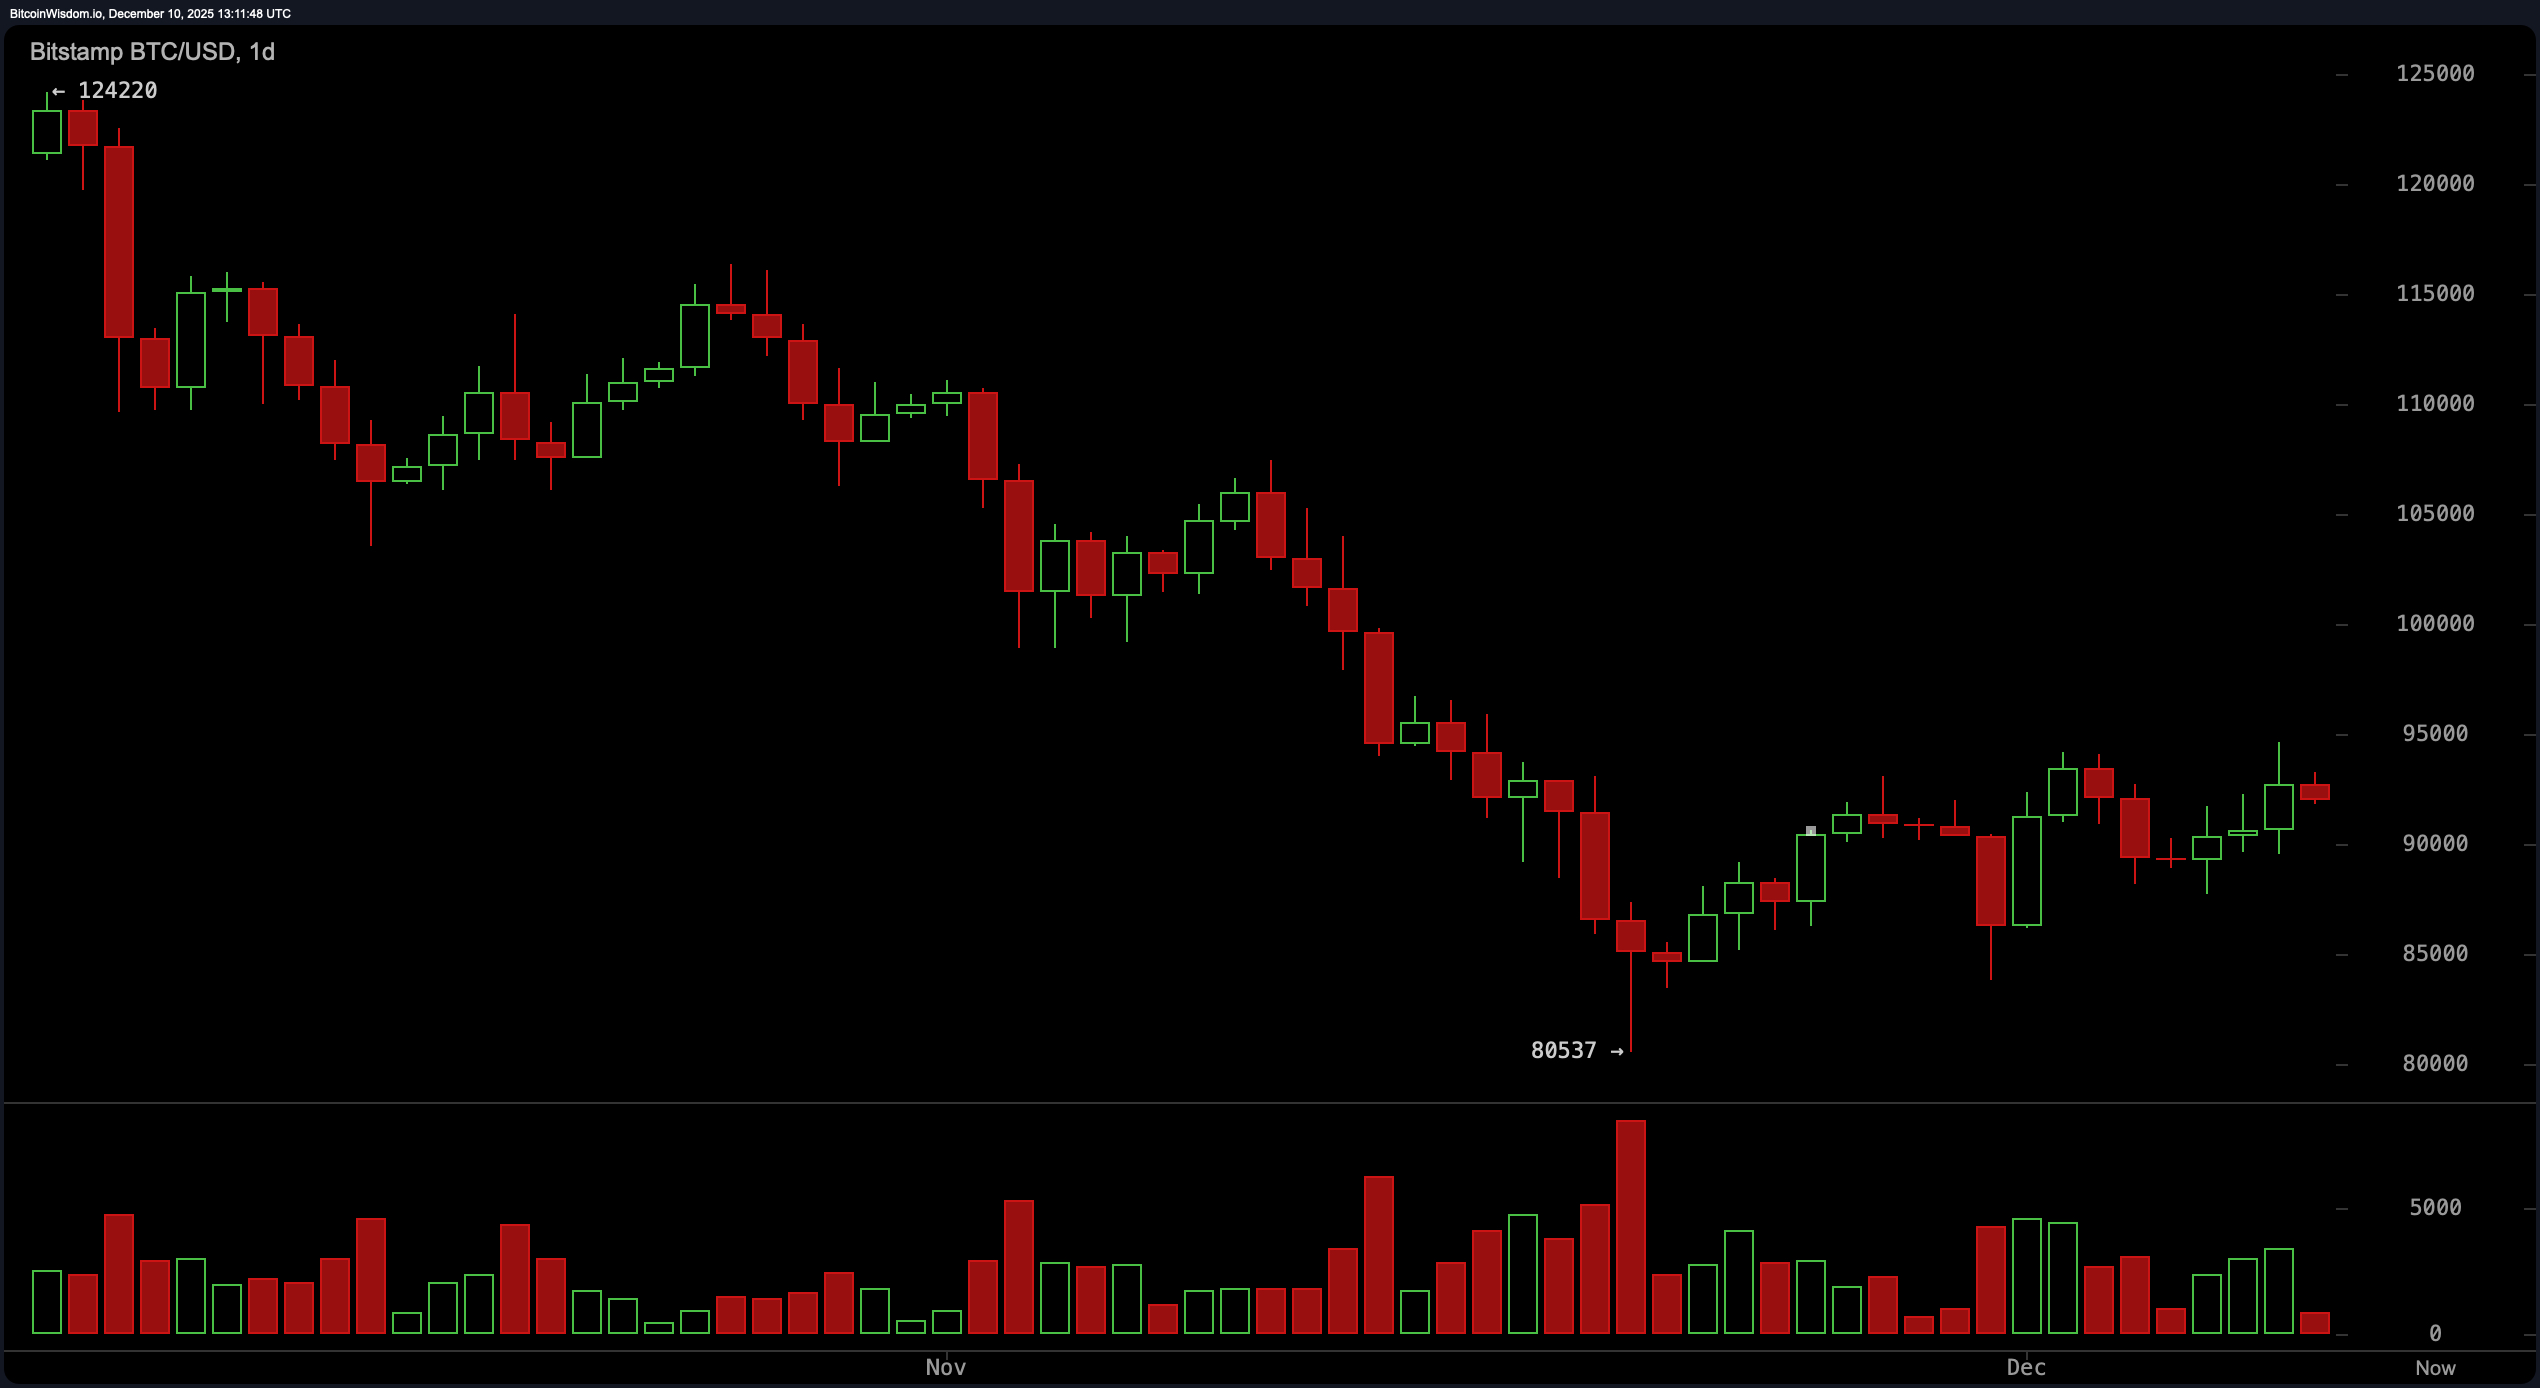
Zooming out to the daily chart, bitcoin appears to be in post-downtrend rehab after sliding from the lofty highs of $124,000 to a low near $80,537. Price action now shows a textbook case of hesitation: small-bodied candlesticks with indecisive wicks and a bearish-to-neutral tone. Volume surged during the recent rally, but it’s trickling down now, flagging a potential stall or mild pullback. Eyes are on the $95,000 resistance level—breach that with strength, and we may see renewed conviction. A slip below $90,000, however, could invite another trip south toward $85,000 or worse.
Now, let’s talk oscillators. The relative strength index (RSI) sits at 48, shrugging in neutrality. The Stochastic oscillator reads 75, also offering little drama. The commodity channel index (CCI) is at 92, straddling the line with a neutral stance. The average directional index (ADX) at 29 confirms the market’s identity crisis—neither hot nor cold. The Awesome oscillator has dipped into the red at -2,052, while momentum at 1,658 is blinking caution. Meanwhile, the moving average convergence divergence (MACD) level sits at -1,529, tossing a subtle nod to upward potential.
The moving averages are split like a Thanksgiving dinner debate over politics. Shorter-term averages such as the exponential moving average (EMA) 10 at $91,035 and simple moving average (SMA) 10 at $90,755 both support current price action. Even EMA 20 and SMA 20 keep the optimism alive. But start stretching into the 30s and beyond, and things get frosty—EMA 50, SMA 50, and especially the 100 and 200-day averages all point downwards. The 200-day SMA lags far behind at $108,939, a stark reminder that bitcoin’s not yet out of the woods from its previous slump.
All told, bitcoin’s short-term posture is balancing on a tight wire. Oscillators and shorter moving averages whisper potential, but long-term trendlines are less convinced. With the $95,000 mark acting as the velvet rope of this current rally, only volume-backed moves will separate pretenders from trendsetters. Traders should keep a hawk’s eye on price action, volume surges, and any unexpected macro curveballs. Because in crypto, the only thing more volatile than price is opinion.
Bull Verdict:
Should bitcoin break above the $95,000 threshold with conviction and volume to match, the technical stars could align for a continuation higher. Short-term chart structures lean bullish, and supportive short-term moving averages suggest the groundwork is already laid. A breakout here might not just be noise—it could signal the next act in bitcoin’s rebound performance.
Bear Verdict:
If the price slips below $90,000 and volume continues to wane, the market may be flashing early warning signs of exhaustion. With mid- to long-term moving averages still sharply above current levels and momentum indicators showing cracks, a deeper pullback remains on the table. For now, the bears have not left the building—they’re simply waiting for a misstep.
FAQ ❓
- Where is bitcoin trading now? bitcoin is currently priced at $92,026, fluctuating within a tight intraday range.
- Is bitcoin breaking out or consolidating?Technical charts suggest bitcoin is consolidating just below the $95,000 resistance level.
- What indicators are traders watching?Key indicators include the relative strength index (RSI), moving average convergence divergence (MACD), and volume trends.
- What’s the global sentiment around bitcoin?Market sentiment is cautiously bullish, with strong short-term momentum but lingering long-term resistance.