
Bitcoin currently sits at $89,618, with a market capitalization of $1.78 trillion and a 24-hour trading volume of $45.76 billion. Over the past day, its price has oscillated within a narrow band from $88,420 to $91,290—suggesting hesitation among both bulls and bears. This isn’t a stampede; it’s more of a tense chess match at the $90K psychological frontier.
Bitcoin Chart Outlook
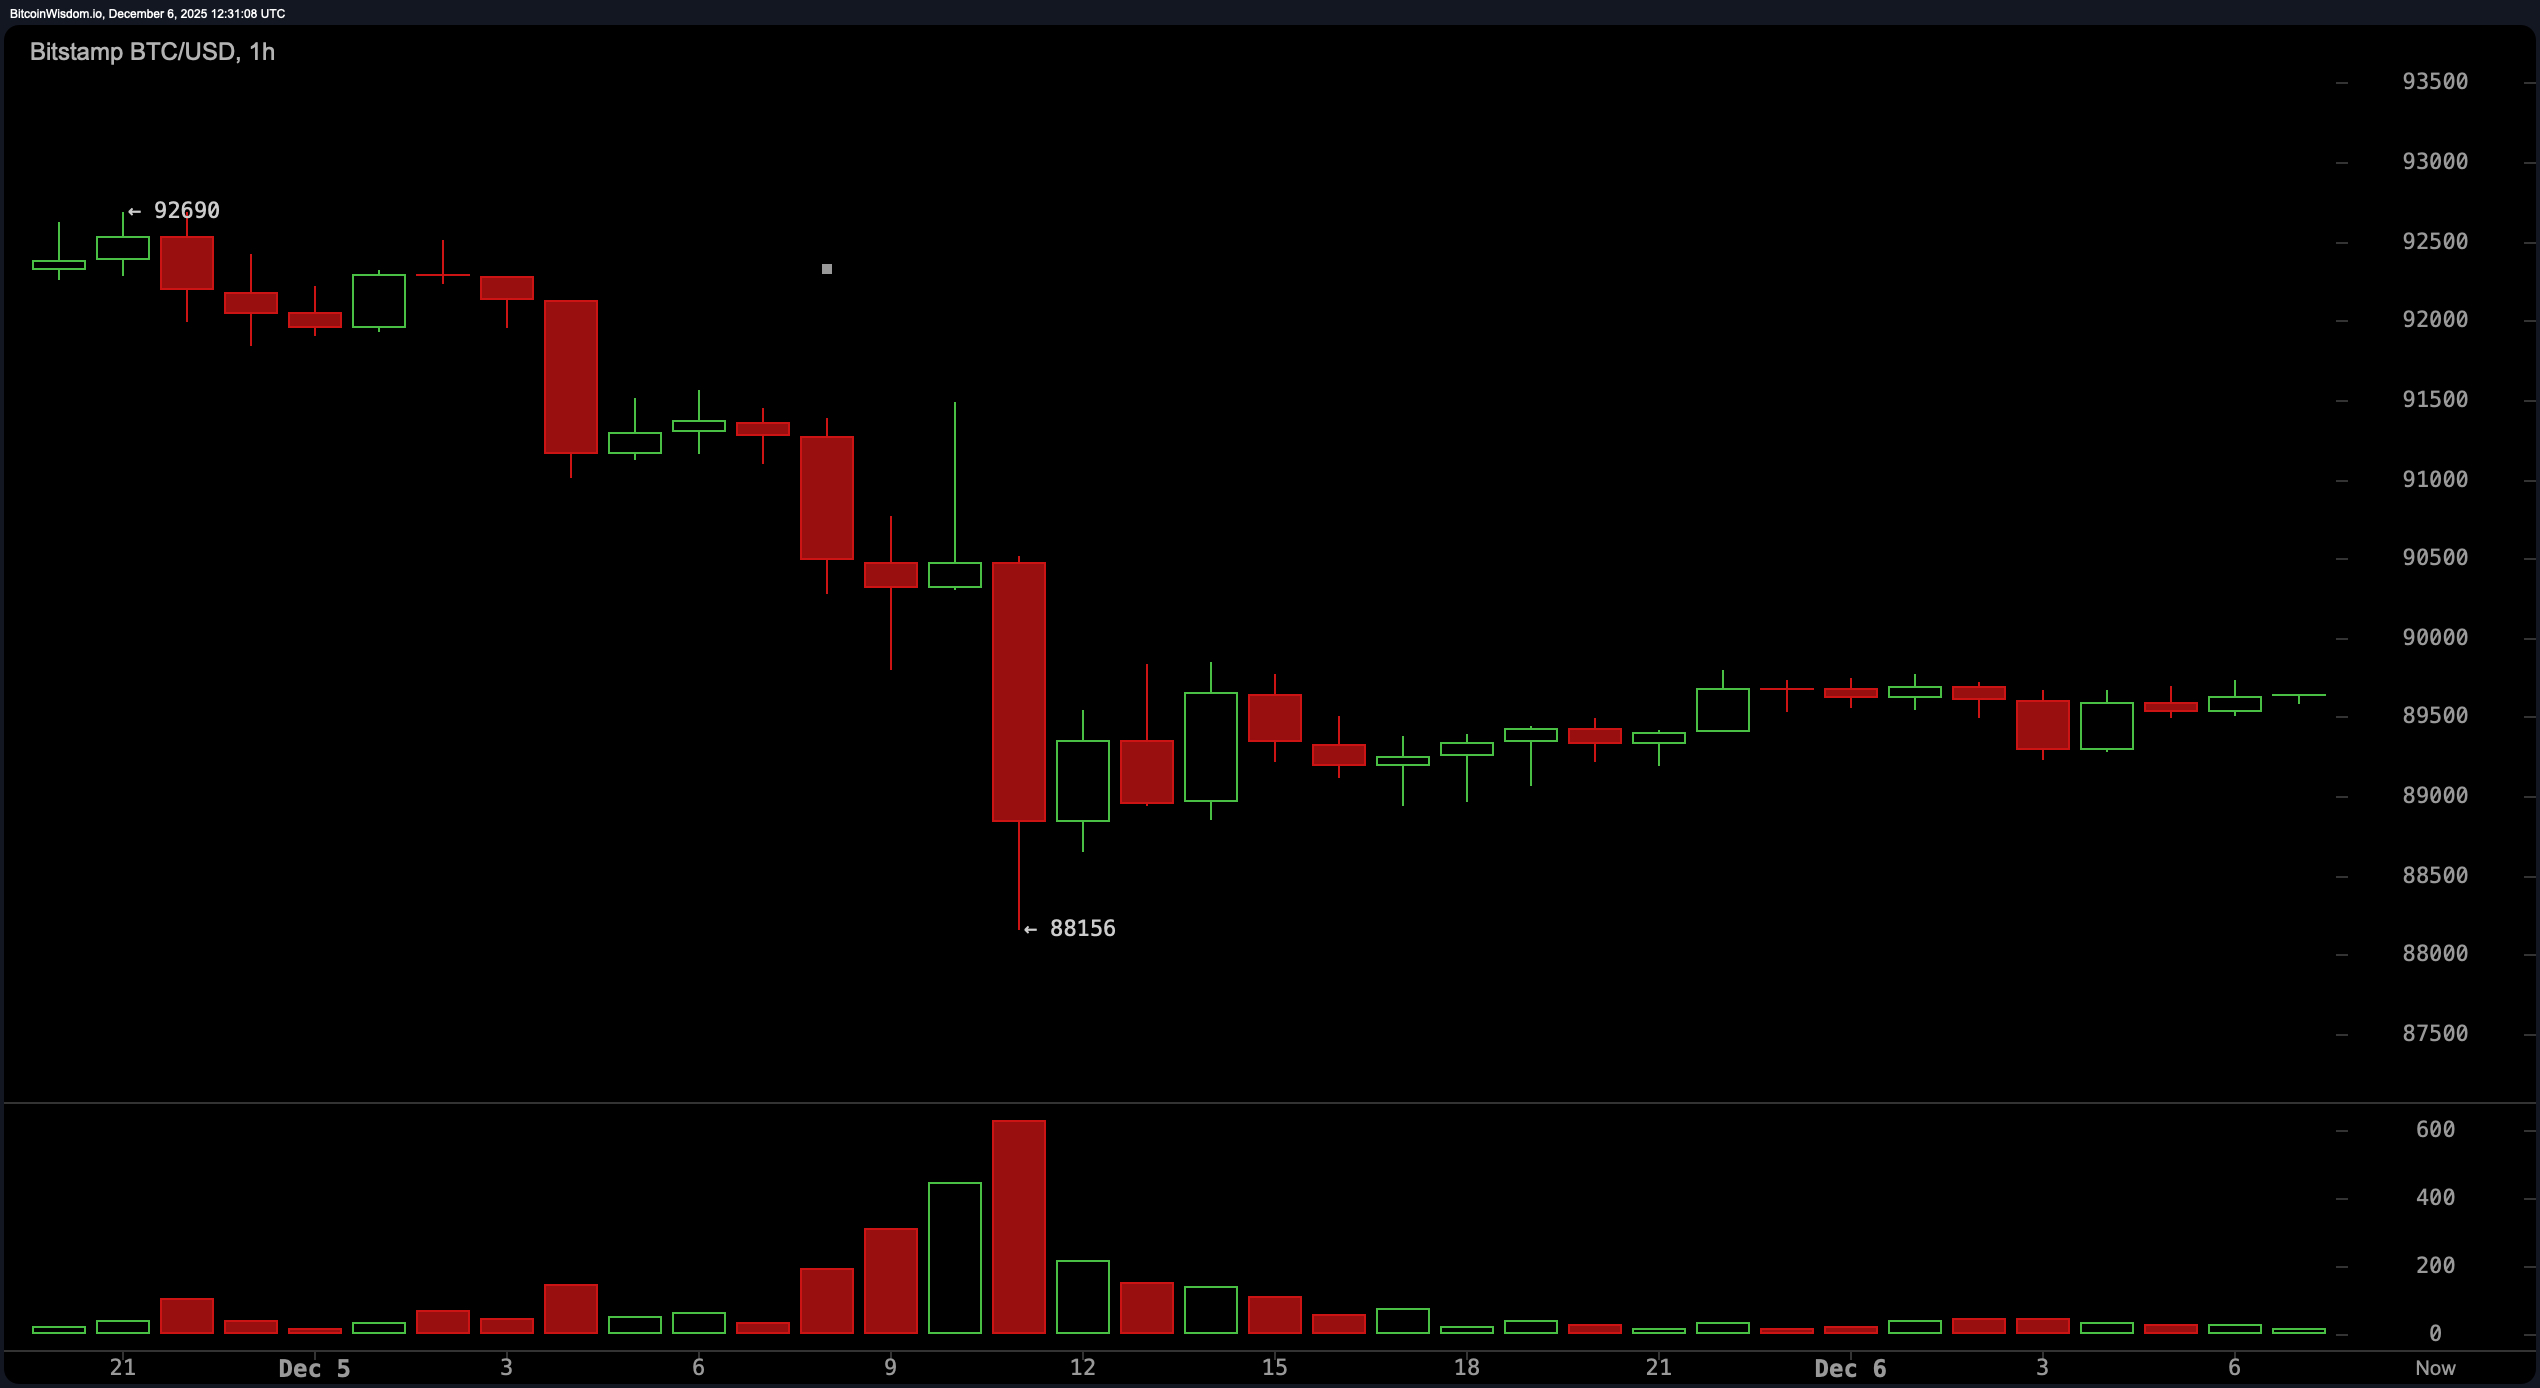
The hourly chart gives us a polite shrug. Bitcoin recently attempted to reclaim momentum after being rejected at $92,600, only to stumble back to $88,100. Since then, the price has meandered sideways between $89,200 and $89,900, with all the enthusiasm of a sleepy Sunday afternoon.
Volume is notably light, signaling indecision or possibly apathy. If price manages to break above $90,000 with volume, then a move toward $91,000 to $91,500 becomes more plausible. But if it slips below $88,000 with conviction, it could mean we’re in for another slide.
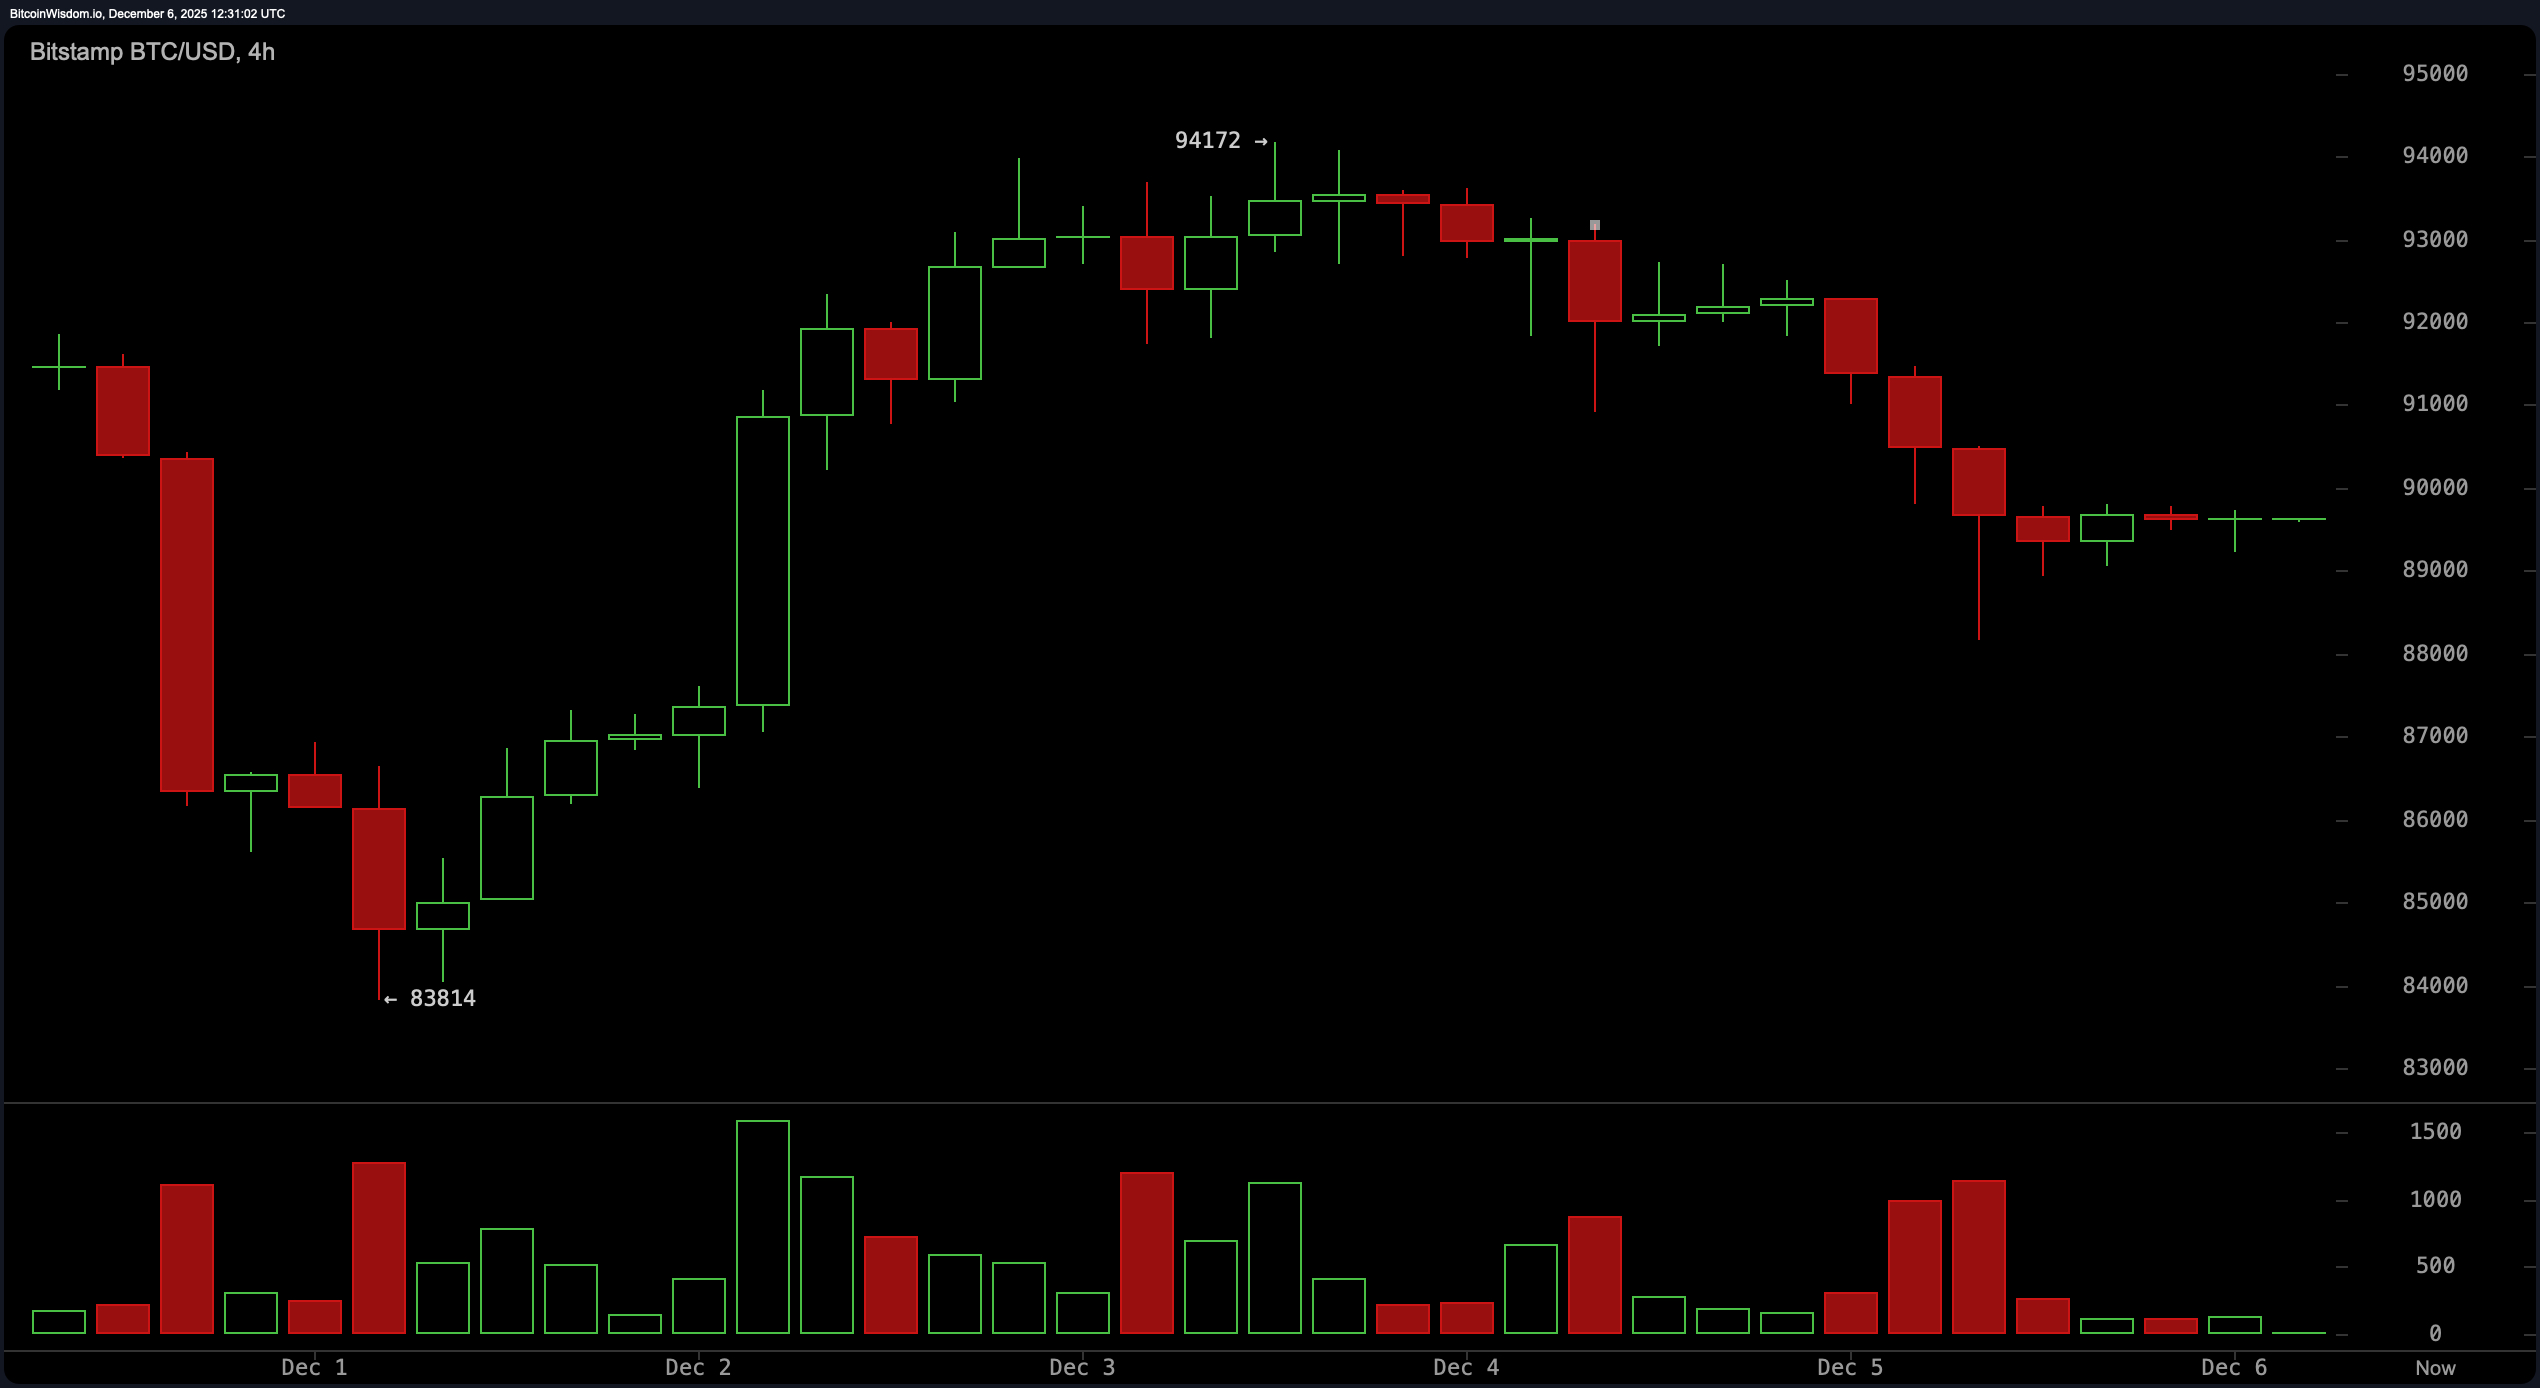
On the 4-hour chart, a rounded top has formed—never a good hairstyle, and rarely a good sign in price action. After rebounding from $83,800 to $94,000, bitcoin began a soft decline back to the $88,000 to $90,000 zone. While that sounds calm, the structure whispers “fatigue.” A break above $91,500 with accompanying volume would mark a shift toward optimism. But another rejection near $93,000 or a failure to hold above $88,500 could open the gates to revisit $85,000—or worse, $80,537, where capitulation was previously observed.
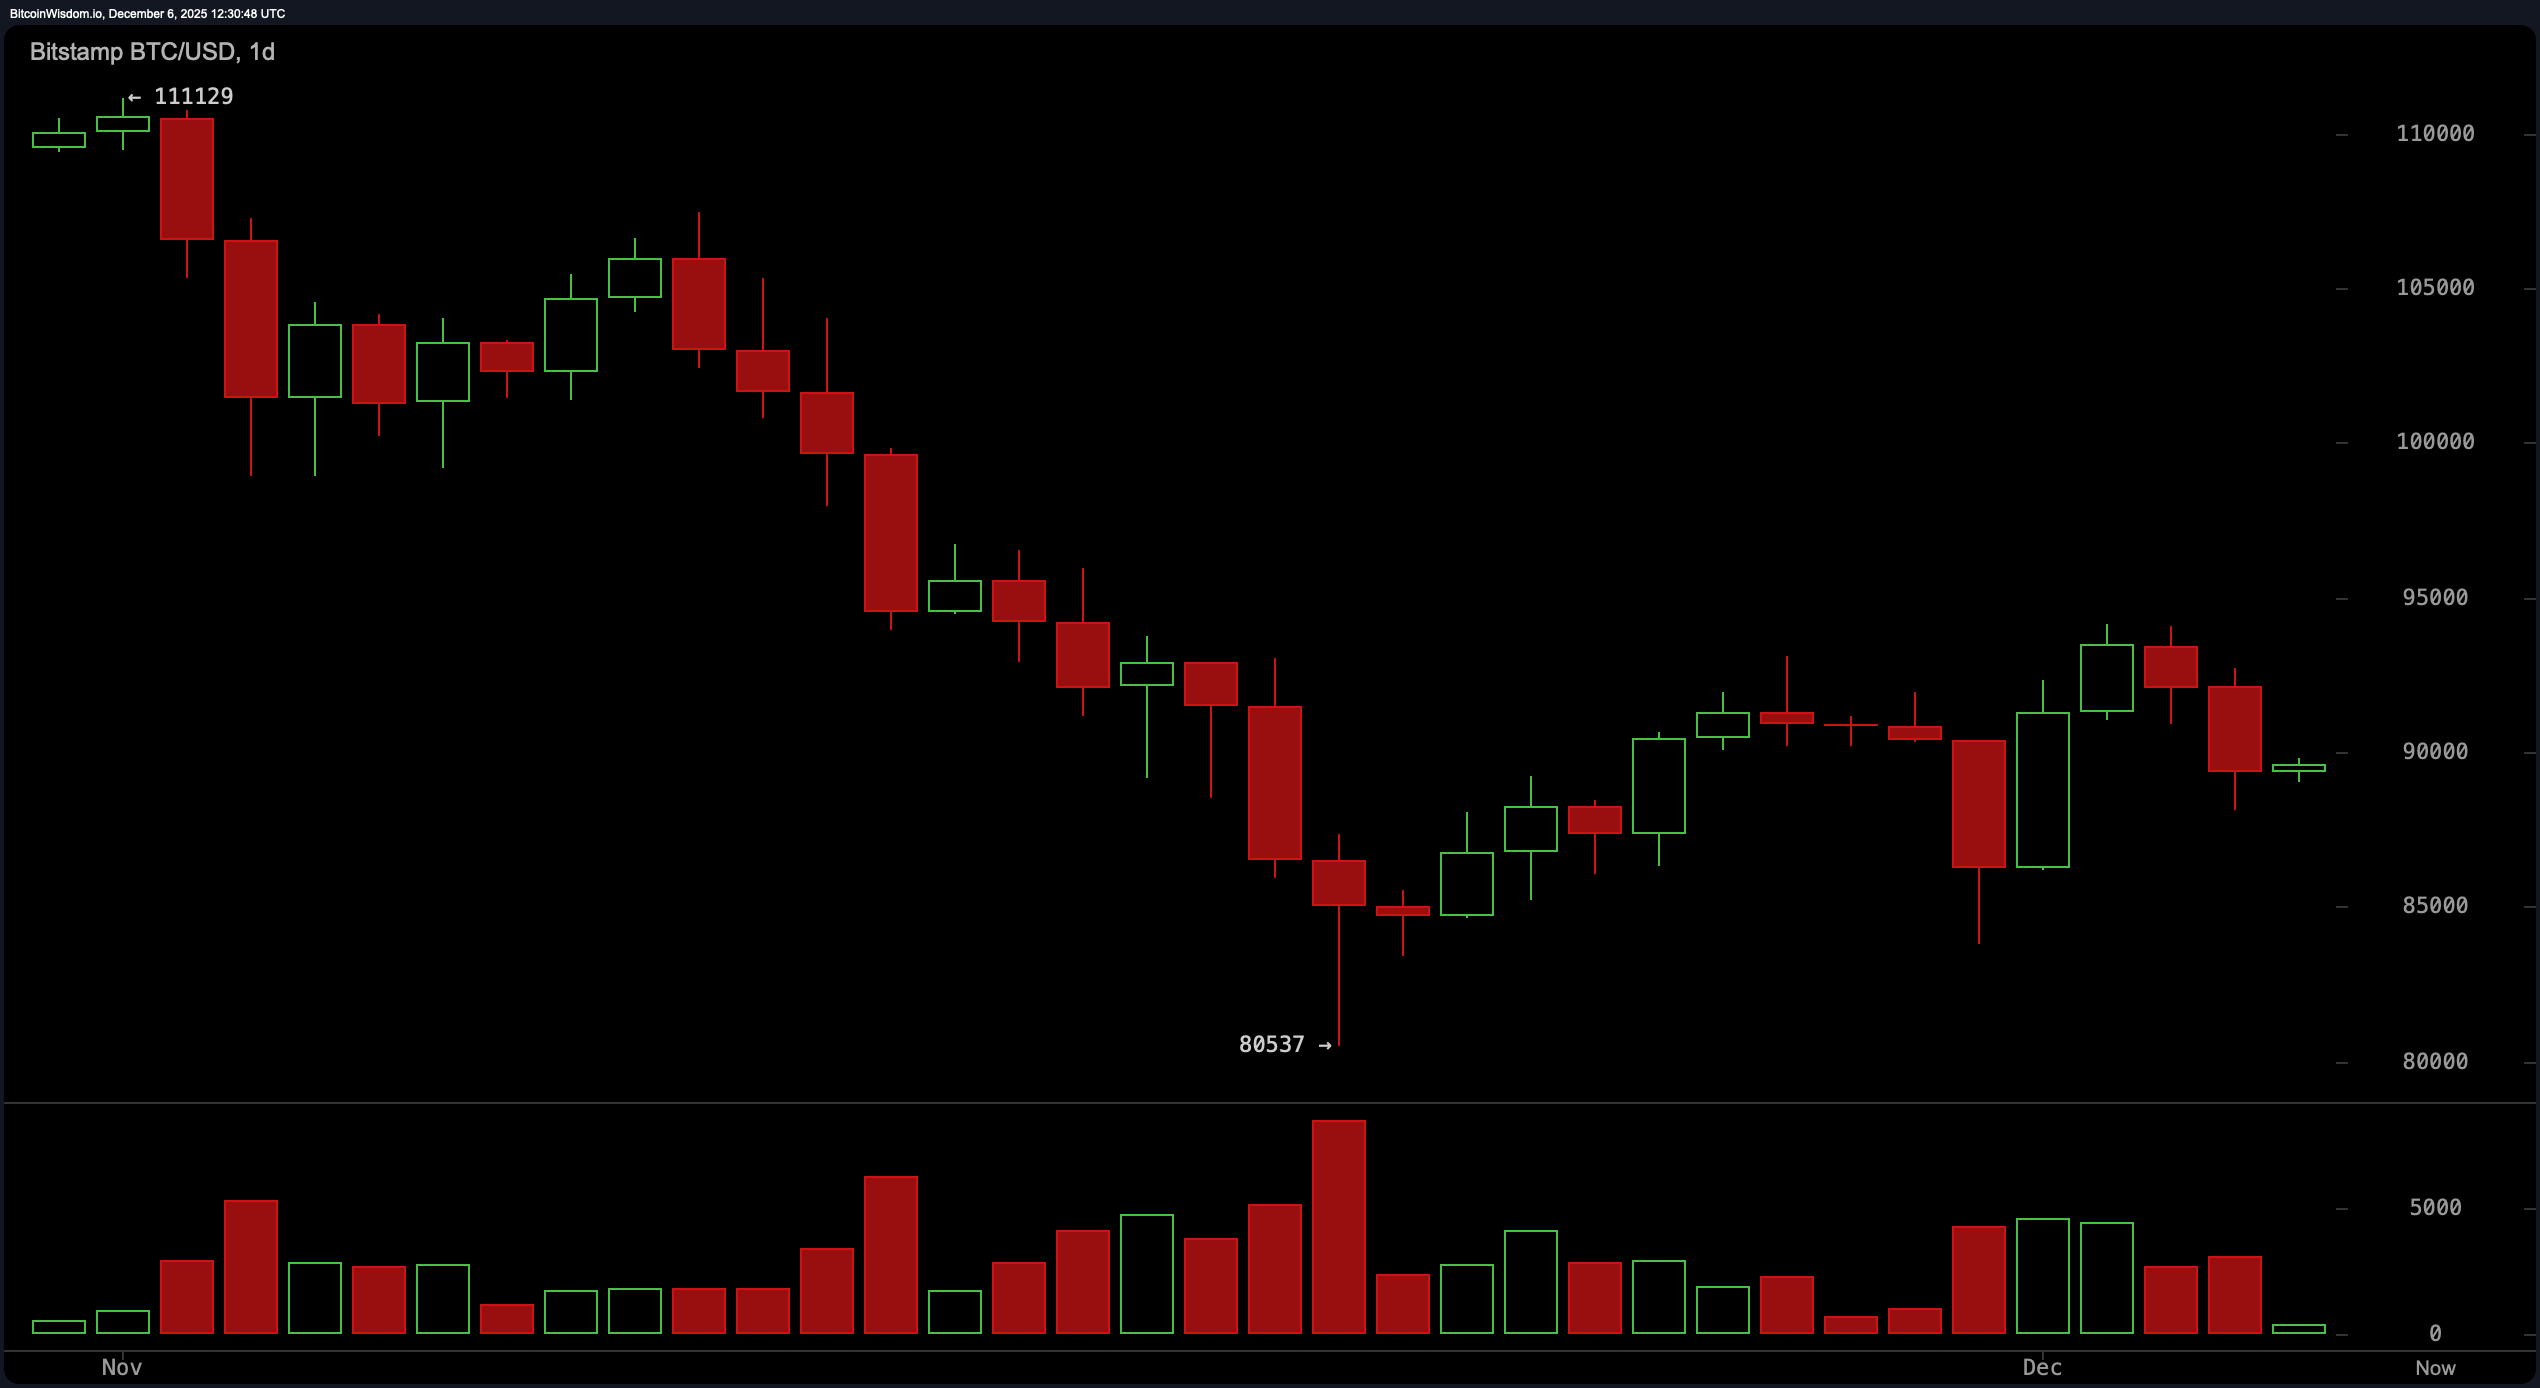
The daily chart doesn’t sugarcoat it: Bitcoin is still healing from a sharp downtrend that dropped it from around $111,000 to a low of $80,537. A modest relief rally ensued, but the latest price action around $90,000 reflects a consolidation phase, not a triumphant return. Rejection at $95,000, where the last upward push fizzled, has kept traders cautious. Until bitcoin closes above that level with strong volume, the trend remains technically unbroken. This is a market waiting for proof—not promises.
Oscillators are offering the emotional support of a lukewarm cup of coffee. The relative strength index (RSI) clocks in at 43, indicating neutral momentum. The Stochastic oscillator reads 65, also neutral. The commodity channel index (CCI) sits at a limp 0. Meanwhile, the average directional index (ADX) shows a value of 35—strong enough to suggest a trend exists, but without revealing who’s driving. The Awesome oscillator at -3,658 and the momentum indicator at -848 hint at fading strength. The moving average convergence divergence (MACD) is the lone optimist, registering a -2,422 level with a bullish signal.
Moving averages, on the other hand, have taken a decidedly skeptical stance. Every single exponential moving average (EMA) and simple moving average (SMA) from 10-period to 200-period—with the lone exception of the 20-day SMA—registers a bearish alignment. Notably, the 200-period SMA stands far above at $109,295, pointing to how far bitcoin has drifted below its long-term trajectory. The 10-day EMA and SMA hover just above $90,000, suggesting short-term resistance isn’t letting go without a fight.
So where does that leave us? Statistically, the probability of a bullish reversal from this structure, at least today, is about 35%—an underdog, but not without hope. Bears still hold the higher ground, with a 65% chance of forcing a retest of the recent lows if bitcoin fails to hold above key support at $88,000. Should the asset break $95,000 with strength, odds flip quickly in favor of a trend change. Until then, every candle tells the same story: hesitation, not conviction.
Bull Verdict:
If bitcoin holds the $88,000–$90,000 support band and breaks decisively above $91,500—followed by a volume-backed push past $95,000—it could signal the early stages of a trend reversal. Confirmation above $100,000 would cement a new bullish phase. Until then, the bulls are tiptoeing, not charging.
Bear Verdict:
Failure to defend the $88,000 level—especially on strong volume—opens the door to retests of $85,000 and potentially the previous low at $80,537. A break below that would solidify the continuation of the broader downtrend, with downside targets potentially extending toward $78,000 or even $74,000. The burden of proof remains squarely on the bulls.
FAQ 🐻🐂
- What is bitcoin’s current price?As of December 6, 2025, bitcoin is priced at $89,618.
- Is bitcoin in a bullish or bearish trend? Bitcoin remains in a downtrend, with slight bullish signals emerging.
- What are the key support and resistance levels for bitcoin now?Support sits around $88,000; resistance holds near $95,000.
- How likely is a bitcoin trend reversal soon?Current technicals suggest a 35% probability of a bullish reversal.