
Bitcoin nears historical support as veteran analyst Peter Brandt warns prices could slide toward lower channel levels.
Bitcoin (BTC) is trading at $86,032, marking a 0.7% decline over the past seven days. After briefly testing levels above $92,000 earlier in the week, the asset has since reversed, losing momentum toward the end of the observed 7-day period. Over the past 24 hours, Bitcoin has traded within a range of $85,694.01 to $91,904.65.
Despite the pullback, the crypto firstborn maintains a market capitalization of $1.72 trillion, supported by active trading volumes exceeding $62.7 billion in the last 24 hours. The decline comes amid broader market cooling, with the price structure showing increased volatility near the weekly peak followed by rapid sell-side pressure.
As BTC trades near the lower boundary of this week’s range, the next sessions will determine whether the current move evolves into deeper correction or stabilizes into a new support-building phase.
Where’s Bitcoin Headed?
On the technical end, veteran market analyst Peter Brandt has cautioned that Bitcoin is trading near the upper boundary of the lower green zone, a level that historically coincides with cycle bounces and moves towards the red resistance zone.
Based on his logarithmic trend model, BTC’s price is headed towards the level that has repeatedly acted as the support region for major market cycles in previous years.
Not to bust anyone's banana, but the upper boundary of the lower green zone starts at sub $70s with lower boundary support in the mid $40s.
How soon before Saylor's Shipmates ask about the life-boats? $BTC pic.twitter.com/YLfjSDdw9H— Peter Brandt (@PeterLBrandt) December 1, 2025
An example is when Bitcoin hit $20,076 in December 2017 and reversed, but support at the lower boundary stopped further moves at around $3,100. Another attempt emerged in November 2021, when BTC price hit $69,290, but failed to hold, taking it back to the $15,500 level by November 2022.
Brandt notes that the upper boundary of the lower green zone shows potential support beginning below the $70,000 level and extending toward the mid-$40,000 range.
Specifically, per the chart, first support is found at the $61,254 zone, extending down toward the $36,750 levels, while resistance exists near the upper boundary of the long-term channel in the roughly $222,246 to $333,369 area.
Interestingly, Brandt also referenced “Saylor’s shipmates,” which he may have directed at large institutional holders with heavy exposure like Saylor’s Strategy, suggesting that a move toward the support band could trigger concerns if leverage, cost basis, or investor pressure intensifies.
Meanwhile, a commenter responding to Brandt’s analysis argued that Bitcoin’s inability to reach the upper boundary of the long-term channel during its recent advance could signal broader weakness.
According to the remark, if the current rally is indeed losing strength, a break below the lower trend boundary remains a realistic outcome. Brandt added that while he personally may not favor this interpretation, the historical “priors” within the model support the possibility of such a downside move.
Bitcoin Liquidation Data
Notably, Bitcoin’s recent price volatility has produced a distinct liquidation pattern, with the majority of liquidations concentrated on the long side across the 4-hour, 12-hour, and 24-hour windows. This data indicates that the market has unwound aggressive long positioning as prices pulled back from weekly highs.
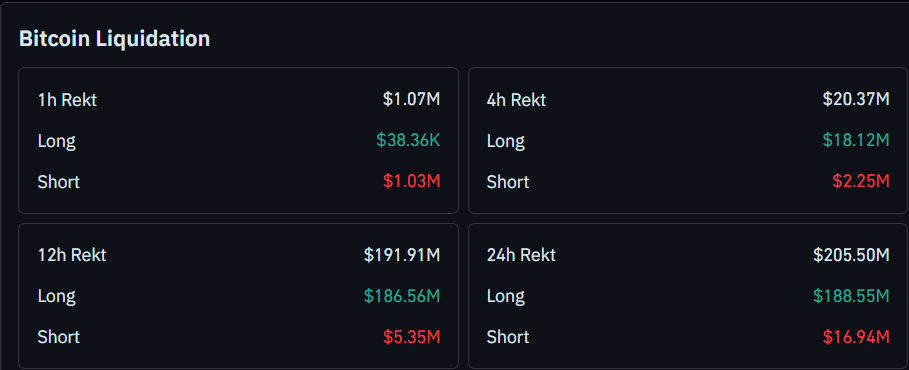
Over the 4-hour period, approximately $20.37 million in leveraged positions faced liquidations. Of this, $18.12 million came from long traders, compared to just $2.25 million in short liquidations, highlighting short-term overexposure to upside bets.
The trend becomes more pronounced in the 12-hour window, where liquidations totaled $191.91 million. Long positions accounted for the overwhelming majority at $186.56 million, while short liquidations remained minimal at $5.35 million. This suggests that traders holding leveraged longs through the broader intraday downturn were hit hardest as the price retraced.
The 24-hour data reflects similar pressure, showing $205.50 million in total liquidations, with $188.55 million wiped from long positions versus $16.94 million from shorts. The imbalance across all timeframes signals that the market’s pullback primarily punished overleveraged bullish positioning.