
Bitcoin may be clinging to the $86K level like it’s got something to prove, but make no mistake — this market’s got more layers than a blockchain protocol. Despite a flicker of life in the 4-hour chart, the broader technicals are flashing warning signs like a miner’s rig overheating in July.
Bitcoin Chart Outlook
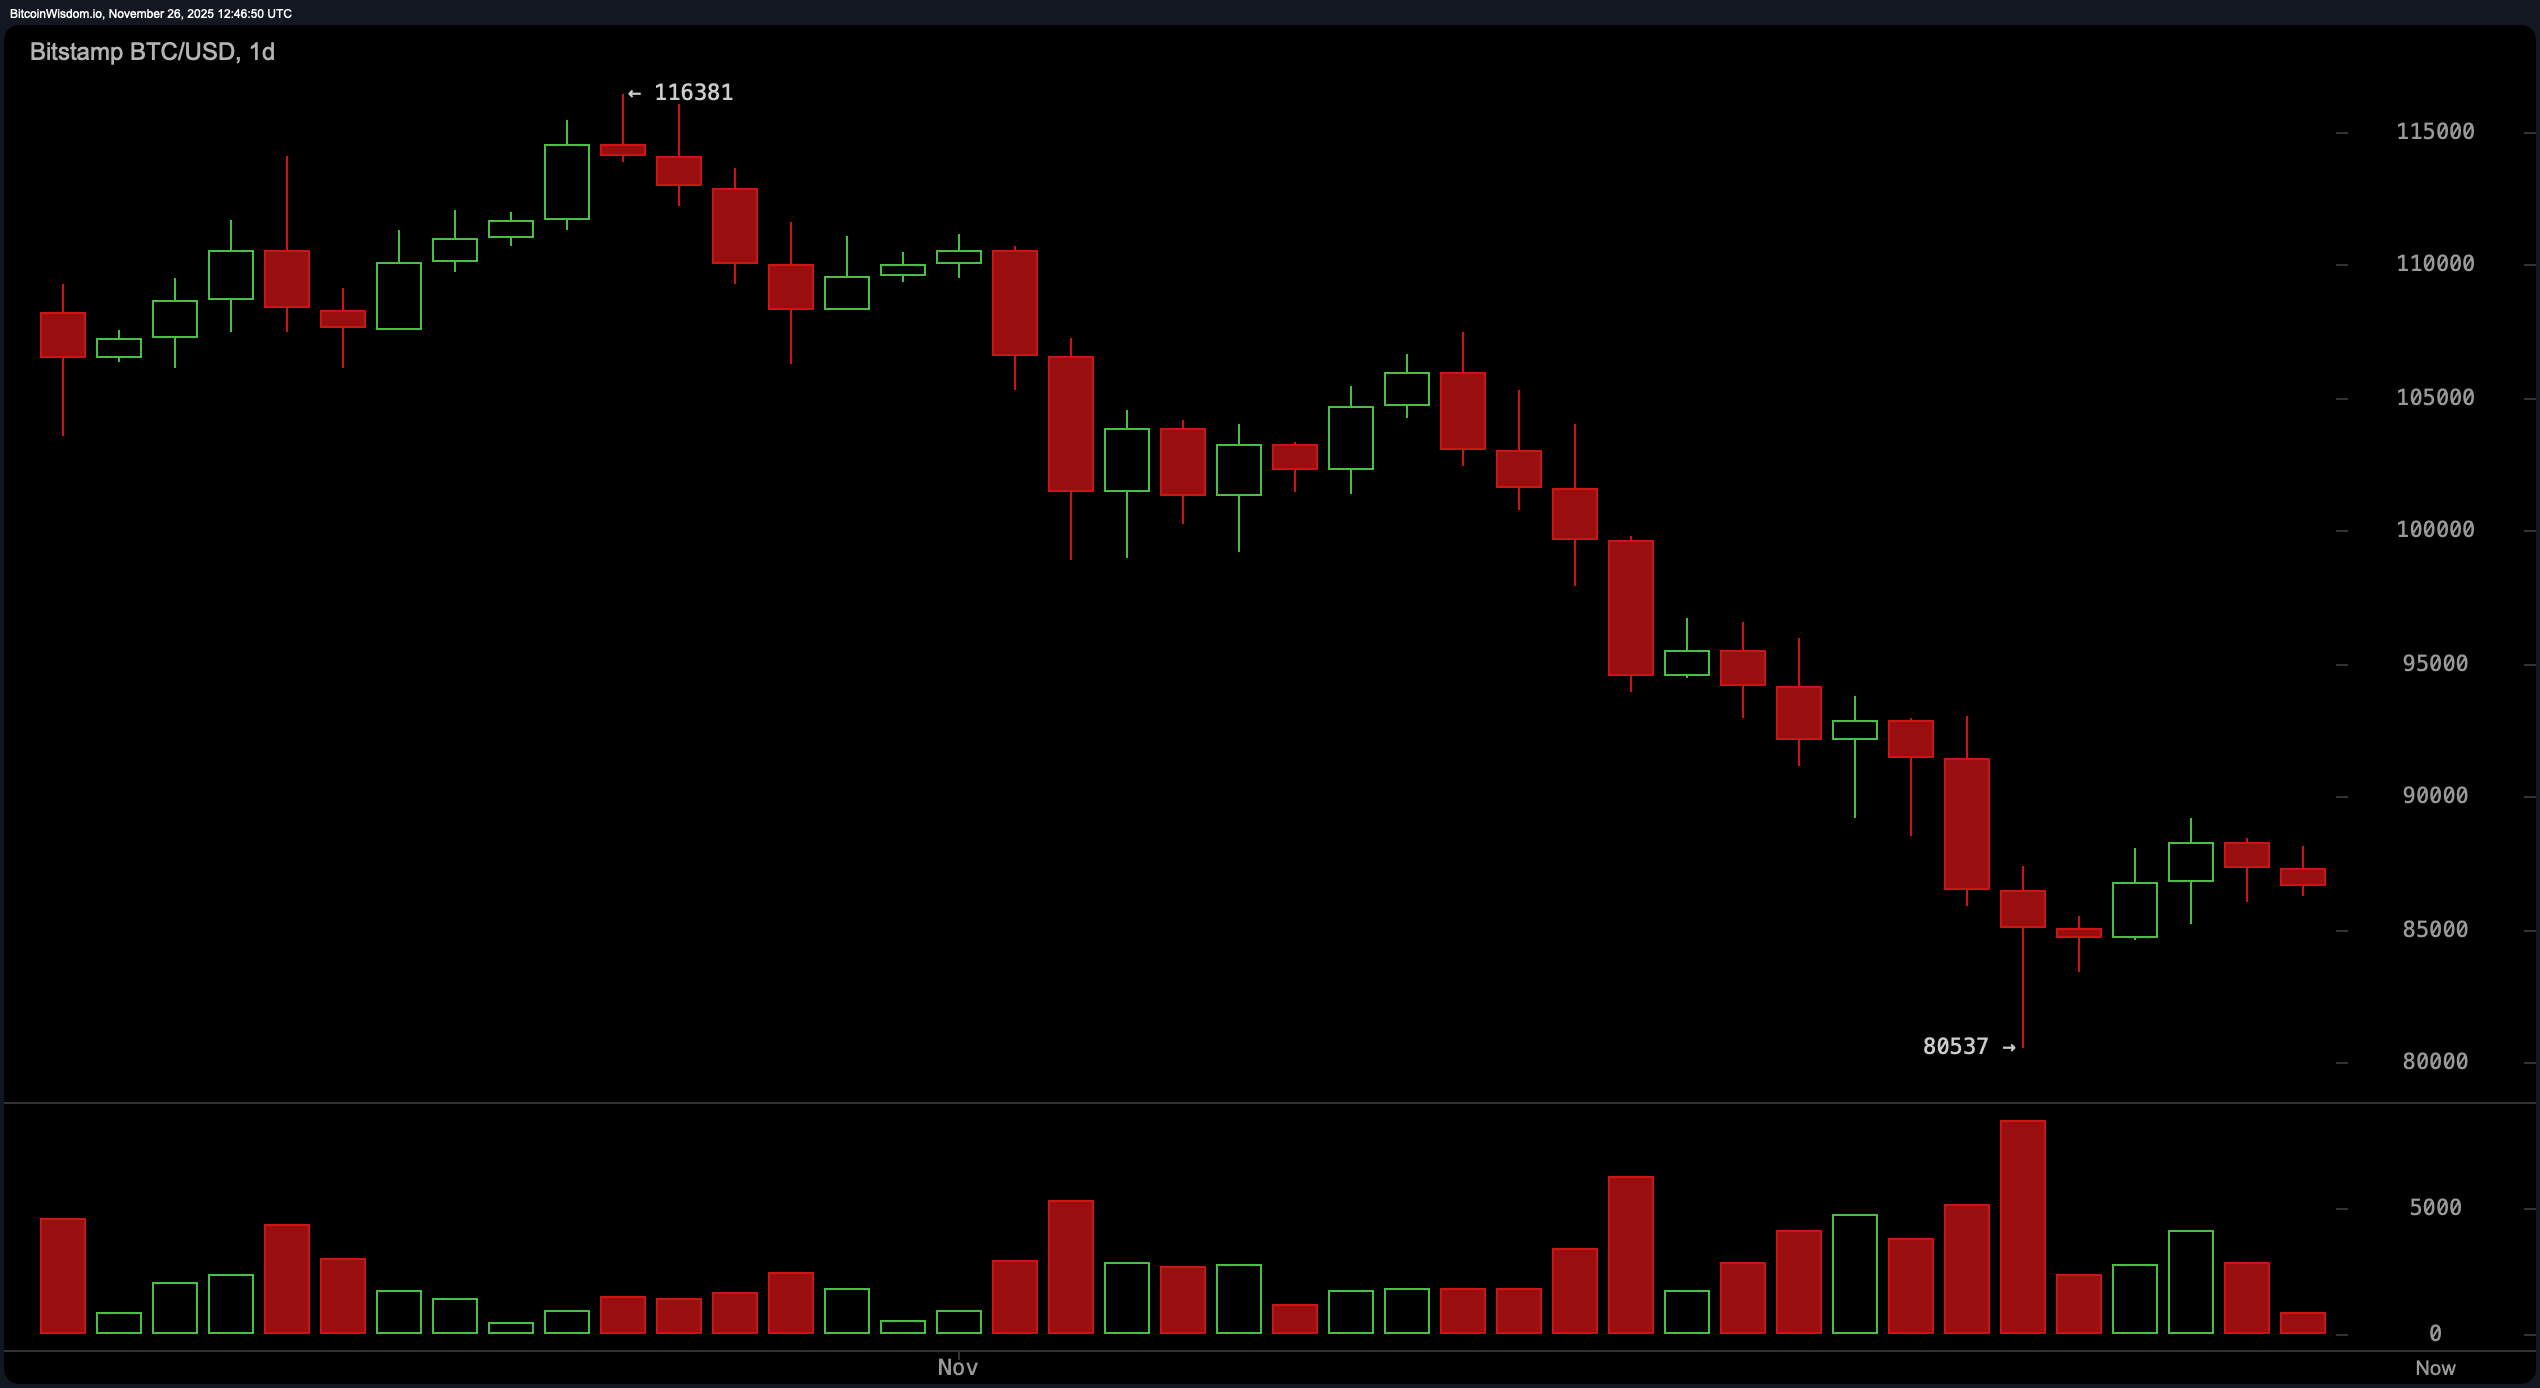
Let’s start with the daily chart, which is throwing down some serious shade. Bitcoin is stuck in a strong downtrend, sliding nearly 30% from recent highs. Although it bounced off a demand zone around $80,000, this so-called rebound looks more like a weak handshake than a comeback.
Volume surged on red candles, suggesting sellers are running the show. The current price action is bobbing near $87,000–$89,000, but until it confidently breaks above $90,000, the trend remains dominated by gravity.
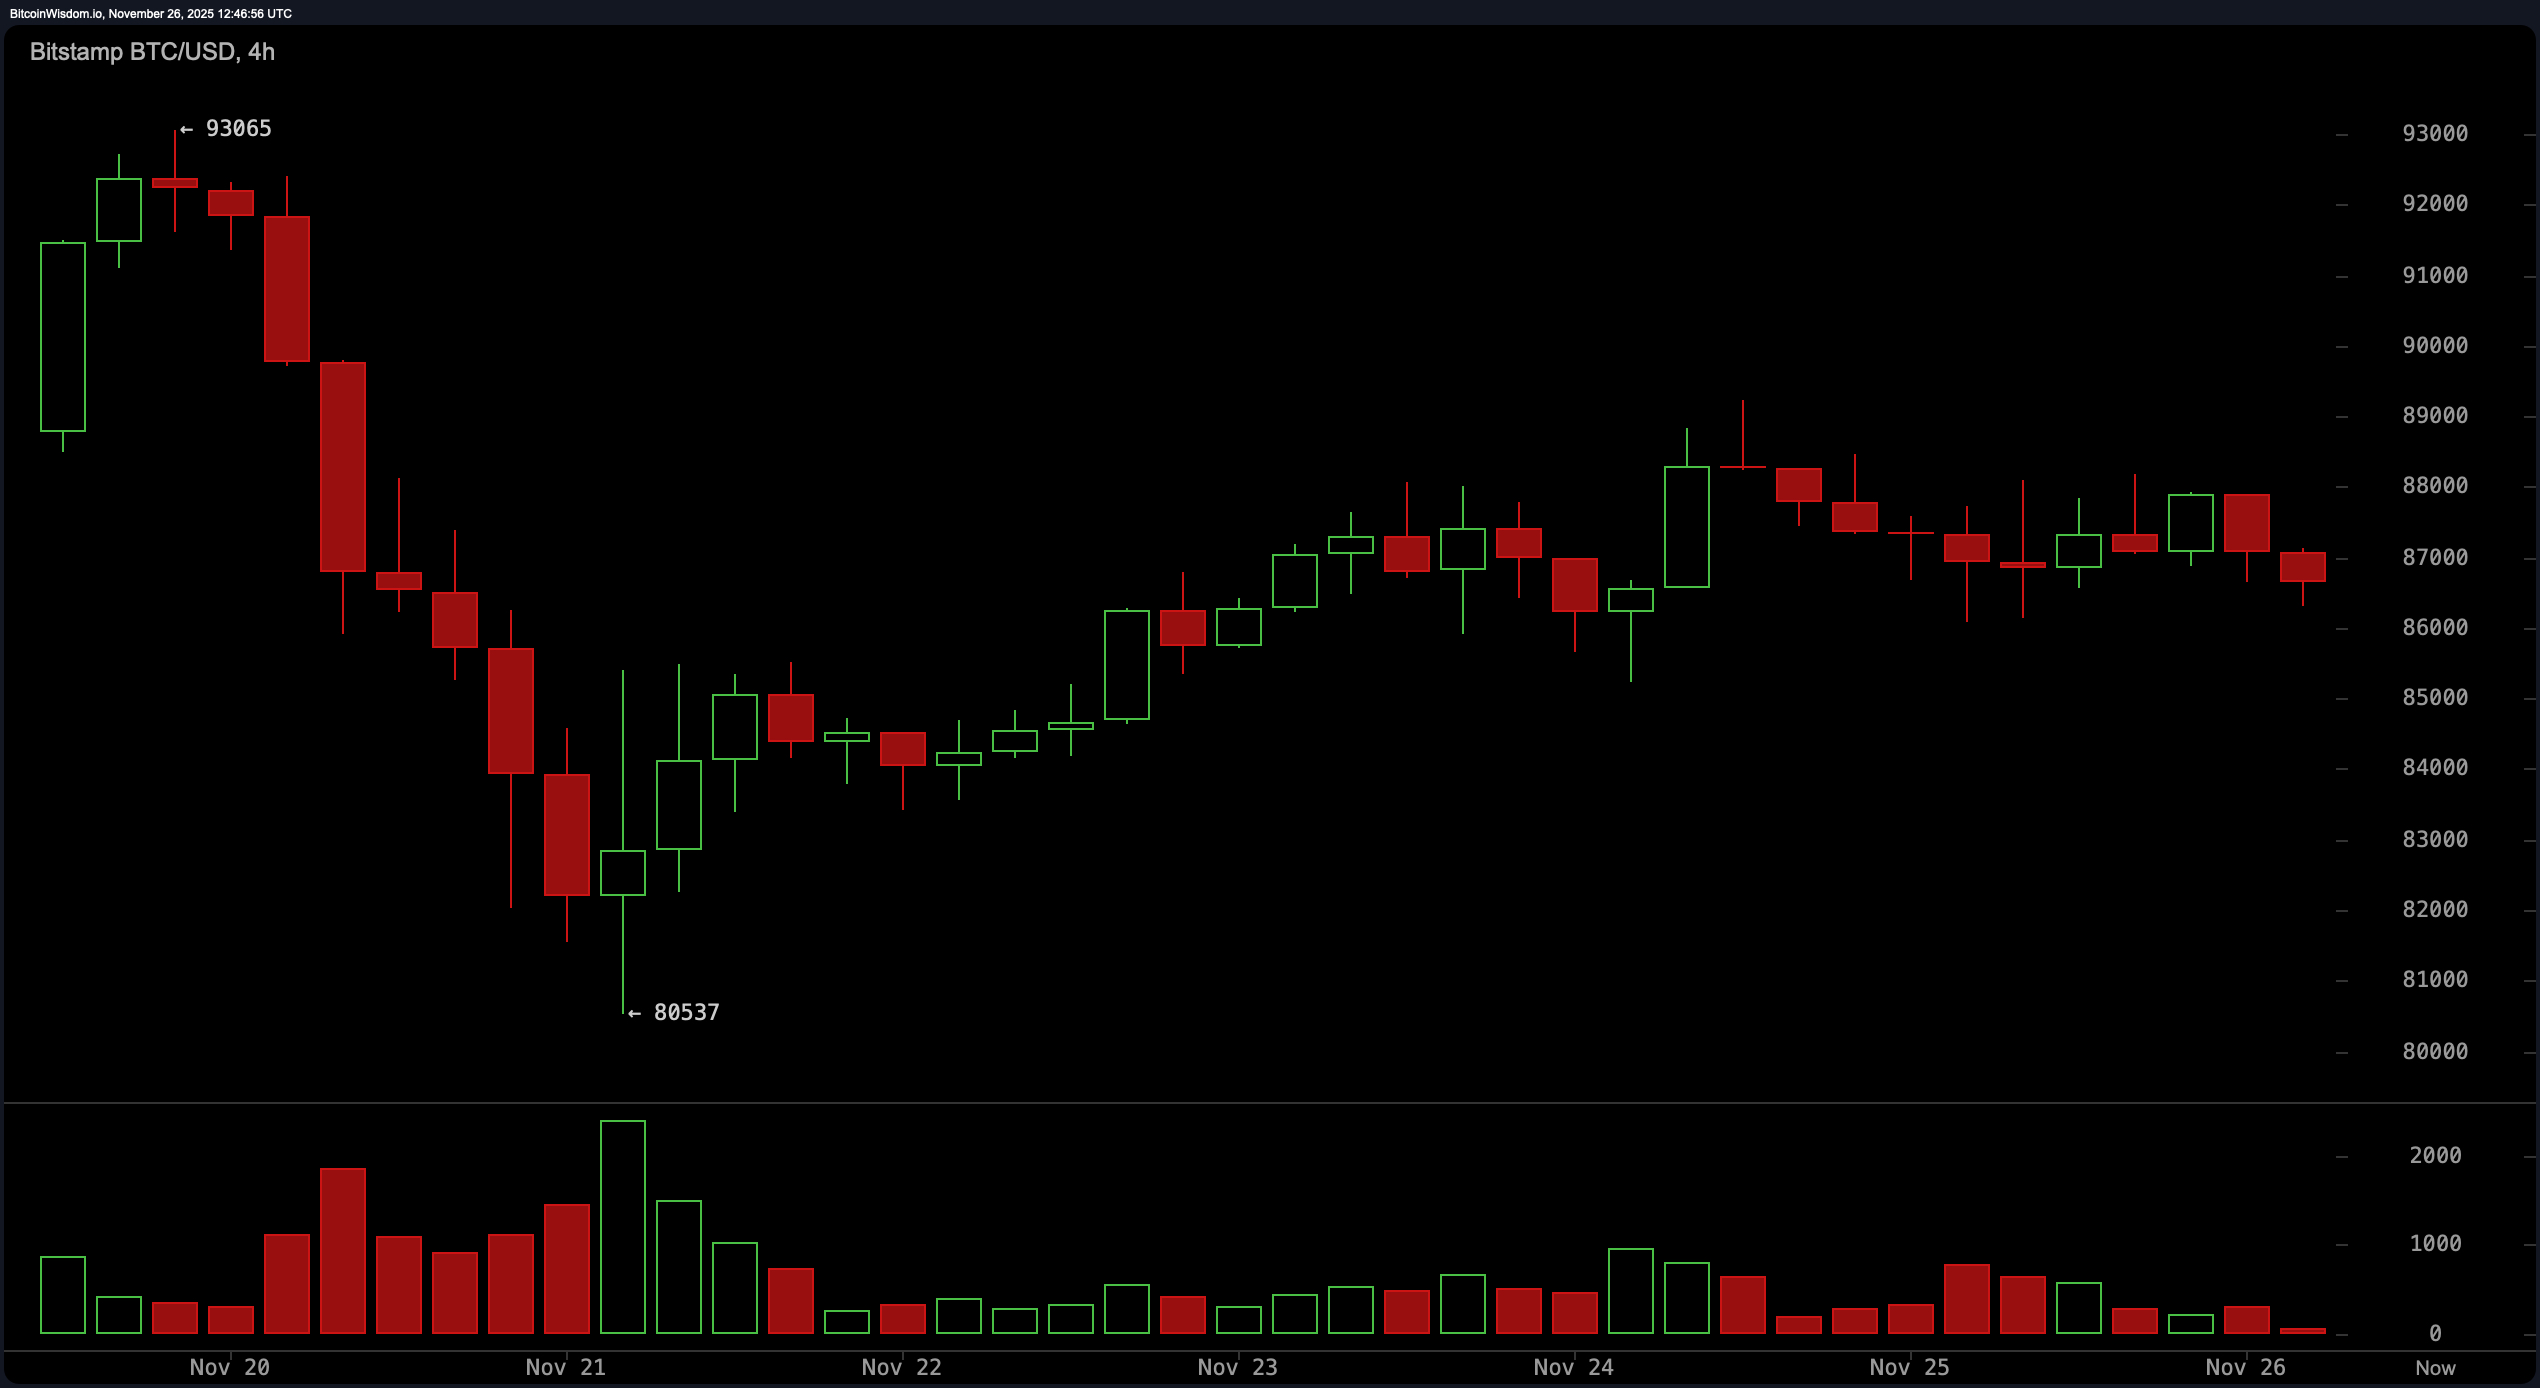
On the 4-hour chart, things look slightly more hopeful — or at least, less gloomy. Bitcoin popped from $80,537 to about $89,000 in a clean recovery rally, only to settle into a sideways flag that screams consolidation. Traders will recognize the classic pattern: price stalls, volume drops, and all eyes wait for a breakout. The range between $86,000 and $89,000 is the battlefield. A move above that upper limit could signal upside potential, but failure to hold the floor at $86,000 could open the gates to $83,000 or worse.
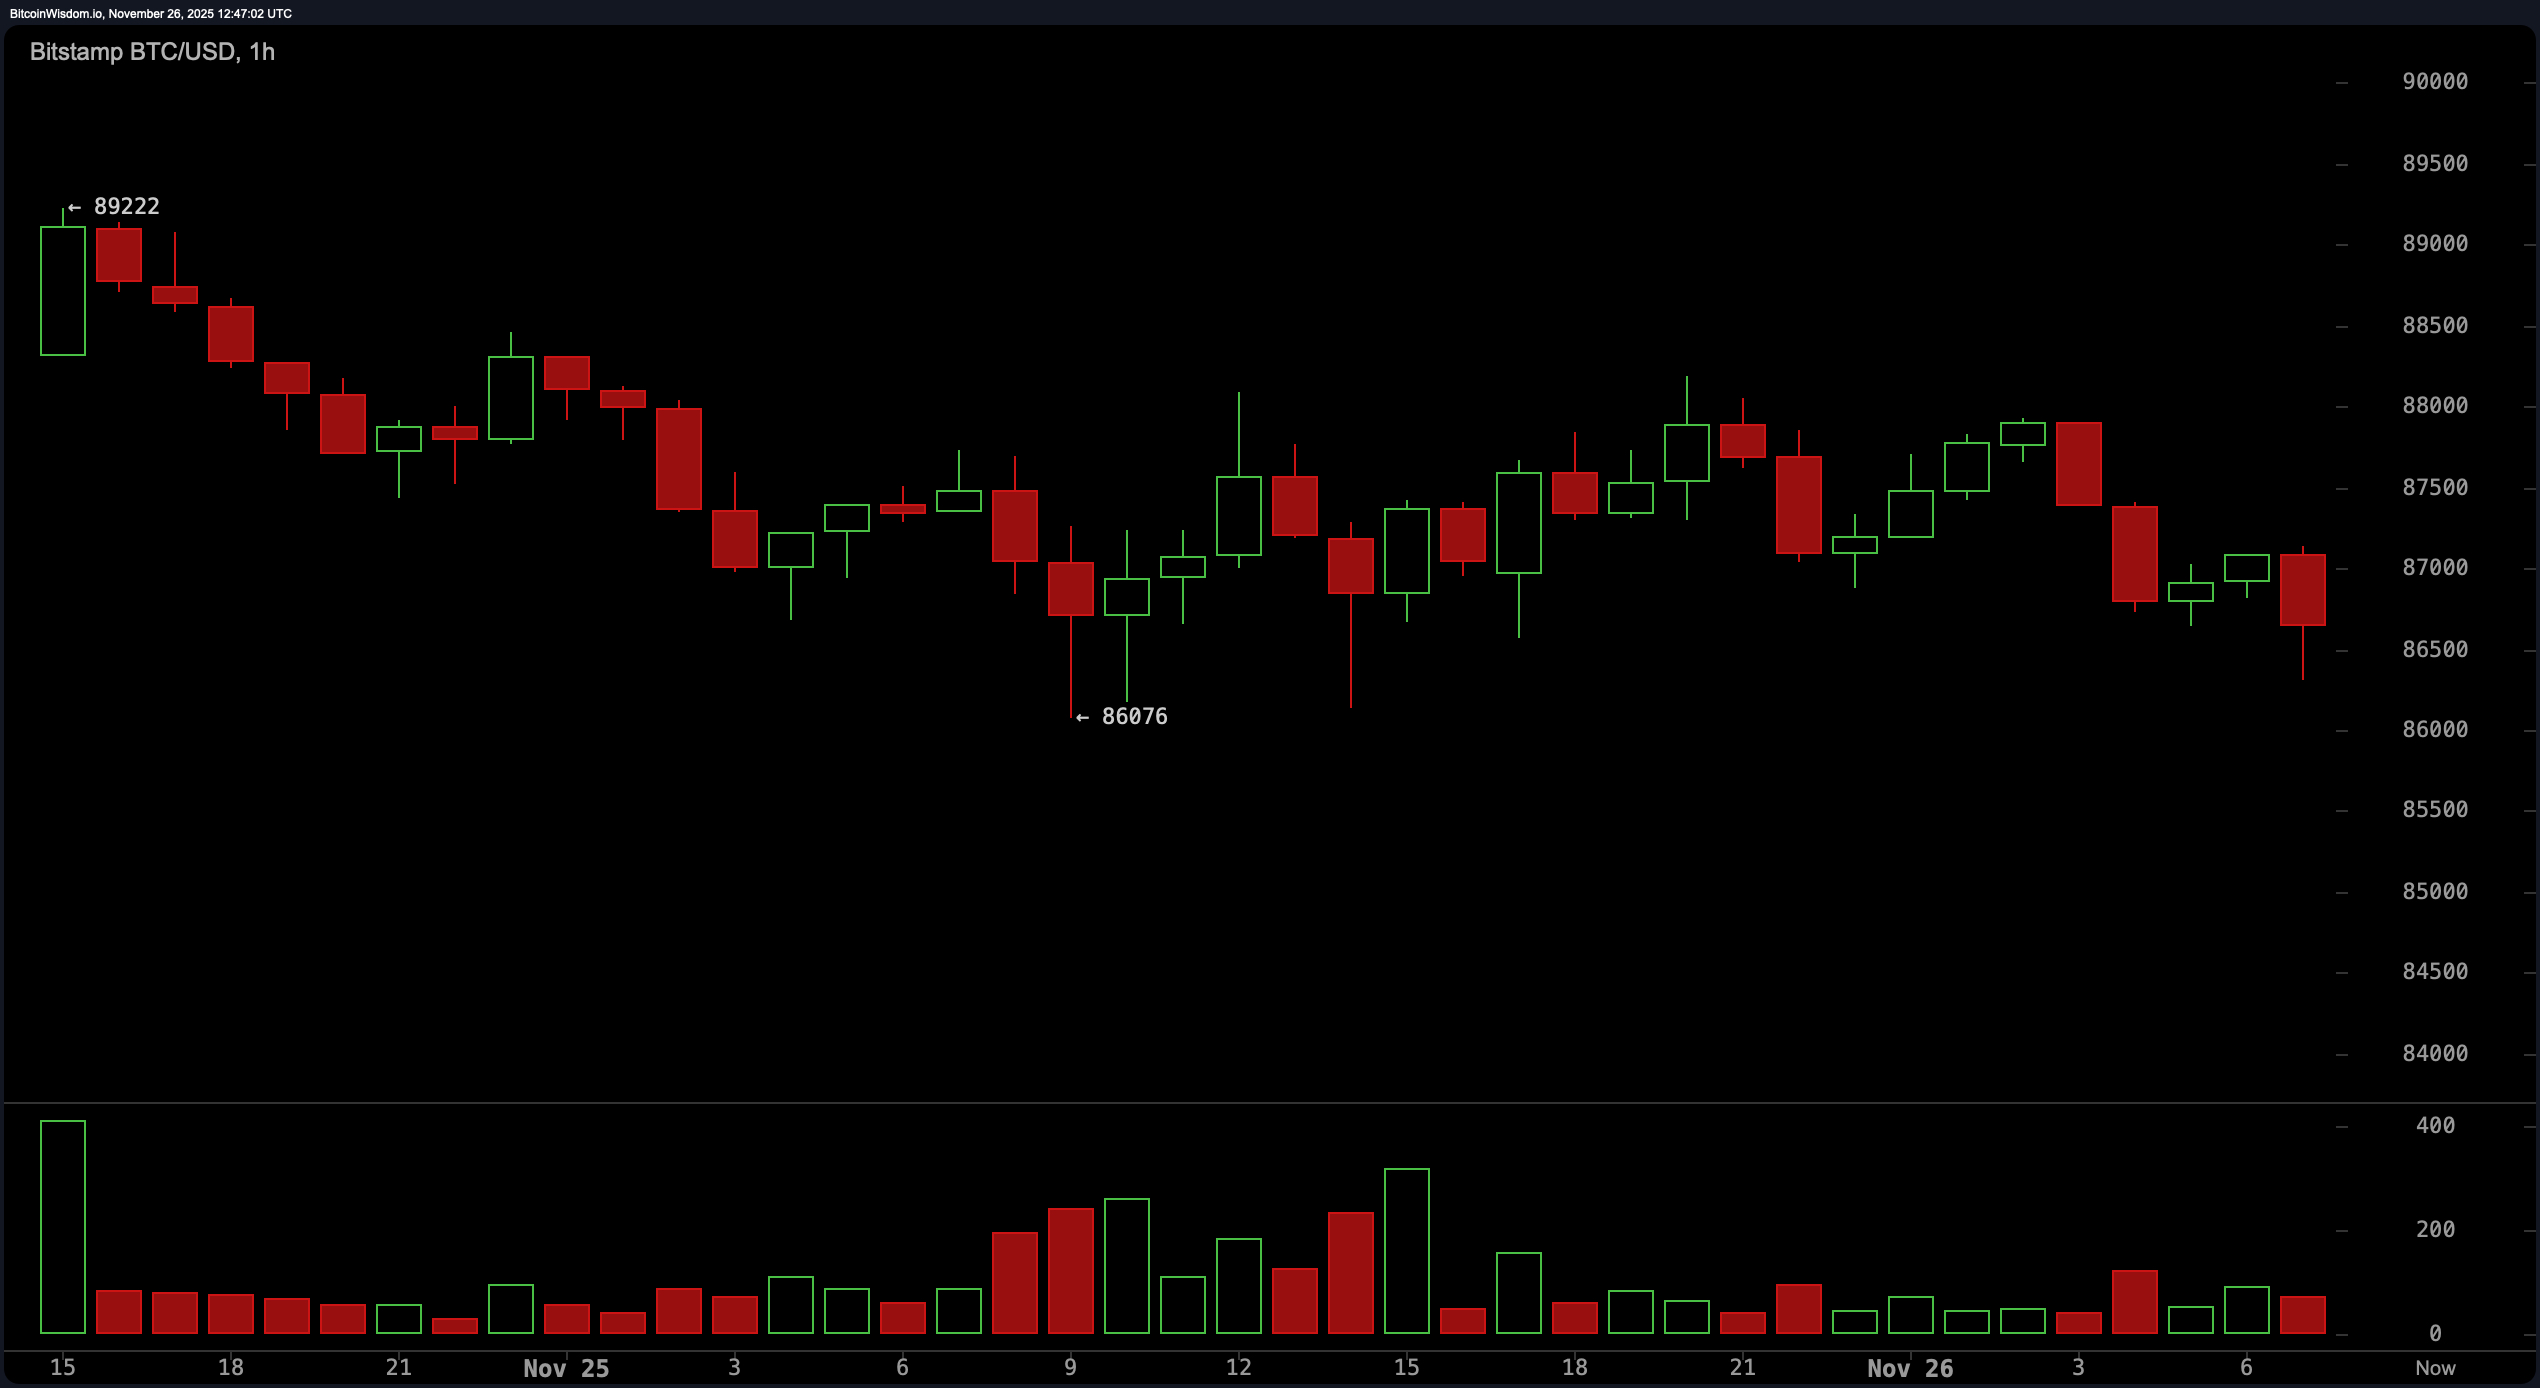
Zooming into the 1-hour chart reveals a range-bound snoozefest with a slight bearish lean. Bitcoin is ping-ponging between $86,500 and $89,000, and while that might look tradable, it’s not exactly a confidence-inspiring setup. Bearish candlesticks outnumber the bullish ones, suggesting sellers still lurk in the shadows. Without strong volume or clear momentum, any move out of this tight band might be more trap than trend.
The indicators aren’t bringing any party favors either. Oscillators are largely neutral: the relative strength index (RSI) is at 31, the stochastic oscillator is at 27, and the commodity channel index (CCI) is reading −79. All signals are shrugging their shoulders. The momentum oscillator, though, has perked up to −7,549, while the moving average convergence divergence (MACD) level is sitting at −5,512. That contrast shows a market wrestling between a fading trend and feeble strength.
Moving averages, meanwhile, are uniformly pessimistic. Every single metric from the 10-period exponential moving average (EMA) at $89,021 to the 200-period simple moving average (SMA) at $109,968 is offering nothing but downside. It’s a graveyard of resistance levels. This kind of alignment is textbook bearish — even the 50-period EMA, usually the halfway house of trend direction, is up at $101,138 and declining.
In short, bitcoin is stuck in a technical tug-of-war with momentum trying to revive the trend and longer-term indicators giving it the side eye. It’ll need a strong catalyst or breakout beyond $90,000 to rewrite the script. Until then, this chart reads more cautionary tale than a comeback story.
Bull Verdict:
If bitcoin can stage a decisive breakout above $90,000 with solid volume and reclaim the daily trendline, bulls might finally have the firepower to challenge the $95,000–$100,000 resistance zone. A higher low above $80,000 and renewed momentum could lay the groundwork for a reversal — but as of now, that’s more ambition than actuality.
Bear Verdict:
With moving averages stacked like bricks in a descending wall and daily structure still firmly in a downtrend, the path of least resistance remains downward. If bitcoin loses its grip on $86,000, a slide toward $83,000 or even a revisit to $80,000 isn’t just possible — it’s technically justified.
FAQ ❓
- What is the current bitcoin price? Bitcoin is trading at $86,411 as of November 26, 2025.
- Is bitcoin in a downtrend right now?Yes, bitcoin remains in a strong daily downtrend with bearish momentum.
- What price levels should traders watch?Key levels include $86,000 as support and $90,000 as critical resistance.
- Are technical indicators bullish or bearish for bitcoin?Most moving averages and oscillators signal bearish or neutral sentiment.