
Bitcoin $BTC$87,566.53 traders, buckle up. Renewed optimism around potential Fed rate cuts is lighting a hopeful spark for $BTC’s recovery and there are some key price levels worth noting.
First up on the radar: the 200-hour simple moving average (SMA), currently seen close to $88,000. This level has been playing the role of a ceiling since Monday, putting the brakes on the upside moves.
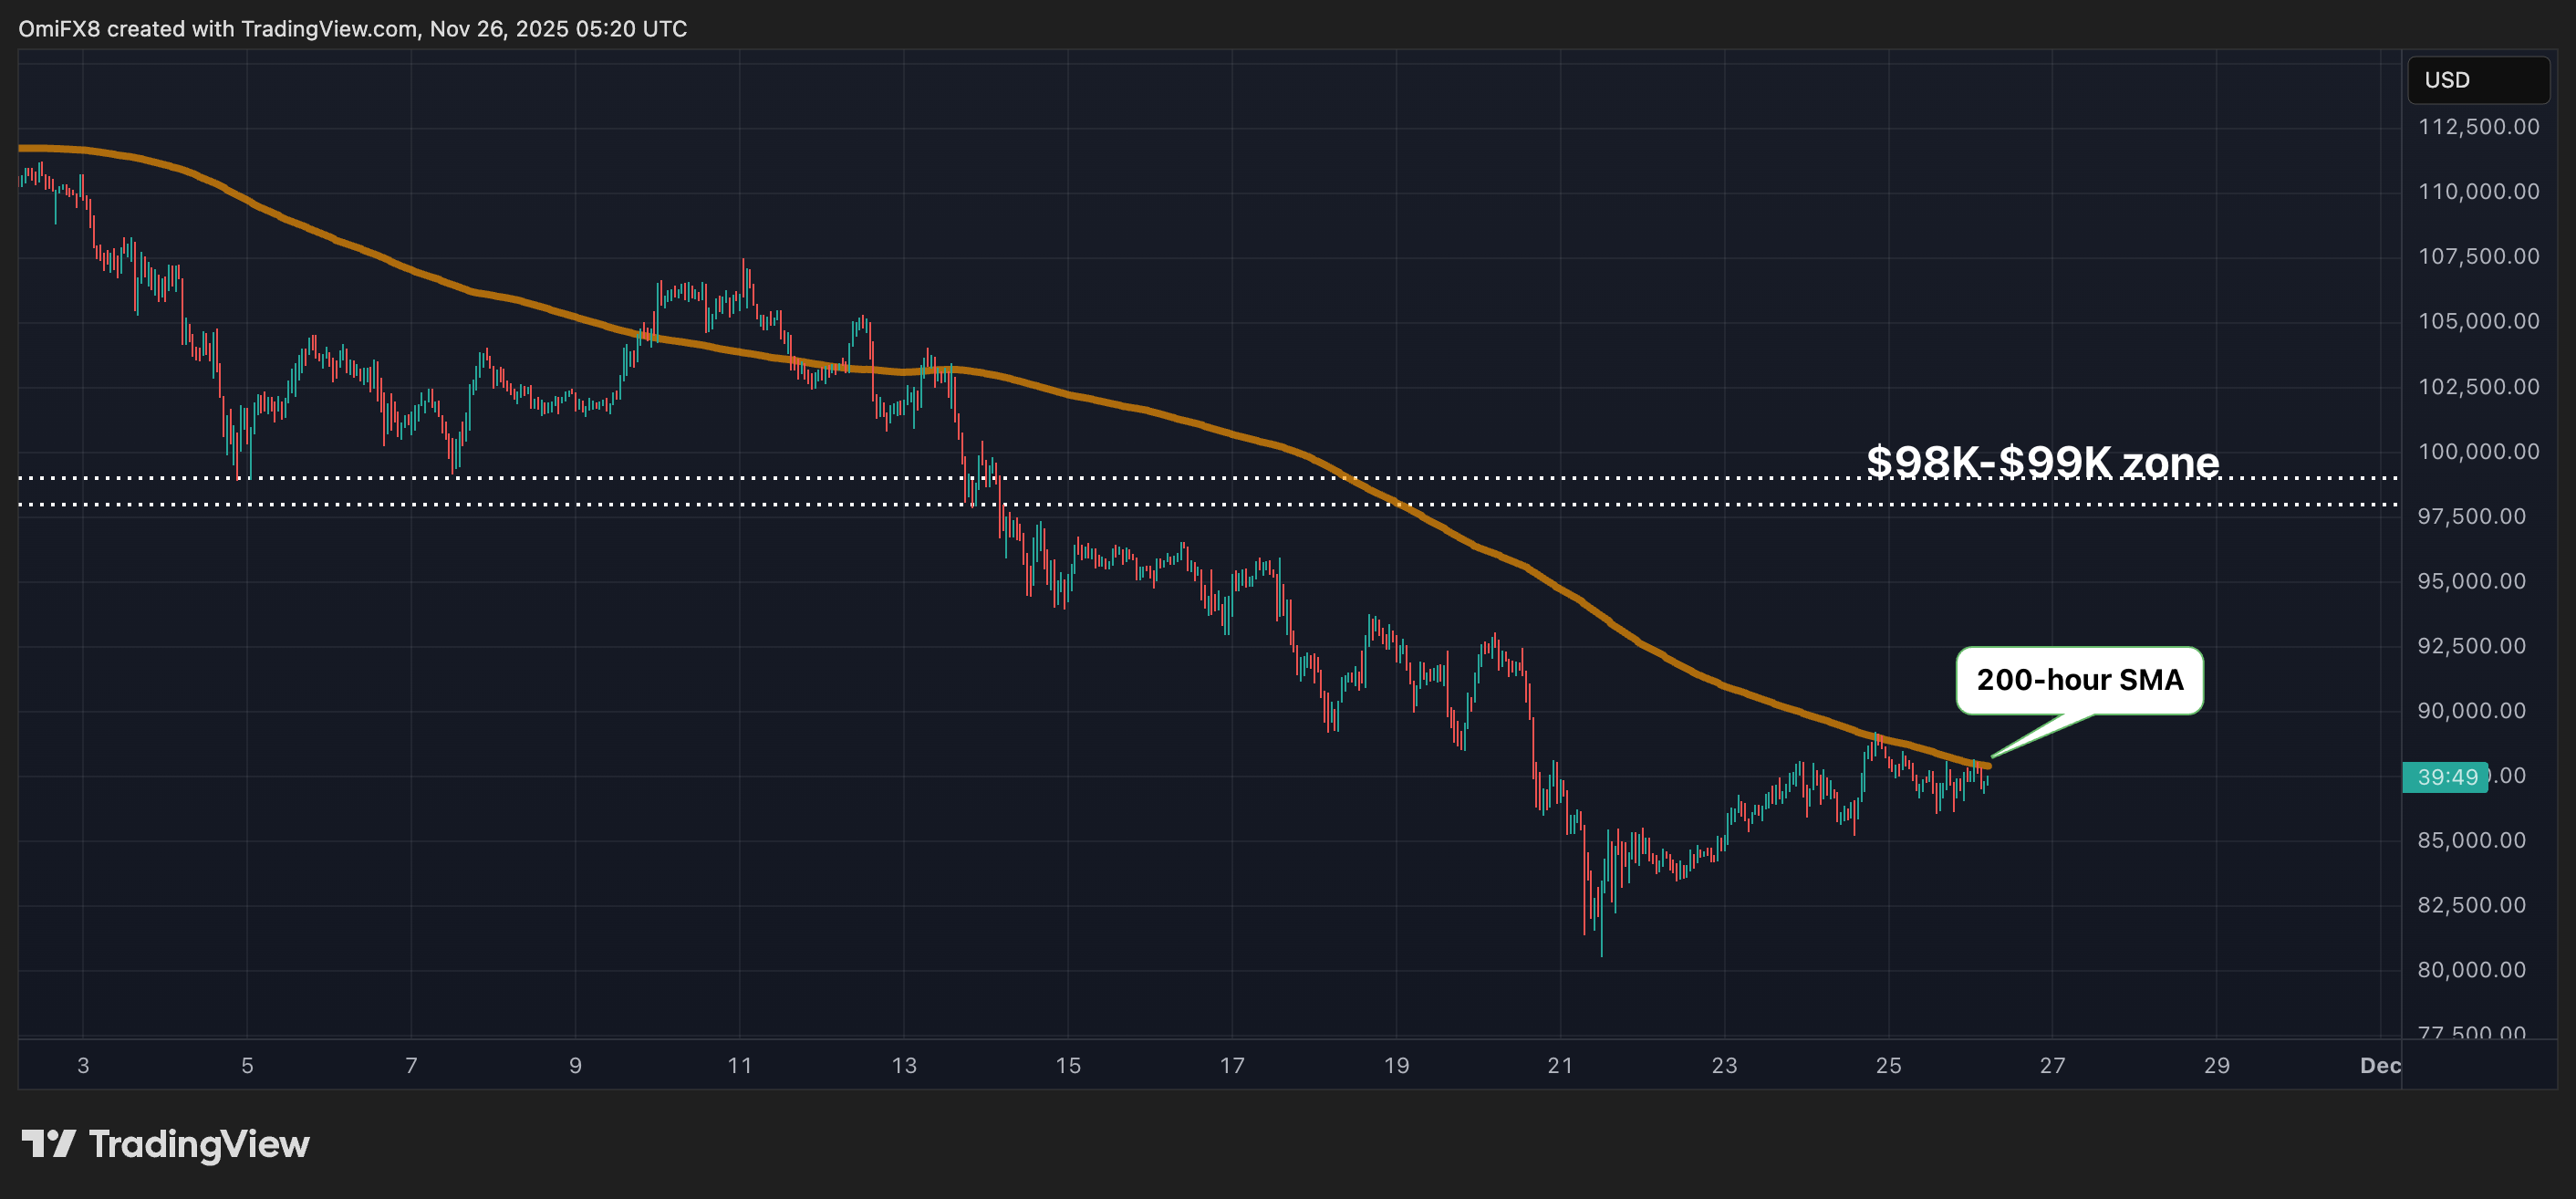
But here’s the twist: This SMA has stopped sliding downward, signaling that the selling pressure might be losing steam. If $BTC can break above this, it could rev up trader confidence and set the stage for a sharper recovery rally. Think of it as bitcoin shaking off the dust after a slow crawl.
Next resistance to watch? The $98,000 to $99,000 zone, a stubborn battleground marked by multiple daily lows earlier this month and back in June.
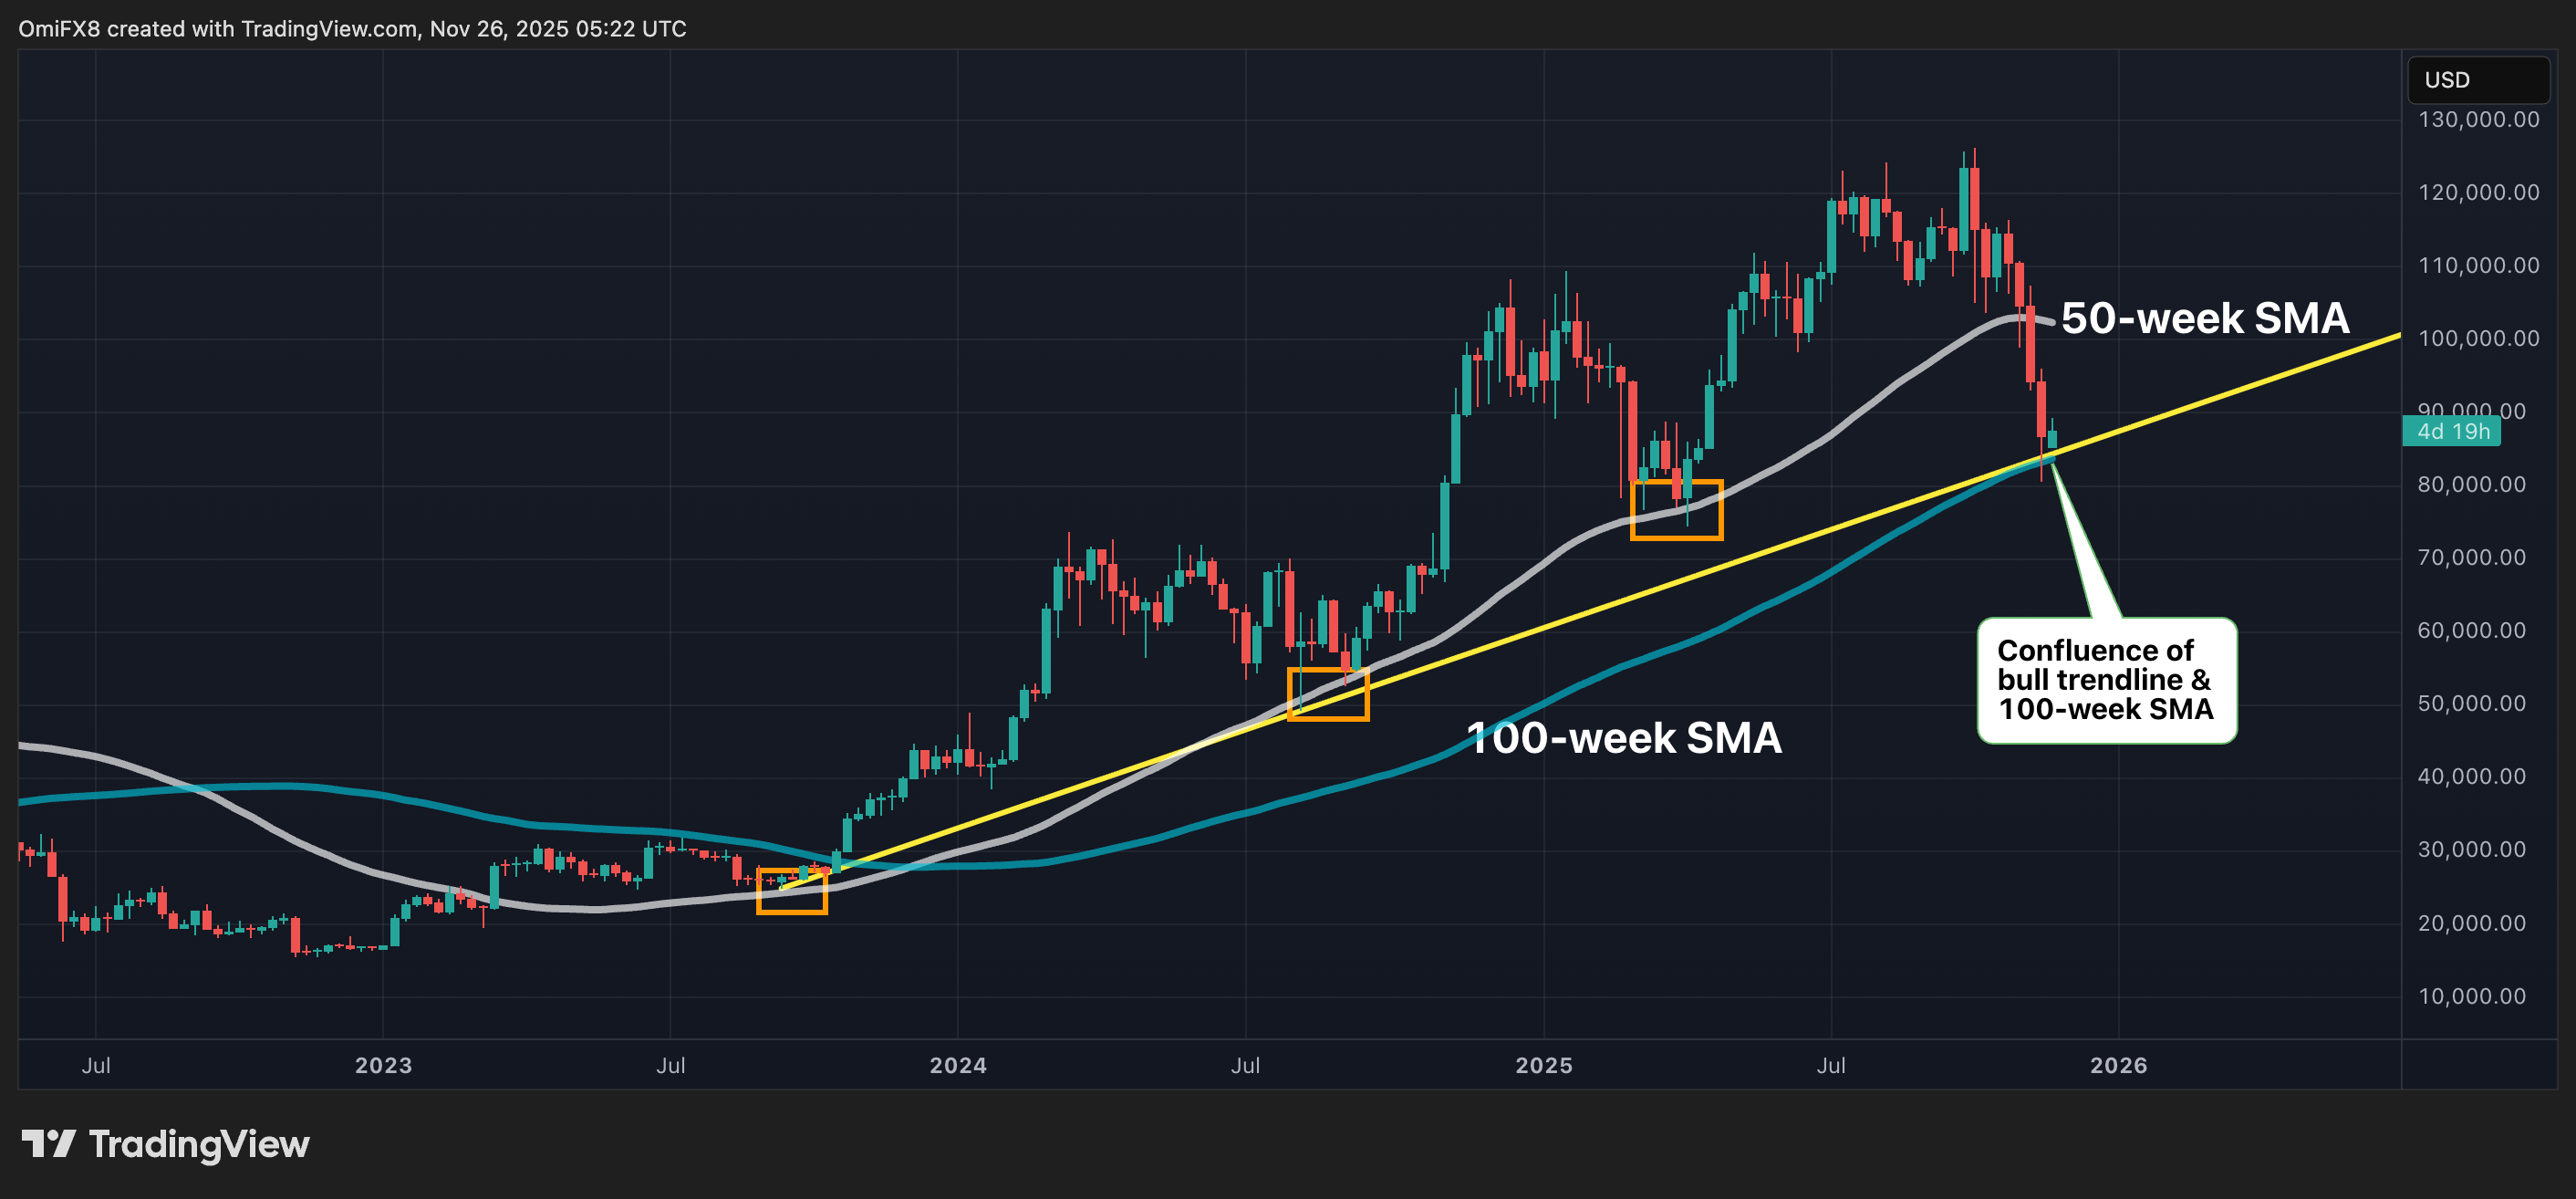
And then, the big daddy: the 50-week SMA just north of $102,000. This was the hero for bulls, acting as a strong support line multiple times throughout 2023, fueling bigger gains every time it held. But in early November, prices pierced through this level, confirming a bearish trend change.
If $BTC can stage a triumphant comeback above this SMA, it would signal a revival of the big-picture bullish trend—think of it as the light at the end of the tunnel.
Key support levels
Now, don’t forget your safety nets: the most critical support level hovers around $83,680, where the 100-week SMA and a macro bullish trendline intersect. A break beneath this would be a red flag, cementing the recent bearish shift and potentially opening the door to deeper losses.
Should that happen, the next cushion to catch the fall is near $74,500, a level sellers ran out of steam in early April, paving the way for a renewed upswing.
Taken together, these key levels point to an exciting trading landscape, with major averages acting as gatekeepers, defining the battle lines between bulls and bears.