
Bitcoin isn’t here to play it safe—trading at $87,647 with a market cap of $1.74 trillion and 24-hour volume clocking in at $19.95 billion, the world’s favorite digital firecracker strutted through an intraday range of $85,545 to $89,111. But beneath the flashy figures, price action tells a more nuanced story—one of resistance battles, momentum mysteries, and enough mixed signals to confuse even the boldest traders.
Bitcoin Chart Outlook
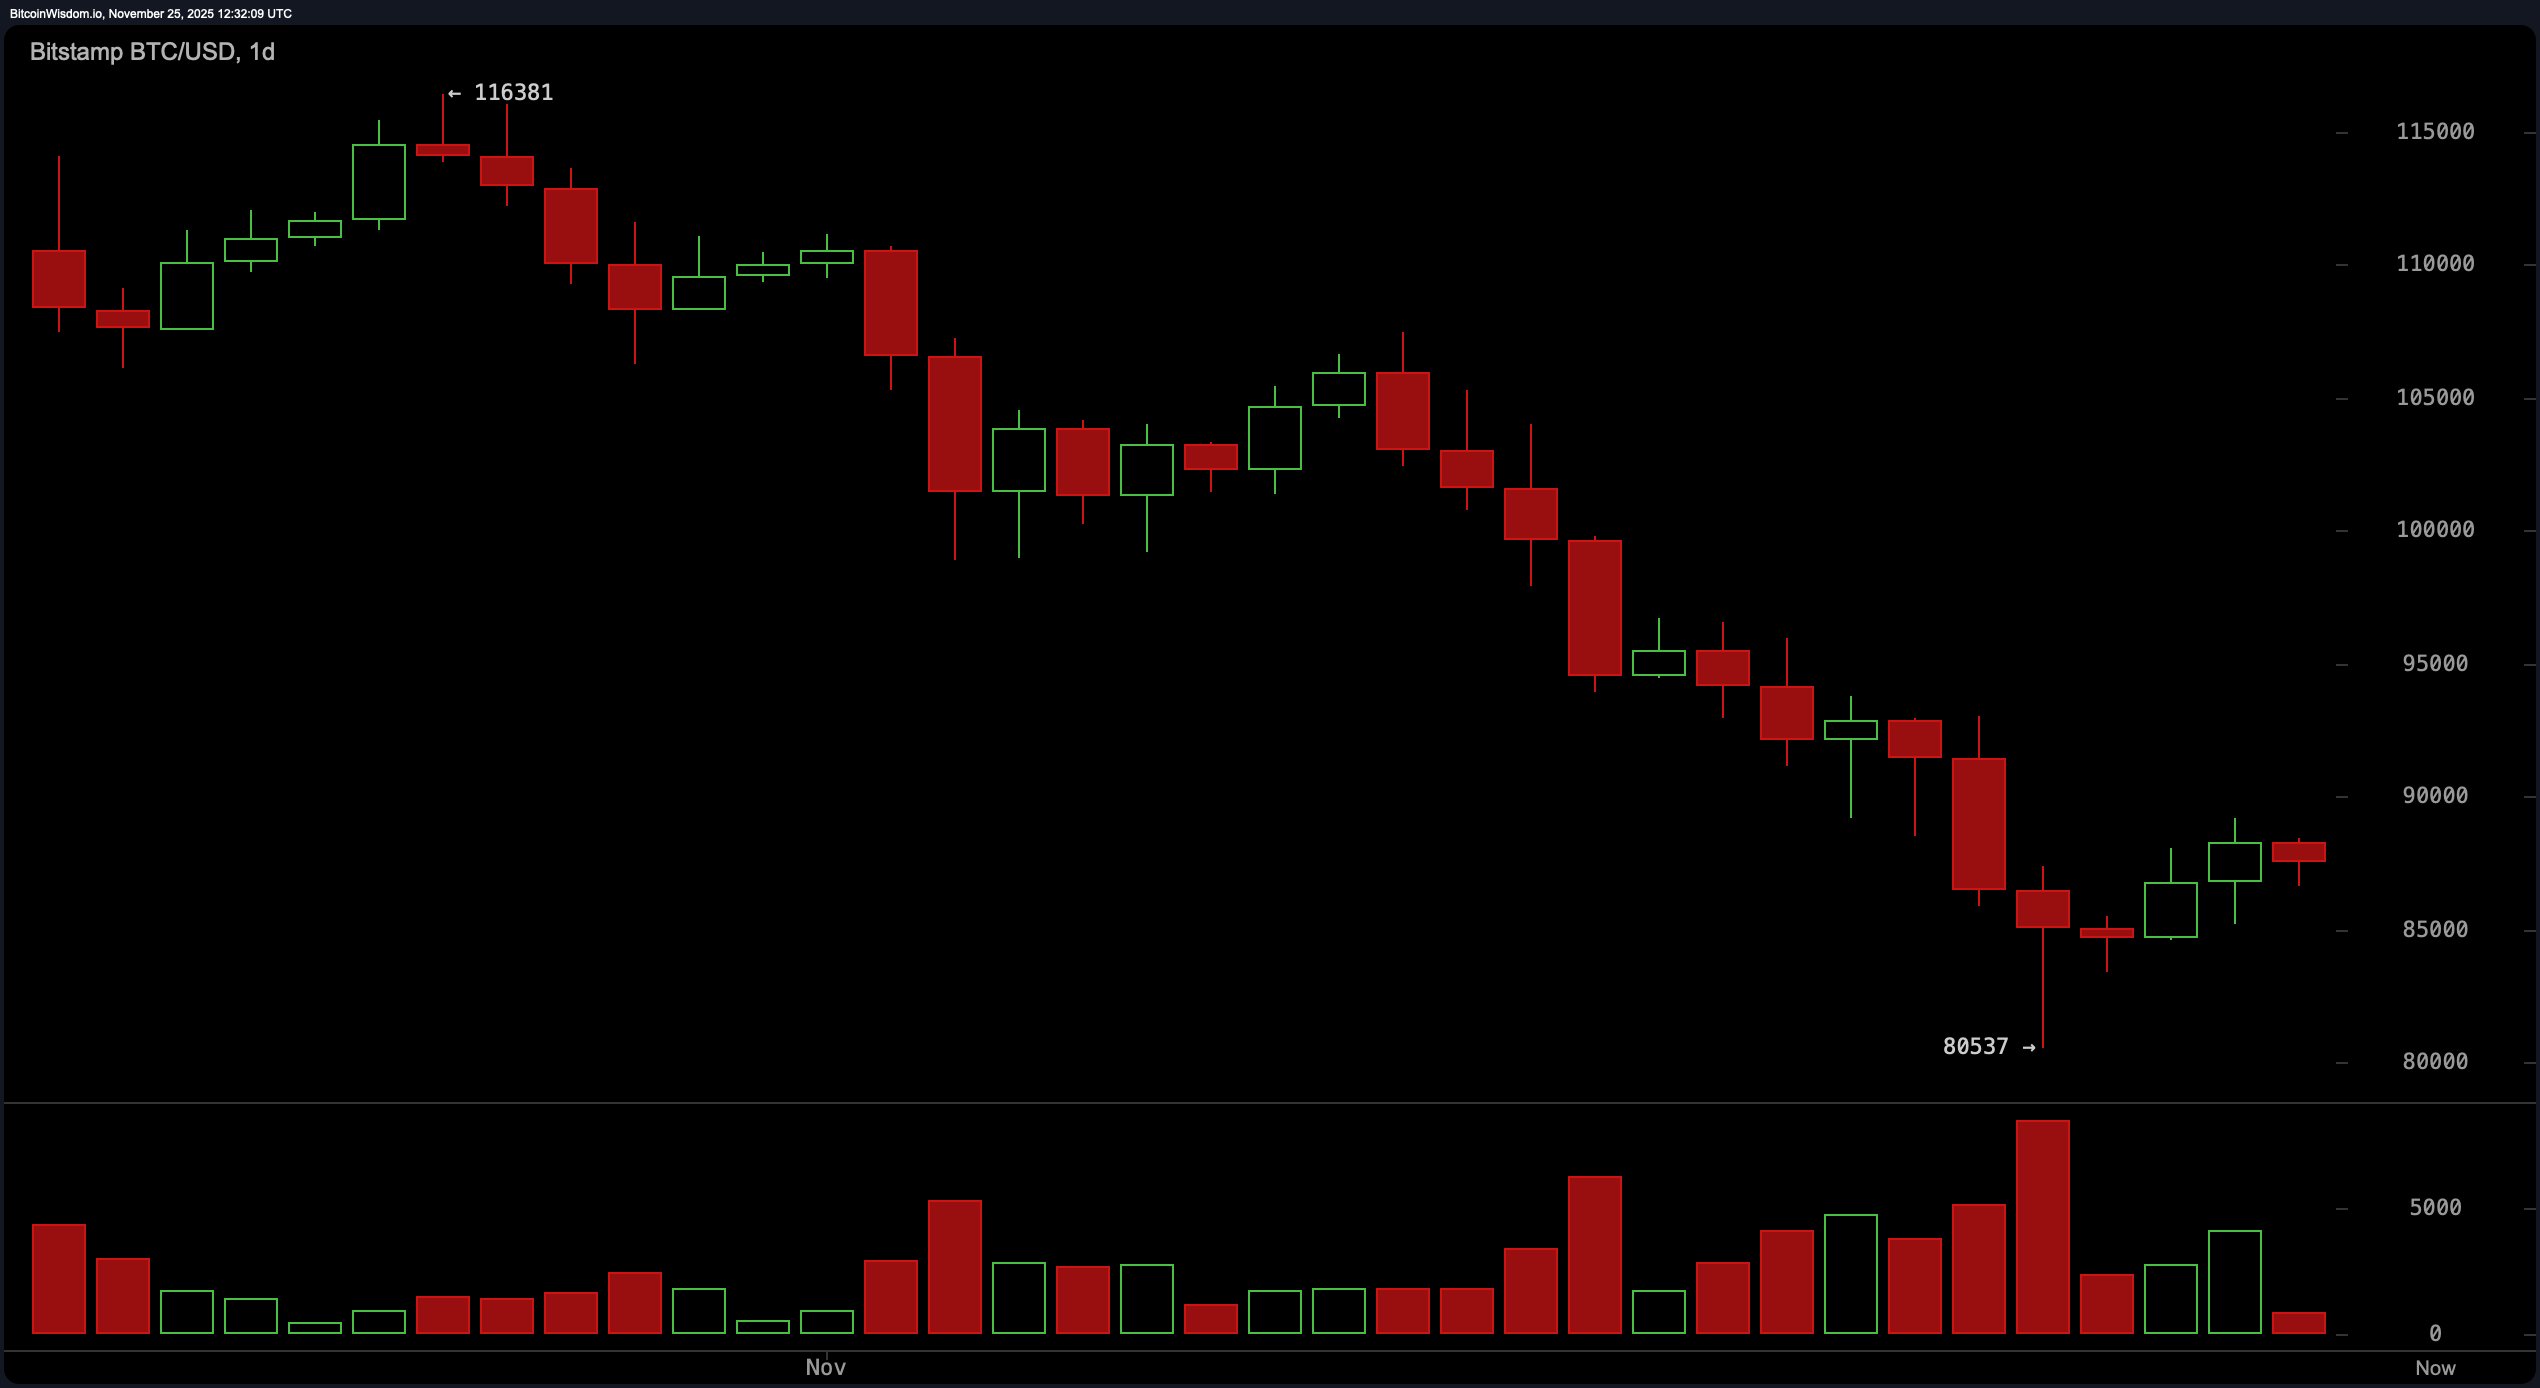
On the daily chart, bitcoin is attempting to crawl out of the hole it dug during its plummet from around $116,000 to just over $80,500. There’s a whiff of a relief bounce, with support firm at $80,537 and resistance looming stubbornly near $90,000. Volume has perked up slightly, though let’s not call it a comeback yet.
A mild bullish divergence—where price dipped but selling volume didn’t match pace—suggests bears might be getting winded. Yet until the $90,000 level is shattered with high-volume bravado, this could just be a textbook dead cat bounce masquerading as recovery.
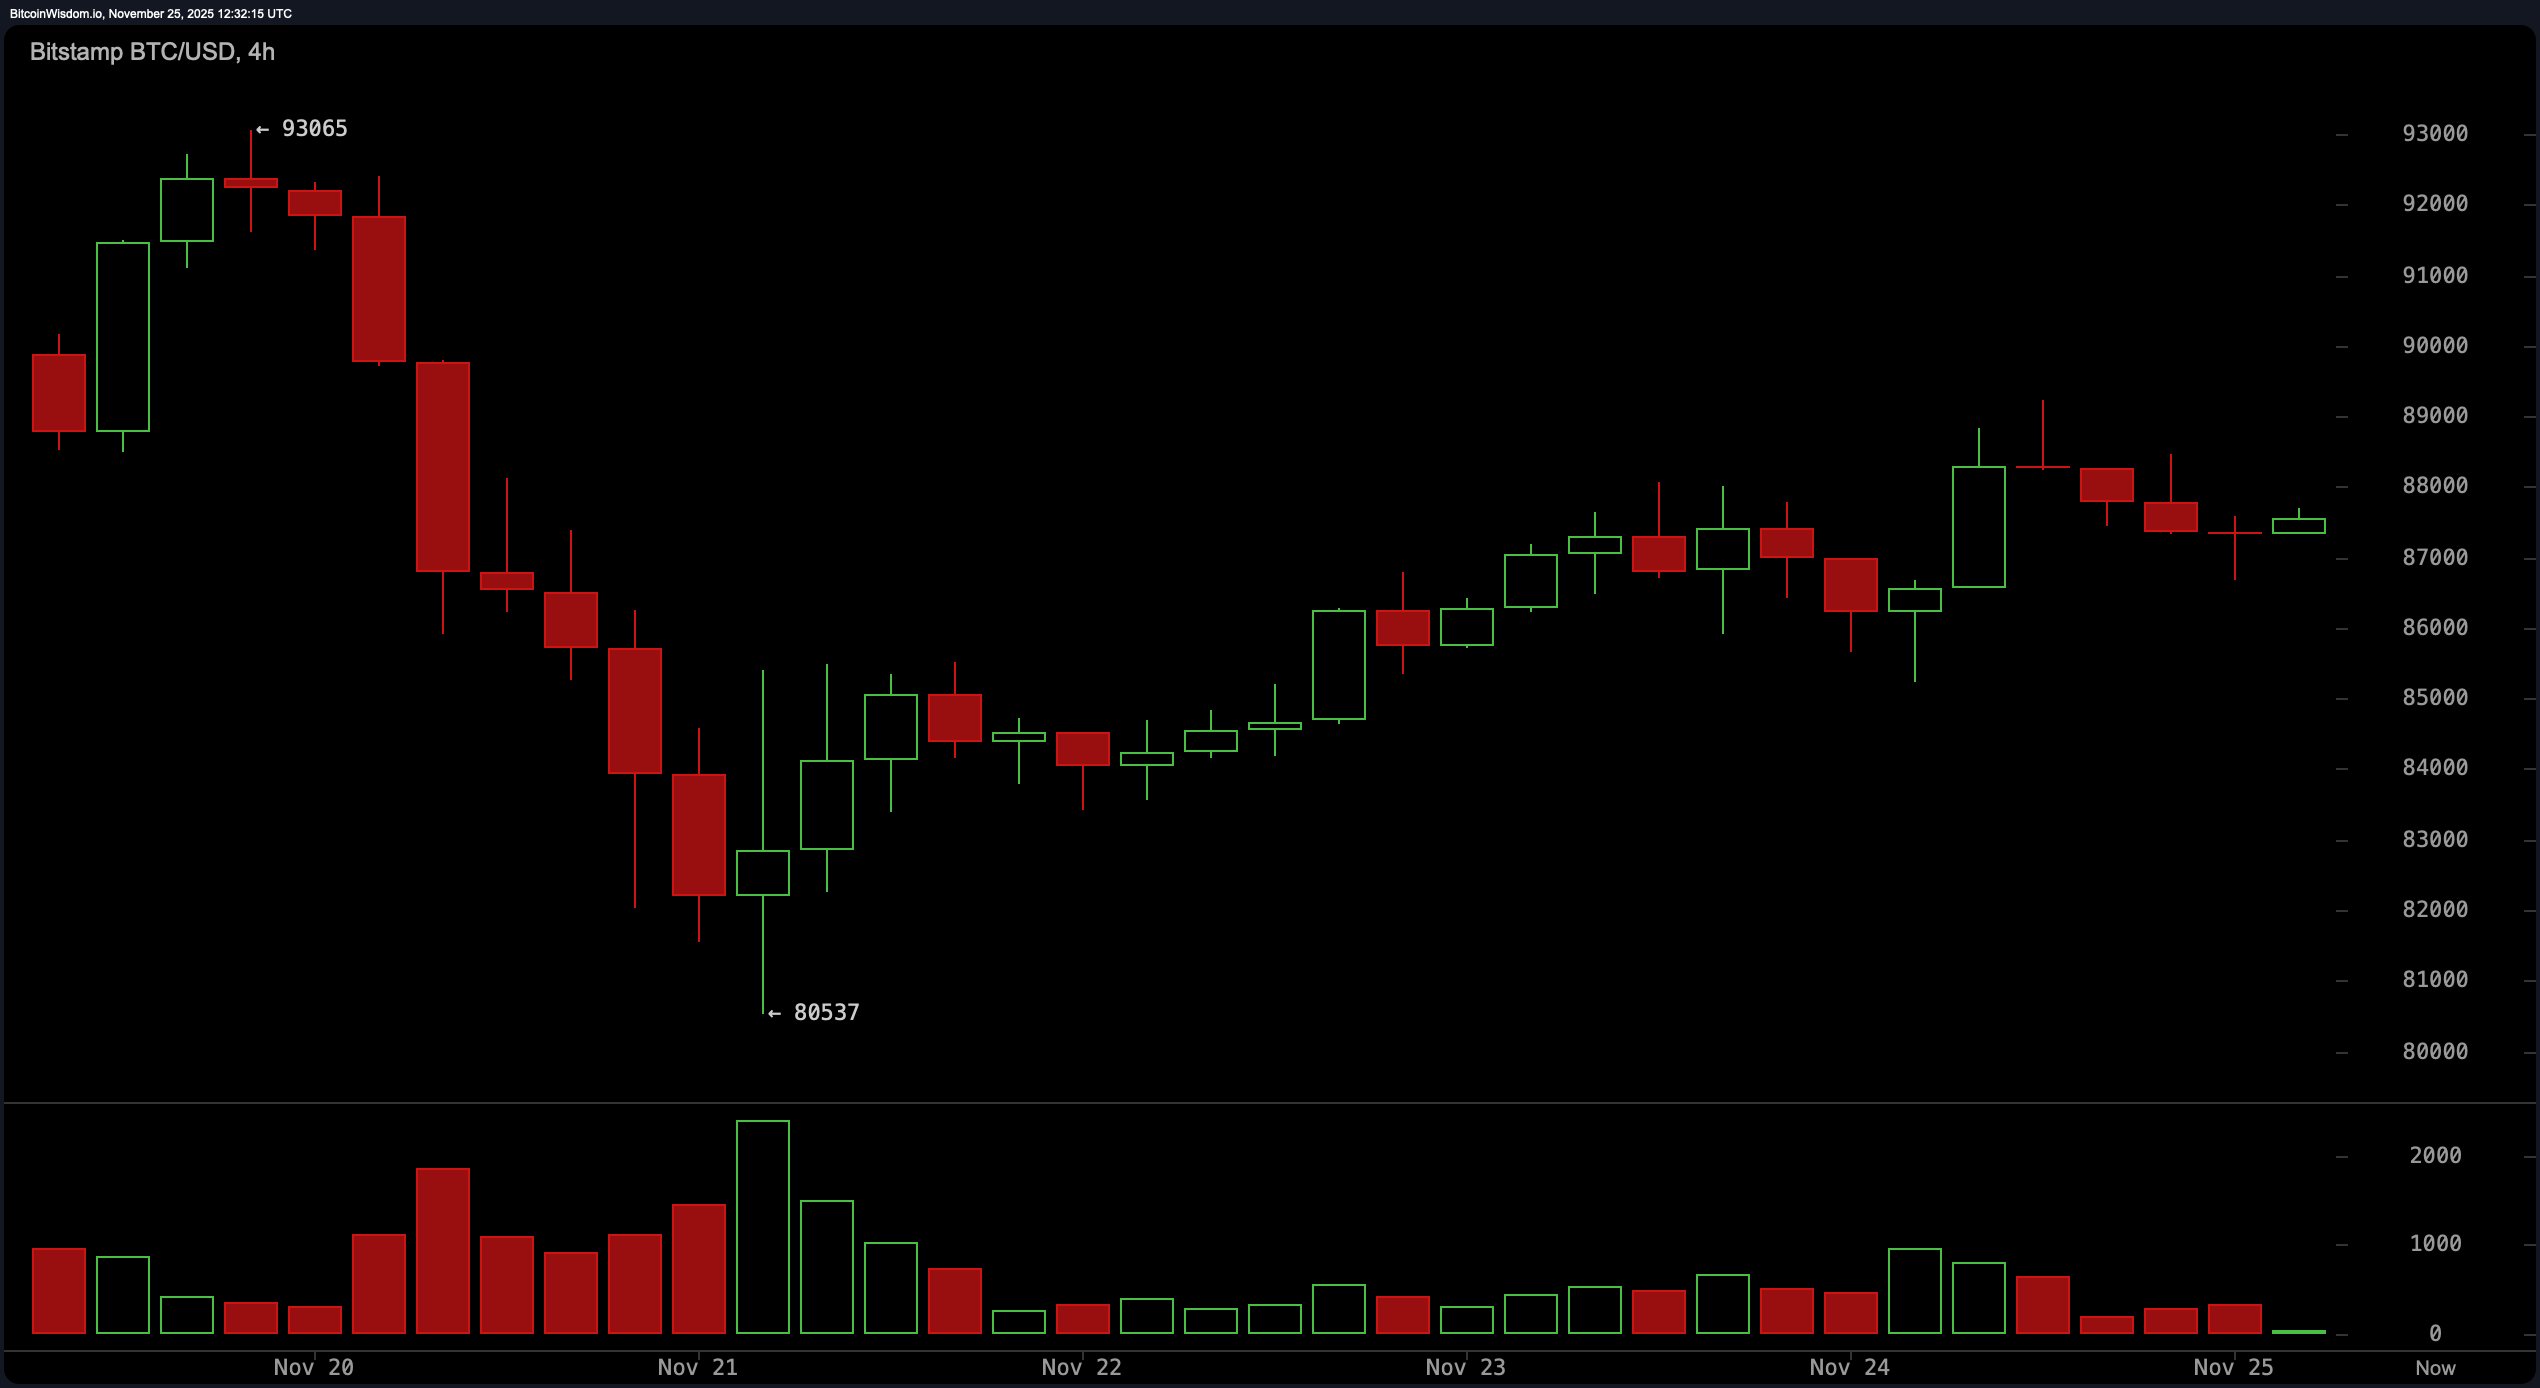
The 4-hour chart paints a slightly more optimistic picture. Since bouncing from its local low near $80,500, bitcoin carved a modest short-term uptrend, now consolidating between $85,500 and the $88,500–$89,000 resistance zone. The uptick in volume between November 21 and 23 hinted at buyer curiosity, but that enthusiasm is fizzling—volume’s now slipping as price coils below resistance. If it’s a bull flag, the breakout could be spicy. But if buyers hit snooze again, we may be back to whimpering below $85,000.
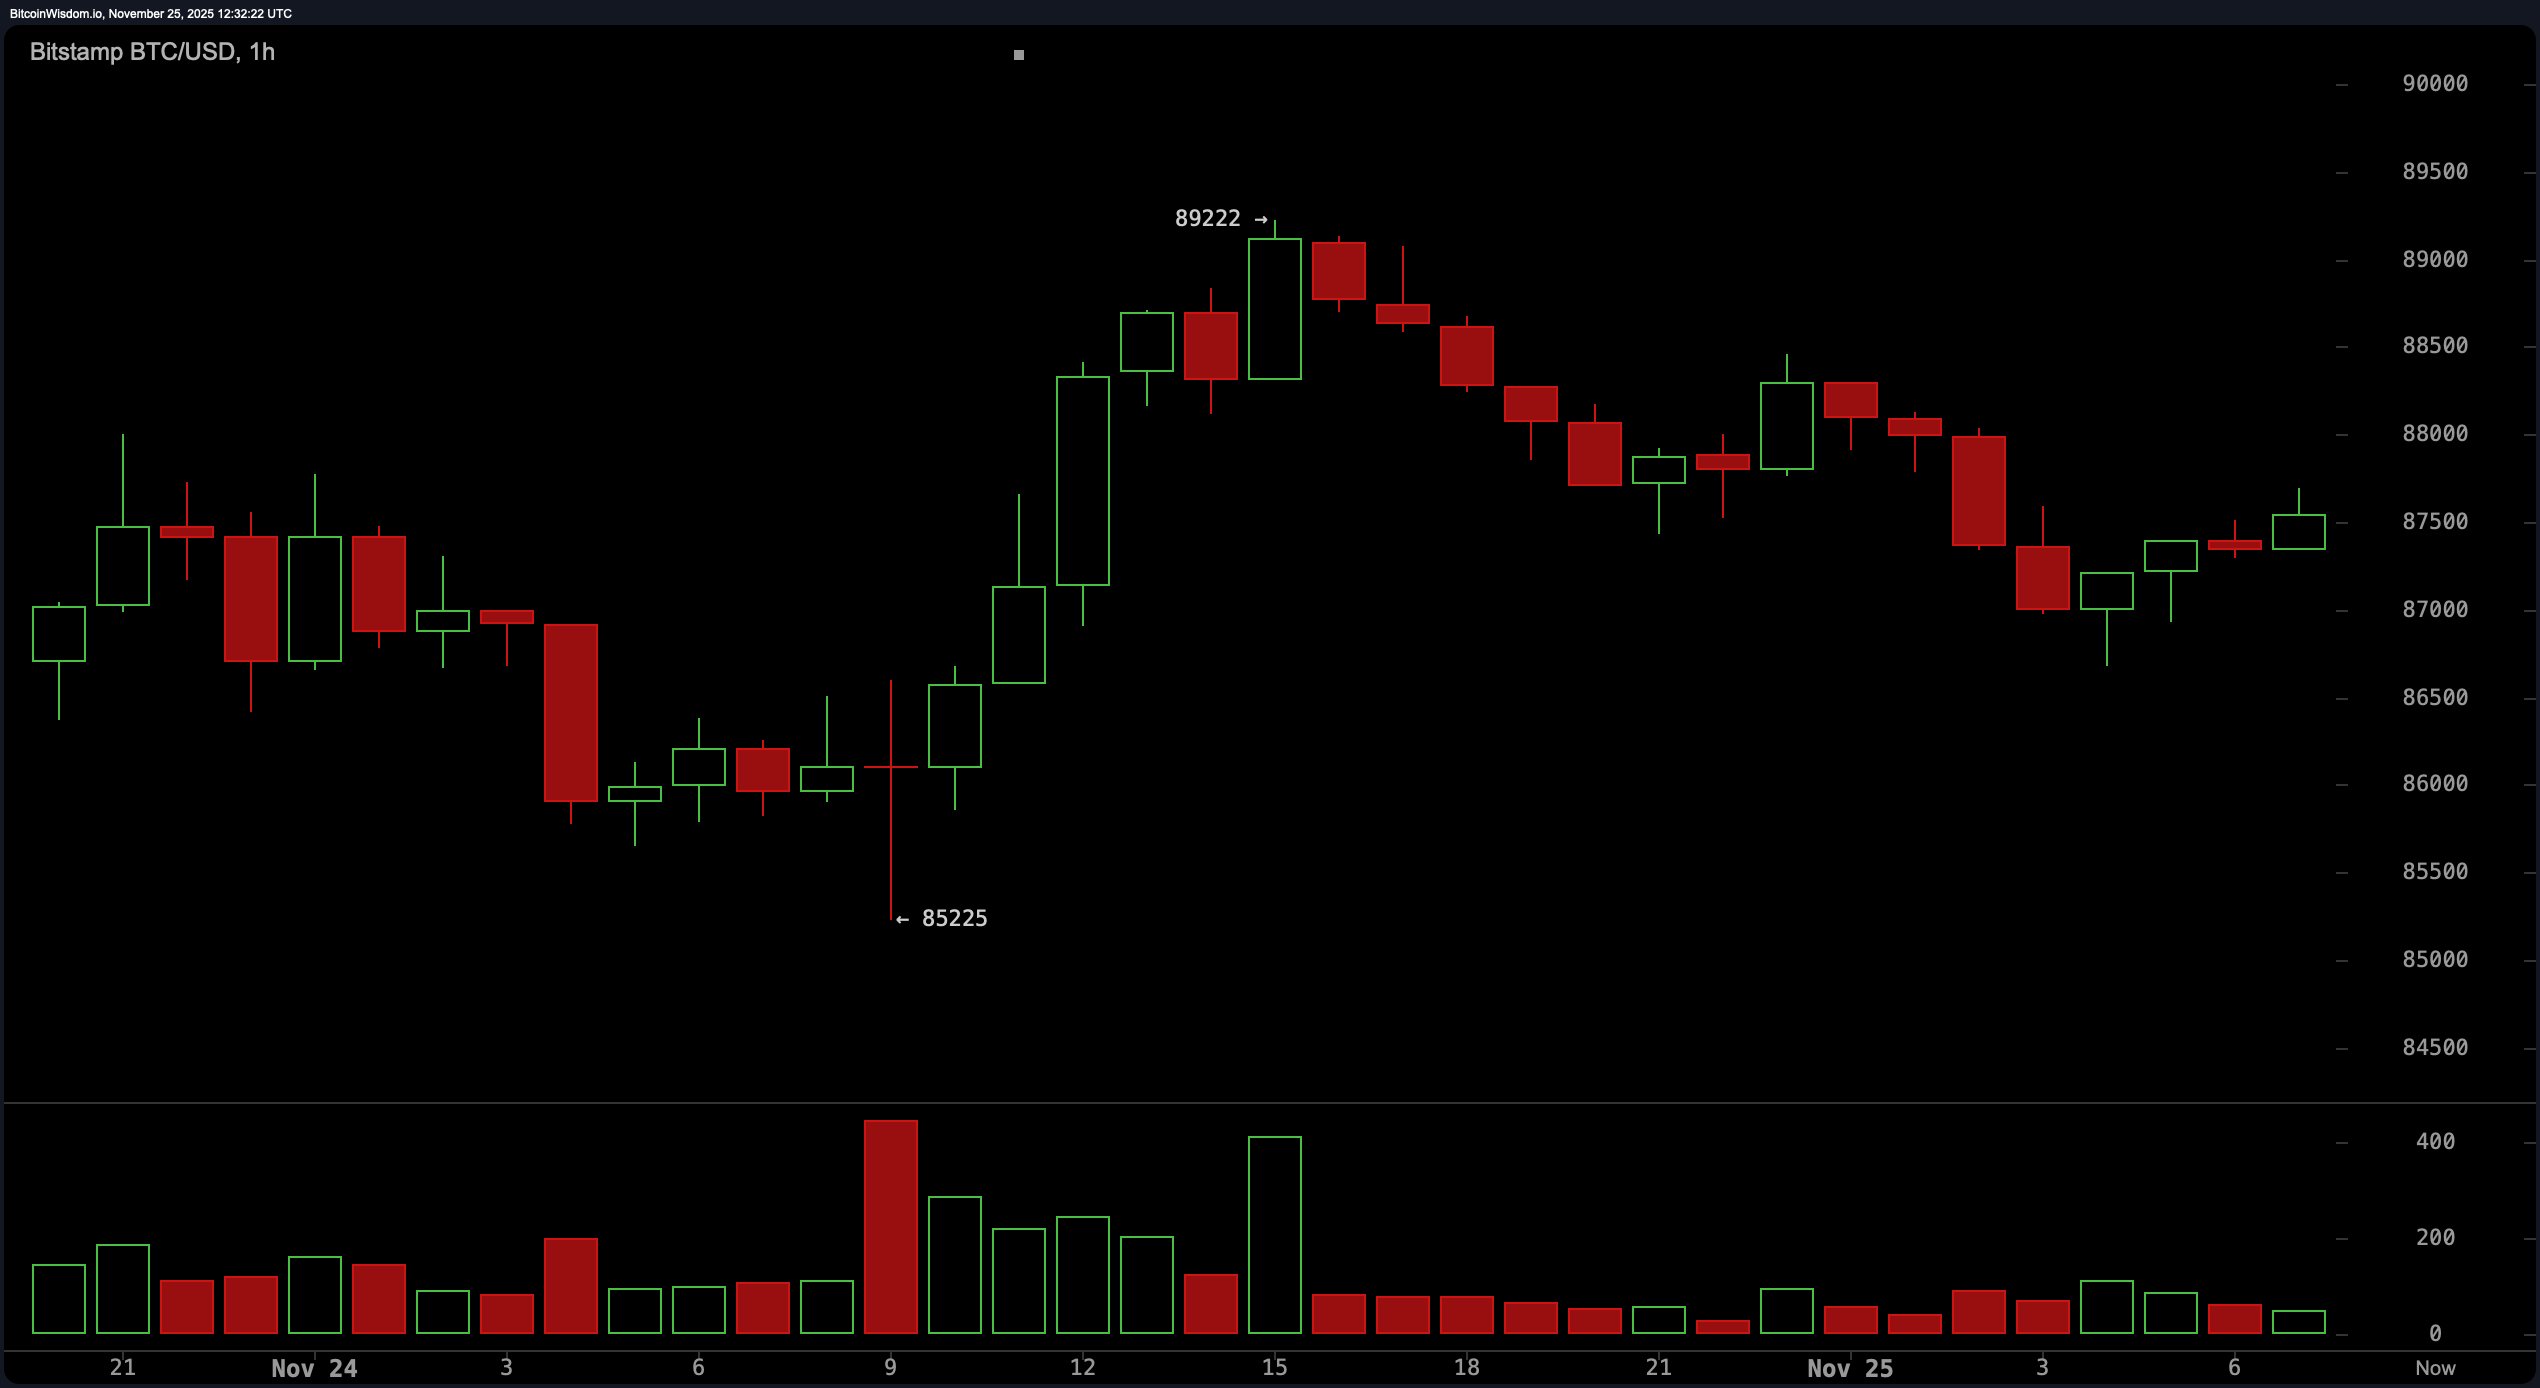
Zooming into the 1-hour timeframe, bitcoin’s showing off with higher highs and higher lows, recovering neatly from a dip around $85,200. Short-term support is pegged at $87,000, with resistance shadowing recent highs near $89,200. Volume here, however, is doing its best disappearing act—down significantly from the burst seen around November 21. This could mean consolidation before a pop, or just a tired market running on fumes. Price holding $87,000 is crucial; break that, and the party might be over before it starts.
Oscillators are as indecisive as a caffeine-deprived day trader. The relative strength index (RSI) at 32, the Stochastic at 27, and the commodity channel index (CCI) at -81 all flash neutral. Average directional index (ADX) at 46 suggests a strong trend is in place—though it doesn’t say which way the wind’s blowing. Meanwhile, momentum (-7,944) and moving average convergence divergence (MACD) level (-5,599) clearly lean negative, showing downward force hasn’t completely left the building.
The moving averages are rolling out the red carpet for the bears, with all ten indicators—ranging from the 10-period exponential moving average (EMA) at 89,603 to the 200-period simple moving average (SMA) at 110,060—positioned above the current price. That’s not just a ceiling, that’s a penthouse full of rejection. Unless bitcoin decides to sprint past those layers of resistance, any upward effort might end up in a whimper.
Bull Verdict:
If bitcoin can decisively break above the $89,000–$90,000 resistance with strong volume, there’s potential for a short-term trend reversal. Momentum on lower timeframes supports a cautious upside scenario, but any bullish thesis hinges entirely on holding $87,000 and building strength above it.
Bear Verdict:
With all major moving averages stacked ominously above price and momentum indicators still pointing downward, the broader trend remains bearish. Unless bitcoin can reclaim the $90,000 level convincingly, the recent bounce risks becoming just another lower high in a longer-term downtrend.
FAQ ❓
- What is bitcoin’s price today? Bitcoin is trading at $87,647 as of November 13, 2025.
- What’s the market cap and volume for bitcoin?Market cap is $1.74 trillion with $19.95 billion in 24-hour trading volume.
- Is bitcoin in an uptrend or downtrend?It’s consolidating short-term, but the broader trend remains bearish.
- What key levels should traders watch?$90,000 is the major resistance; $85,000 is critical support.