
The current Bitcoin pullback is closely tracking the same rising-channel breakdown pattern that preceded the 2022 downturn.
Currently, Bitcoin trades at $86,301, down 0.5% over the past day and increasing its weekly loss to 9.6%. This downturn has extended its loss over the past month to 23%.
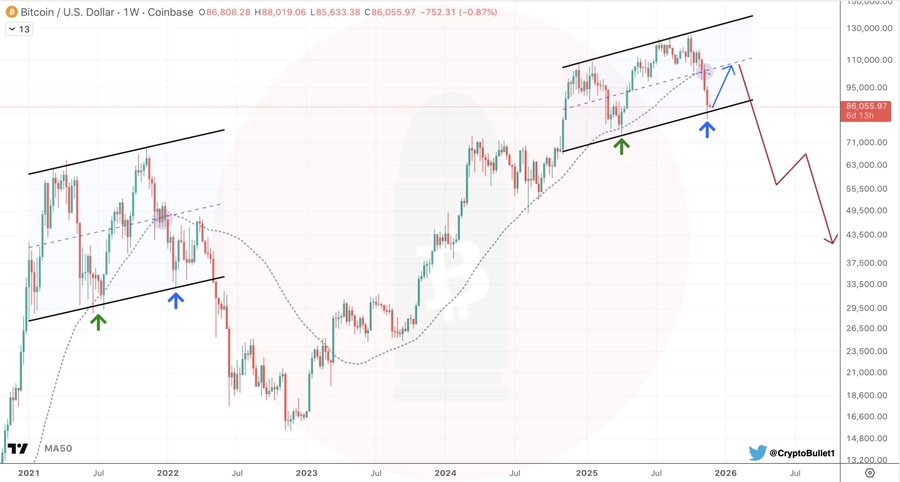
Now, a chart shared by analyst CryptoBullet suggests that Bitcoin is once again trading inside a rising channel similar to the one seen from late 2021 through mid-2022. That earlier channel eventually broke down, leading to a prolonged correction that carried prices toward the $15,000 region.
CryptoBullet captioned the comparison “Déjà vu all over again,” highlighting how the current setup tracks the earlier cycle.
A Look Back at the 2021–2022 Bitcoin Breakdown
In the first cycle, Bitcoin price traded consistently within an upward channel from January 2021 to November 2021. It saw prices rise above $64,000 in April and $68,000 in November 2021 before the bear market set in. Bitcoin price then slipped toward the lower trendline at $33,500, which initially held as support throughout mid-2021.
However, that stability faded in 2022 as Bitcoin dropped below its 50-week moving average, an early signal that the trend was weakening. Once support gave way, the decline accelerated into late 2022, ultimately sending BTC toward $15,000.
A Nearly Identical Channel in the Current Cycle
According to the chart, Bitcoin’s price action in 2025 is unfolding in a nearly identical channel. BTC reached the upper boundary of this range in October, when it hit an all-time high above $126,000, before the current sharp reversal.
It is now testing the lower boundary again, below $86,000, where it has also fallen below the 50-week moving average, another similarity to the pre-2022 setup.
The chart also outlines potential scenarios: a rebound toward the mid-channel region around $100,000–$110,000, or a deeper breakdown if support fails. A decisive move below the current range could expose downside targets at $63,000 and $43,500, highlighted in the chart with red arrows.
Déjà vu all over again 🧐#Bitcoin $BTC pic.twitter.com/KejDMmlfXW
— CryptoBullet (@CryptoBullet1) November 24, 2025
What Other Analysts Expect Next
Multiple analysts have presented their interpretations of the recent pullback. Vivek Sen noted that Bitcoin has now completed a typical 30% correction into the 0.618 Fibonacci retracement area around $89,000, with the RSI revisiting a zone that has historically marked bottoms.
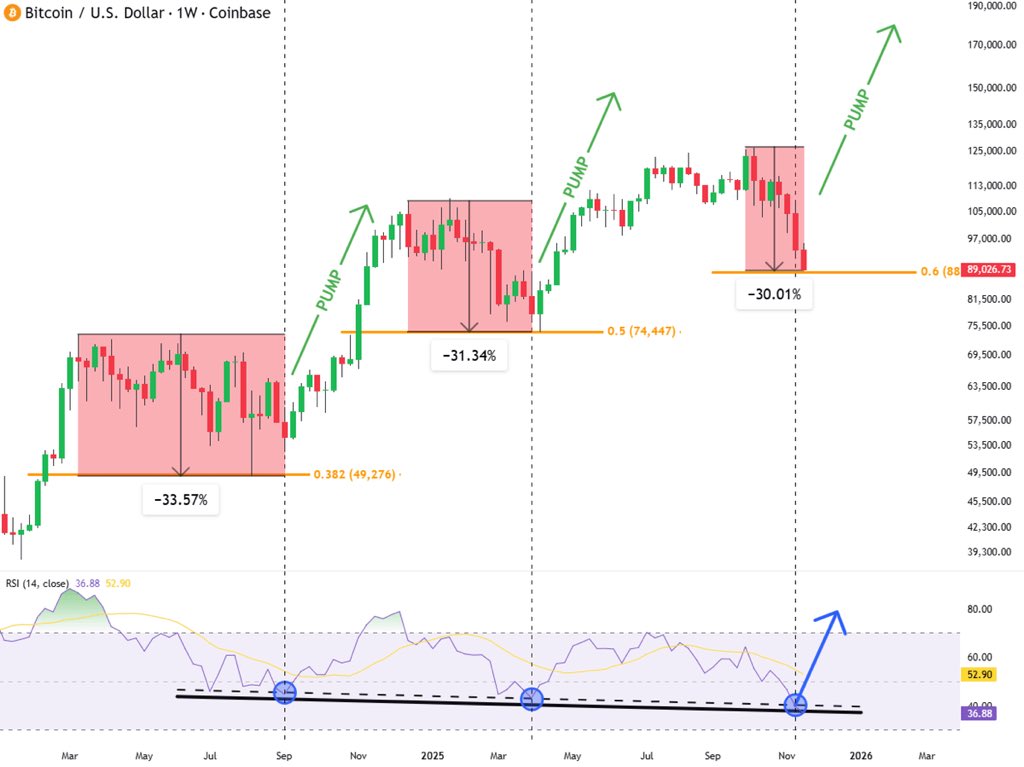
Calling the setup “Bitcoin is about to go parabolic,” he suggests a strong rebound may follow if the pattern repeats.
Short-term Holders Selling at Loss
Meanwhile, data from CryptoQuant shows short-term BTC holders are selling at a loss once again. Analyst Crypto Dan adds that the dip resembles previous corrective lows and could signal either the end of the pullback or the beginning of a deeper slide.
While he does not expect a severe 70% crash, he warns that losing the $80,000 level would increase downside risk. Bitcoin currently sits about 32% below its early-October all-time high after a weekly drop of nearly 10%.
Elsewhere, analyst Captain Faibik observes that Bitcoin remains trapped below a key resistance area. A confirmed breakout, he says, could produce a 10%–12% move toward roughly $96,541.
Meanwhile, CryptoQuant highlights the broader market environment as the most bearish since January 2023, citing weak institutional inflows and a Bull Score Index of 20, with the current cycle potentially stretching into 2026.