
Bitcoin trades above $86.8K with weekly sell signals as traders watch for a possible rebound or deeper downside.
Notably, Bitcoin is currently priced at about $86,864, down 8.7% over the past seven days. The 7-day chart shows a clear downswing from levels near $95,000 around November 17 to a low close to $80,000 before a modest rebound, leaving the asset hovering in the mid-$86,000 band.
Its market cap stands around $1.73 trillion, up 1.31% in the last 24 hours. Meanwhile, the performance charts show a 1.3% advance over the last 24 hours, yet longer windows remain under pressure, with declines of 18.2% over two weeks, and 22.0% across the past month. This performance has left traders and watchers peeled to see if BTC can advance further or experience more resistance.
Bitcoin Price Analysis
Looking at technical charts, the weekly Bitcoin chart shows key indicators turning against the prior uptrend. The Supertrend is on a sell signal around $116,600, with price now trading far below that level. This shift means the green support band that had been tracking the rally has now turned into a red resistance zone, signaling that bullish control on the higher time frame is lost.

The distance between current price and the Supertrend line also underlines the strength of the recent breakdown. Any rebound toward the mid-$90,000 to low-$100,000 area may encounter heavy technical resistance.
Meanwhile, momentum readings confirm this deterioration. The Chande Momentum Oscillator (9-period) has slipped to roughly -42.5, firmly in negative territory after spending much of the prior advance above the zero line.
Notably, this move below zero reflects a clear change from accumulation to distribution, with sellers dominating weekly flows. While such deeply negative momentum can sometimes precede short-term relief bounces, the indicator currently supports the Supertrend’s bearish signal.
A 10-12% Rally This Week?
Elsewhere, another chart shared by Captain Faibik shows Bitcoin locked under a downward-sloping resistance trendline on the 1-hour BTC/USDT chart. Price action has been making lower highs along this line, and the latest bounce has brought BTC back to retest this trendline. In his view, bulls have not yet broken this structure.
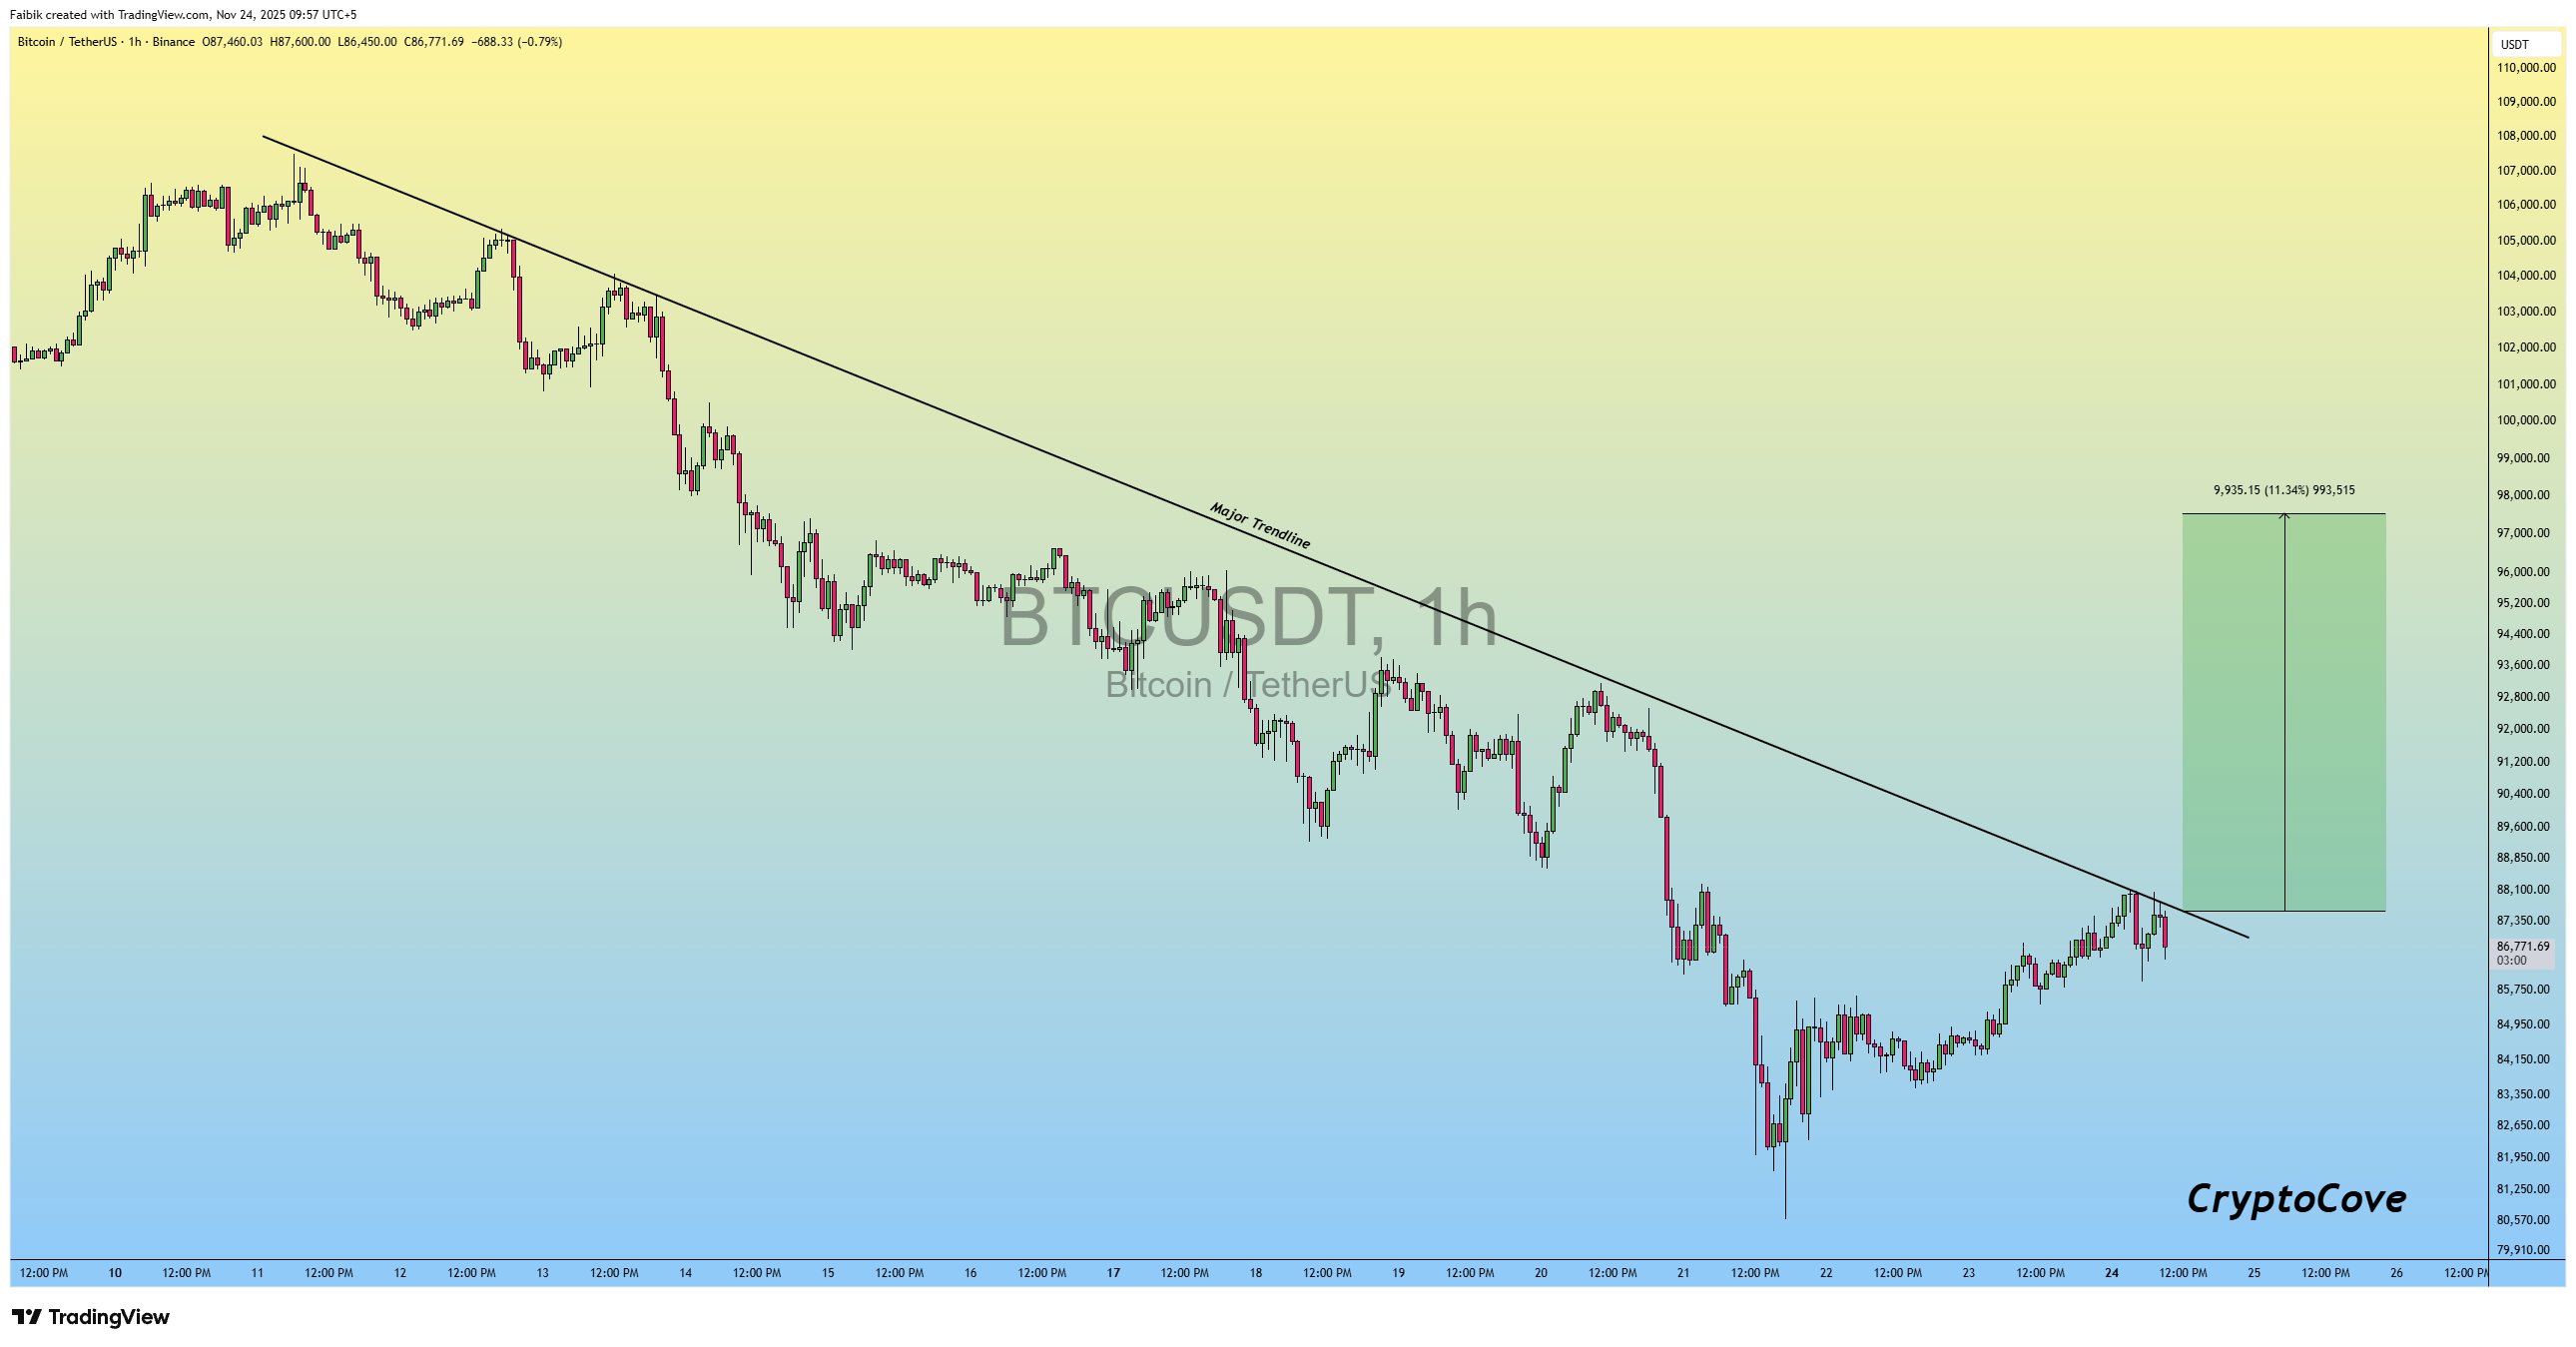
The analyst states that a reclaim of this trendline by buyers would be an important trigger. The green projection box on the chart outlines his upside scenario, where a successful breakout could open room for an advance of roughly 10%–12% from current levels. A 11.14% surge from the current price of $86,864 could take BTC to $96,541.