
This is a daily analysis by CoinDesk analyst and Chartered Market Technician Omkar Godbole.
Bitcoin
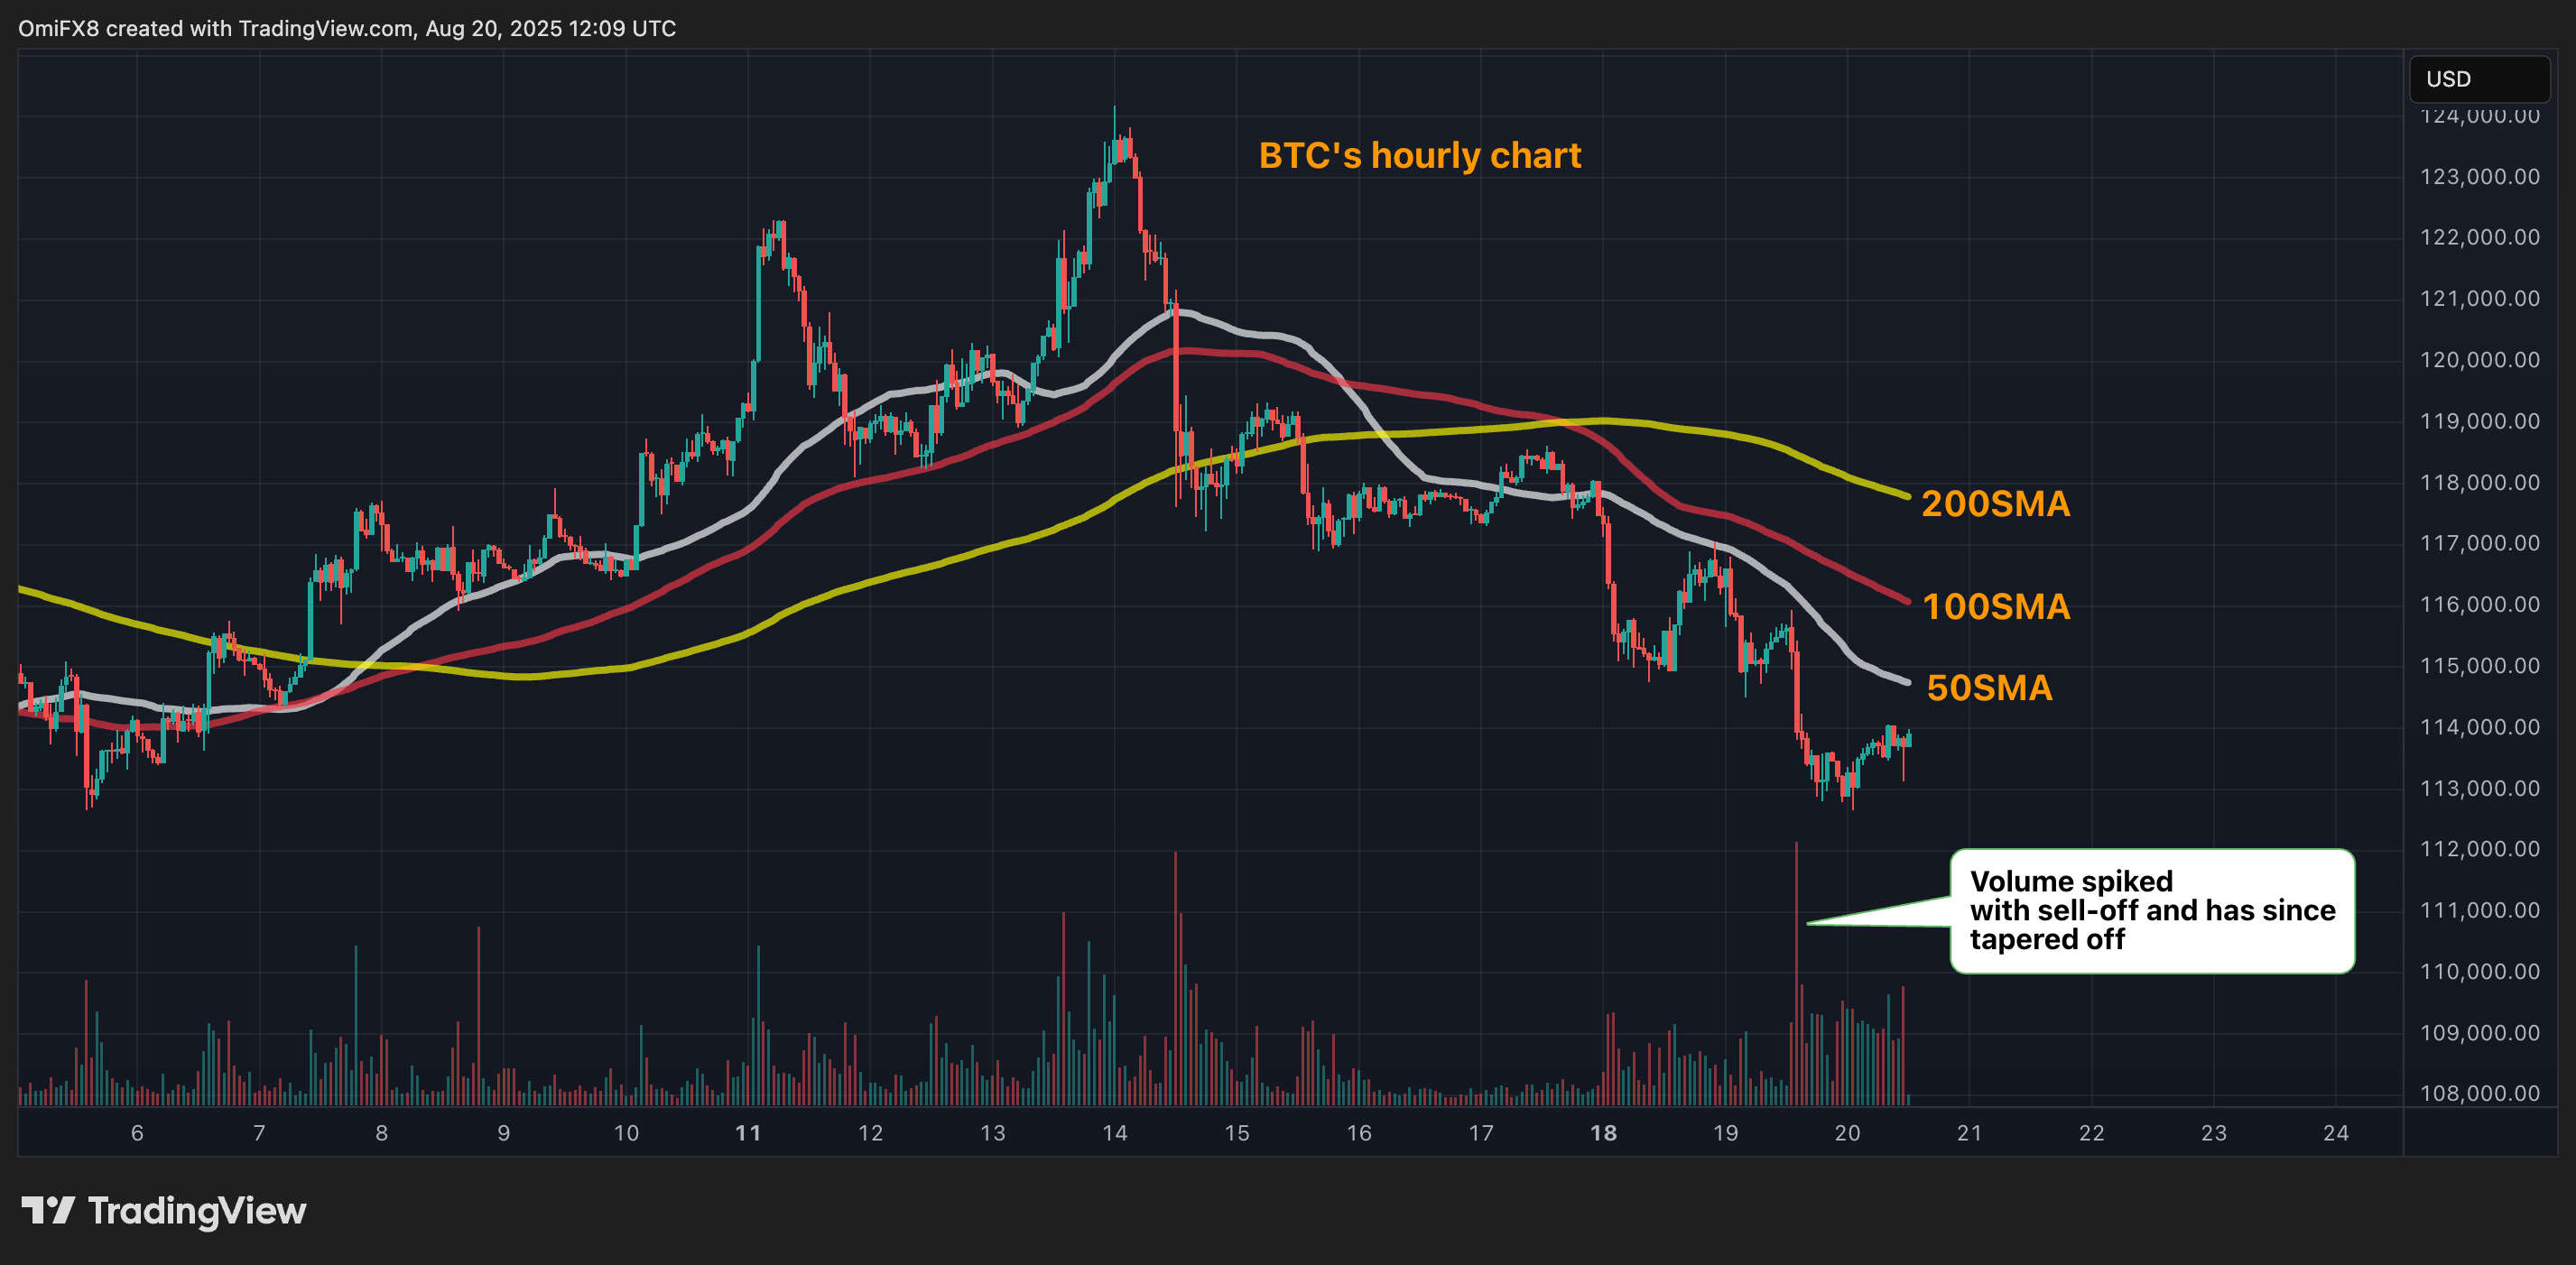
The weak bounce is consistent with bearish momentum signals, as the 50-, 100-, and 200-hour simple moving averages (SMAs) are aligned in descending order and trending downward.
On the daily chart, prices have convincingly broken below the rising trendline support, signaling a shift from bullish to bearish momentum. Both the longer-term MACD histogram (50,100,9) and the more commonly used MACD (12,26,0) are showing increasing negative momentum, with deeper bars below the zero line.
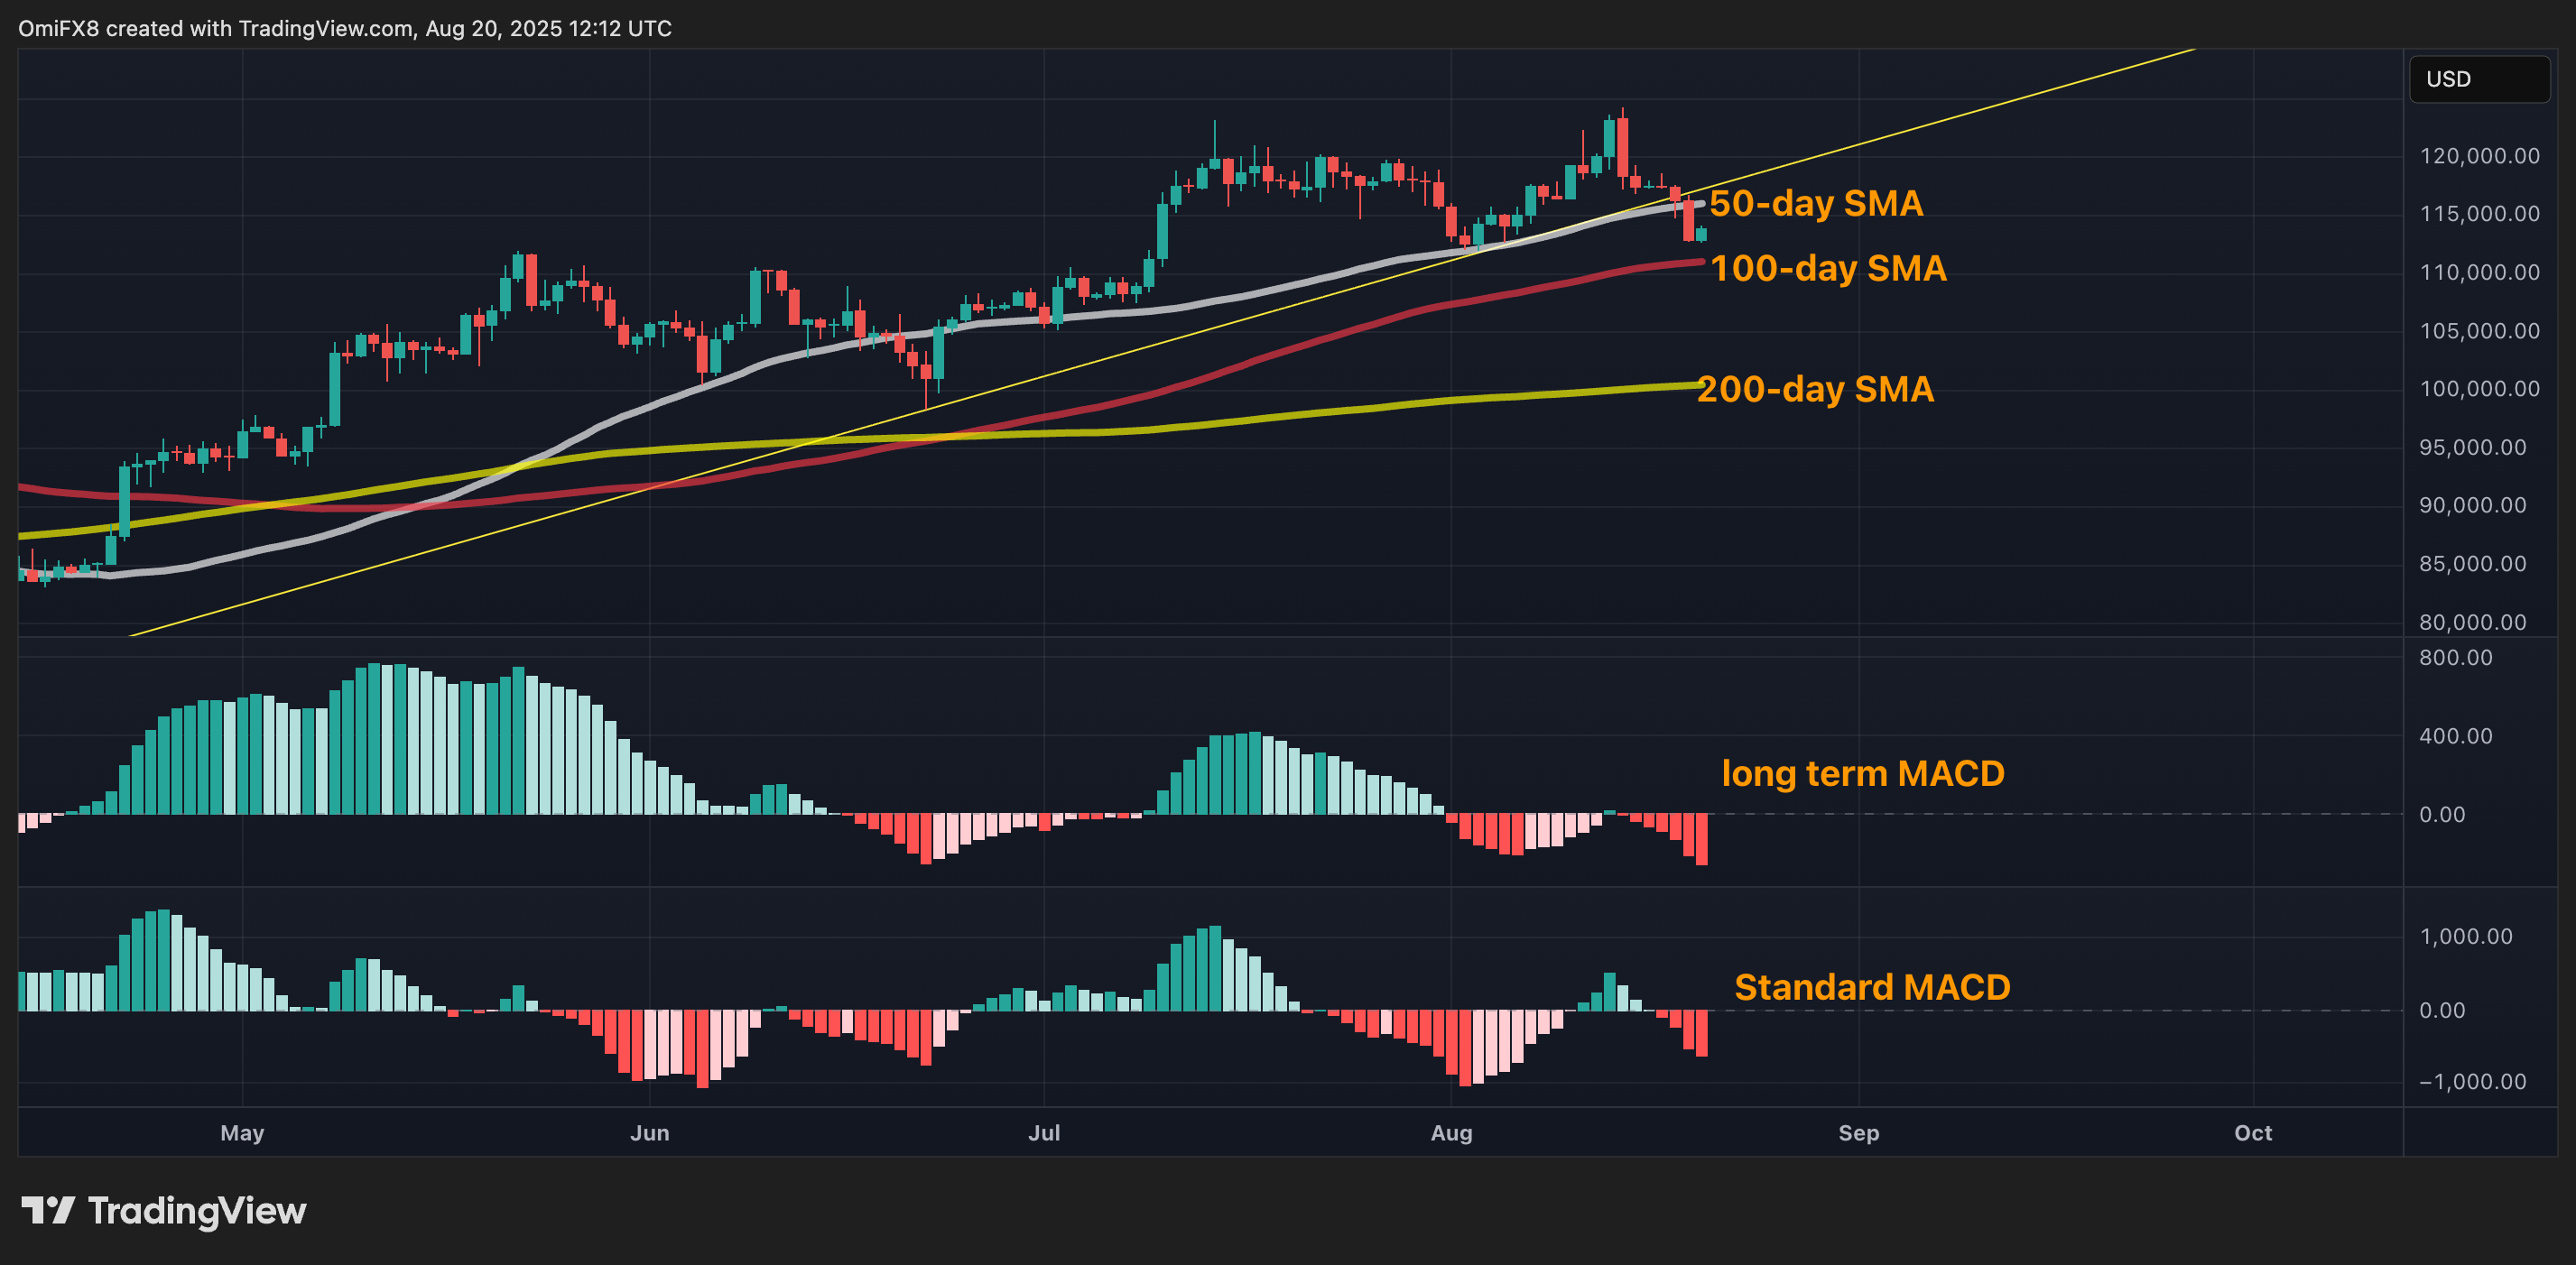
Therefore, the odds appear to be stacked in favor of a continued move lower. The first level of support is $11,982, from which the market turned higher on Aug. 3. The 100-day SMA is seen at $11,053. If these levels are taken out, the focus would shift to the 200-day SMA at $100,484.
A convincing move above the 50-day SMA at $116,033 would negate the bearish outlook.
- Resistance: $116,033, $120,000, $122,056.
- Support: $111,982, $110,053, $100,484.
Read more: Markets Today: Bitcoin, Ether Recover From Lows Before FOMC Minutes