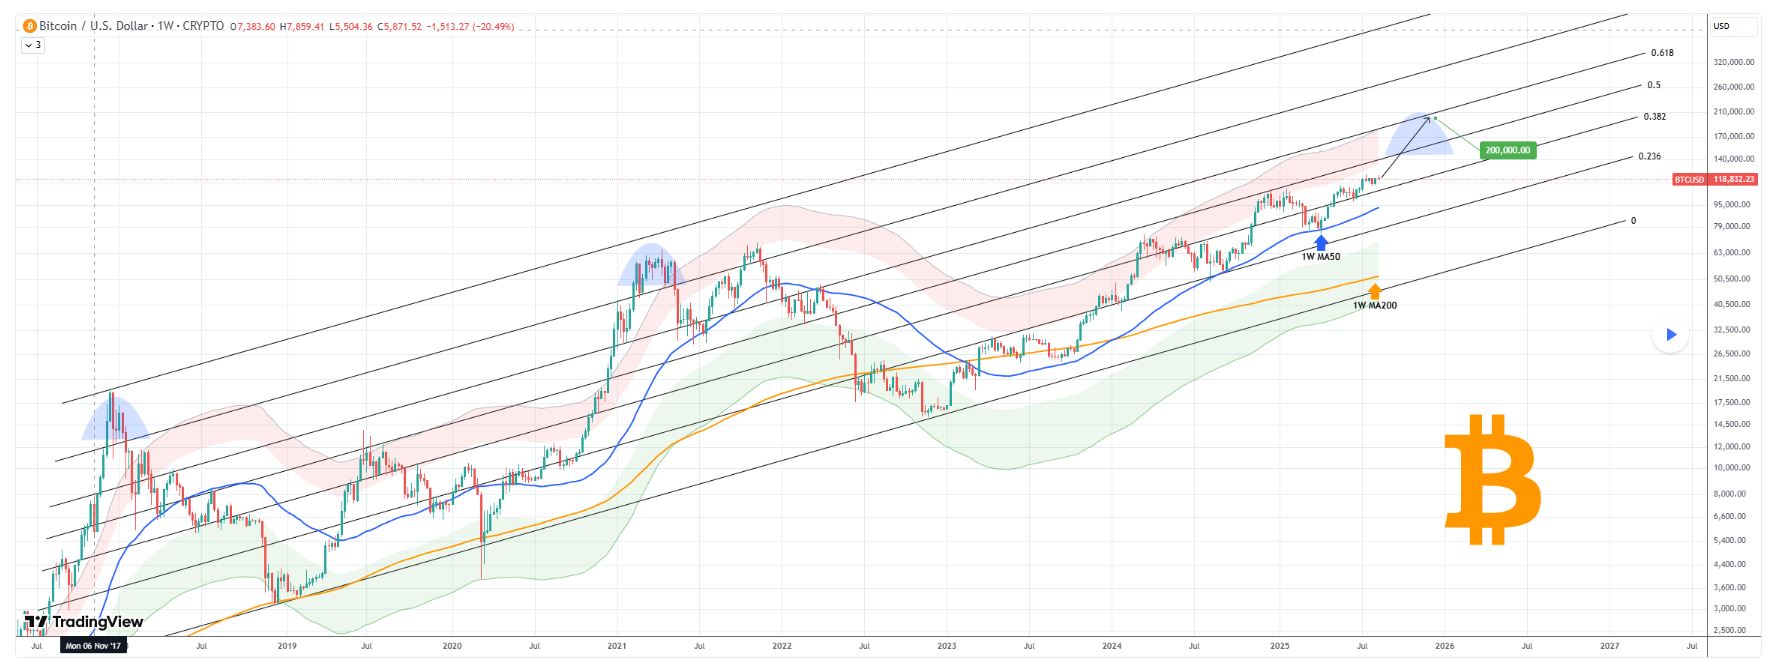
Historically, this 0.5 Fib level has been a formidable resistance zone, last rejecting Bitcoin on December 16, 2024, and acting as a ceiling since May 2022.
Despite this, previous cycle tops have not only broken above the 0.5 Fib but also reached levels above the 0.786 Fibonacci mark, nearing the channel’s upper boundary.
A break above the 0.5 Fib could send Bitcoin toward the 0.618 level, potentially testing $200,000 near the next cycle peak later this year. This would place it in the upper red zone of the Mayer Multiple Bands, still within historical norms, with late 2025 likely to be pivotal for price discovery.
Bitcoin key support zones to watch
Meanwhile, as Bitcoin eyes a new record high, trading expert Ali Martinez has pointed to Glassnode’s UTXO Realized Price Distribution (URPD) data showing two key support zones anchoring its price: $118,163 and $116,934, where large volumes of $BTC last changed hands.
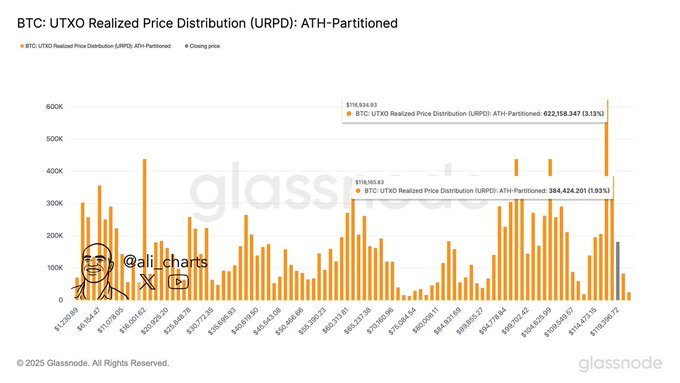
Based on his August 12 data, 384,424 $BTC (1.83% of supply) were acquired near $118,163, while 622,158 $BTC (3.13% of supply) were bought around $116,934, creating strong technical and psychological floors that could cushion future pullbacks.
Bitcoin price analysis
By press time, Bitcoin was trading at $120, 920, up 2.3% in the last 24 hours and 6.6% on the weekly chart.
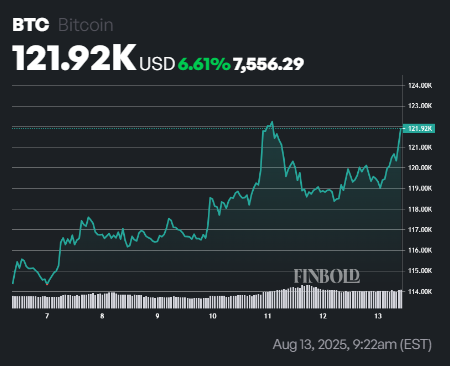
Indeed, Bitcoin is showing bullish sentiment, with technicals hinting at a possible push past $120,000. The asset is trading well above its 50-day Simple Moving Average (SMA) of $114,109 and 200-day SMA of $92,926, confirming a strong long-term uptrend. The shorter-term SMA also serves as a key support level.
At the same time, Bitcoin’s 14-day Relative Strength Index (RSI) stands at 59.57, suggesting moderate upward momentum without immediate signs of overheating.
Featured image via Shutterstock

 finbold.com