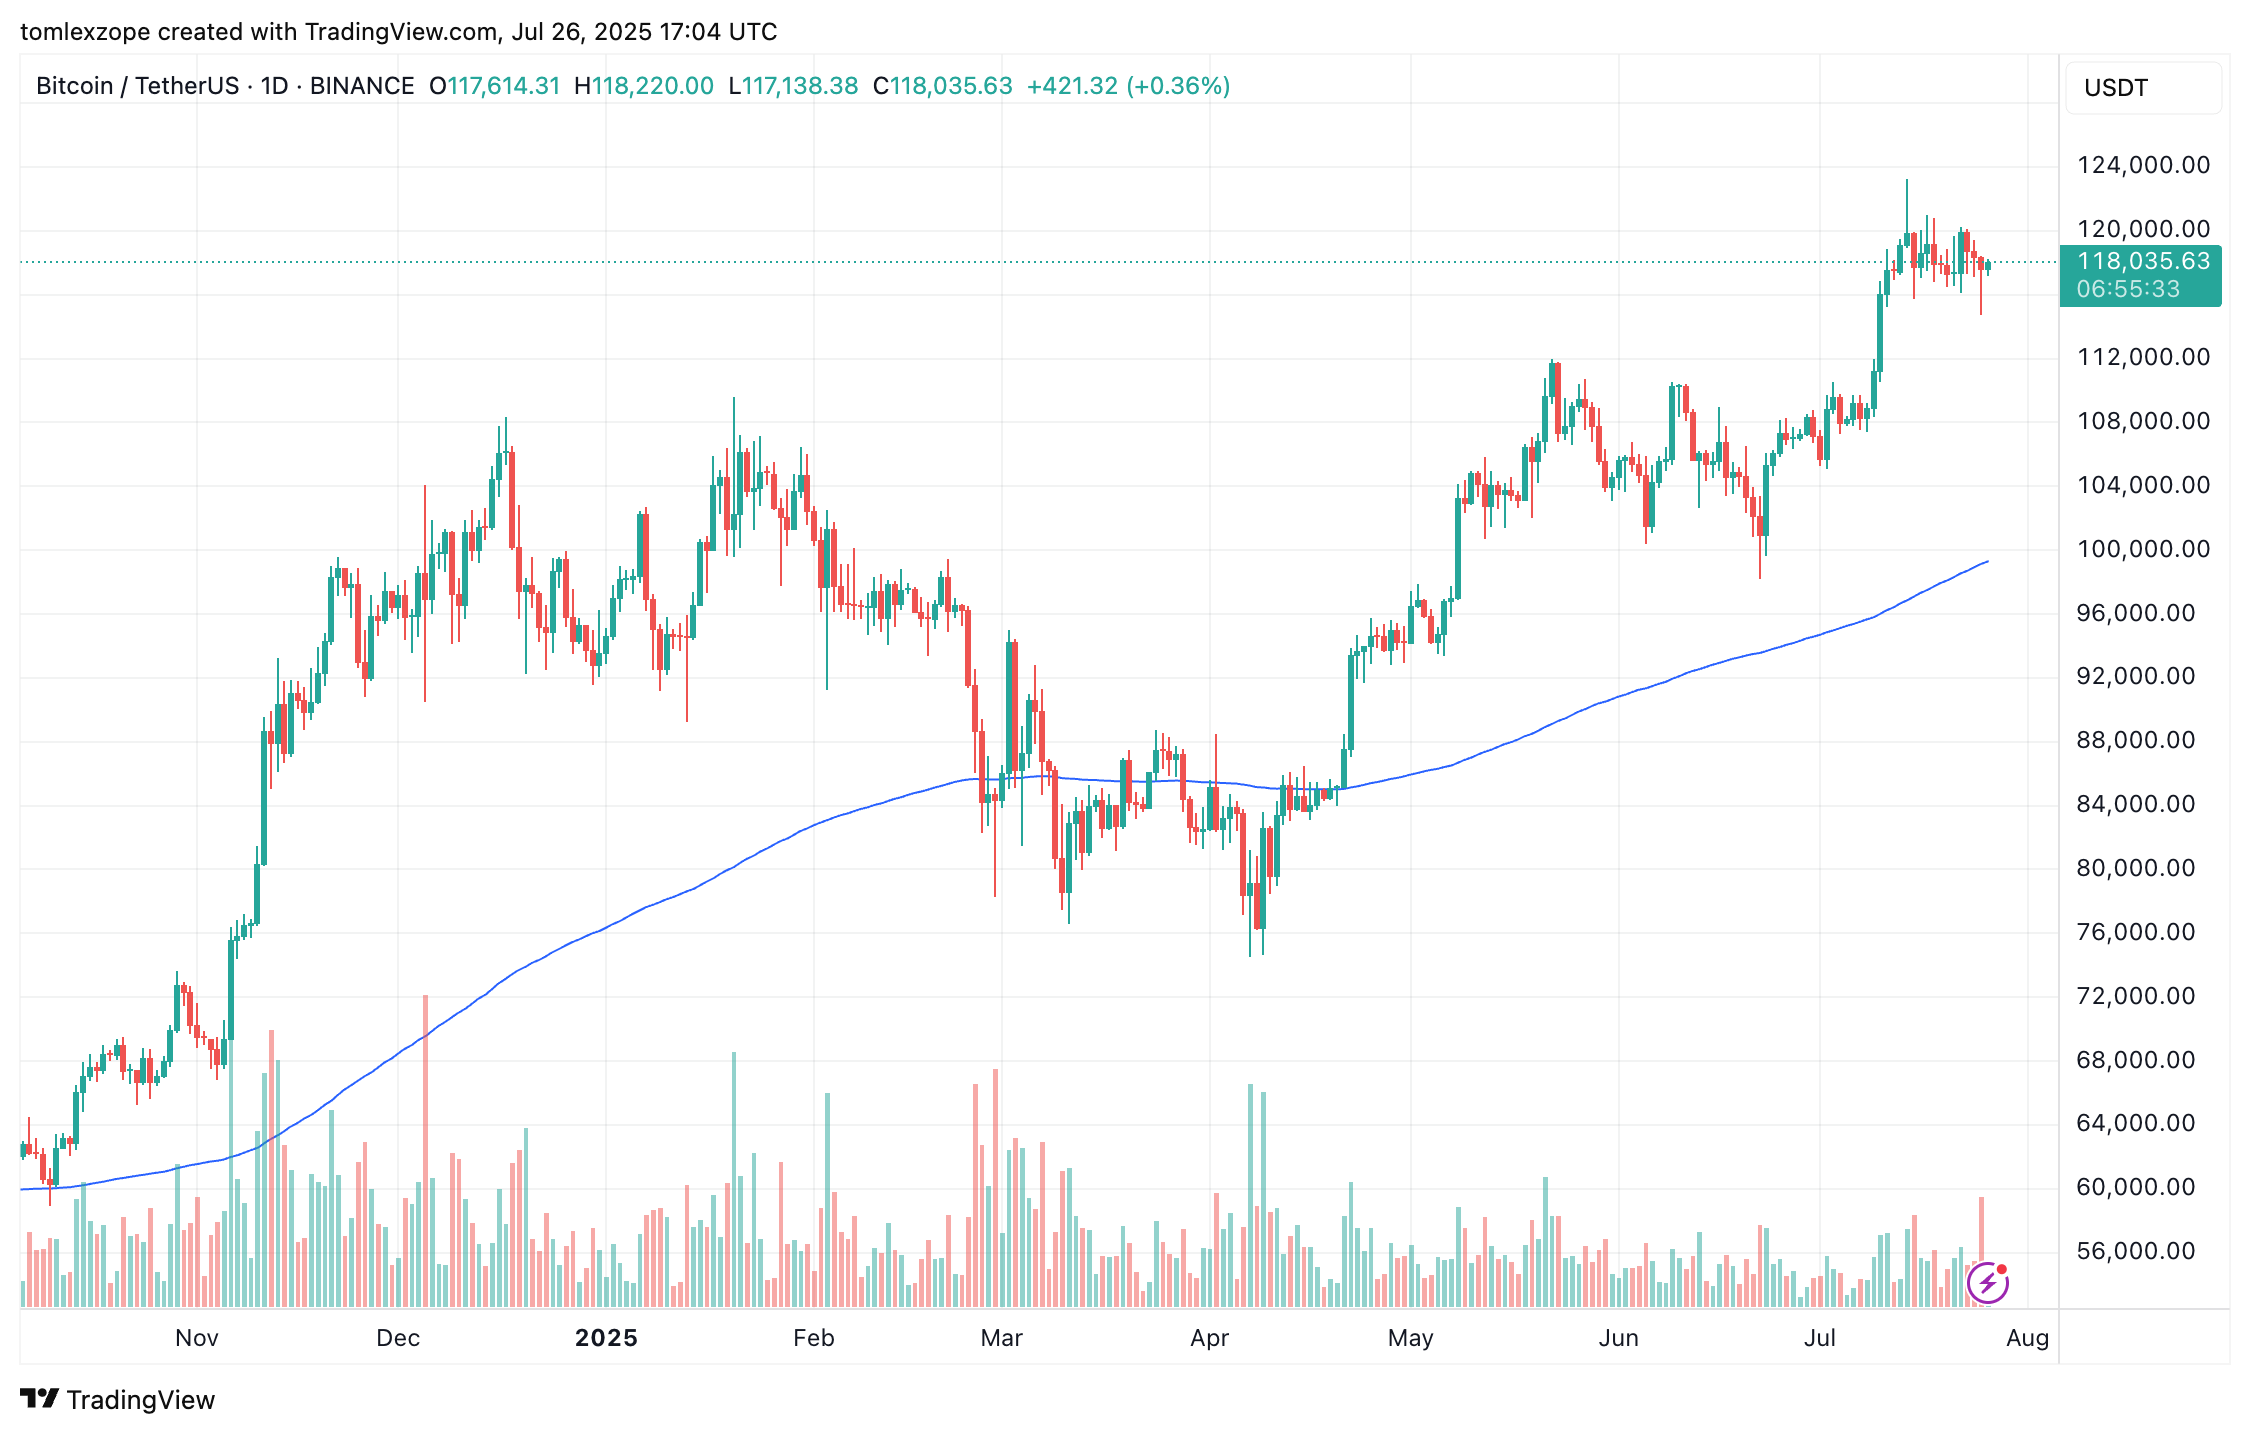
The Bitcoin price has been quite indecisive in its action over the past week, jumping between the $117,000 and $120,000 consolidation zone in that period. The flagship cryptocurrency, however, came tumbling toward the $115,000 mark following massive coin movements toward centralized exchanges in the past day.
Interestingly, a prominent market expert has put forward an even more bearish outlook for the Bitcoin price over the next few weeks. With this latest projection, the price of $BTC seems to only be at the beginning of a downward spiral, which could worsen over the coming days.
How $BTC Price Could Be At Risk Of Extended Decline
In a July 25 post on social media platform X, Chartered Market Technician (CMT) Aksel Kibar painted a bearish picture for the Bitcoin price after falling to $115,000 on Friday. According to the analyst, the flagship cryptocurrency could be on its way to around $109,000 in the coming days.
Kibar’s bearish stance revolves around the inverse head-and-shoulder pattern on the Bitcoin price chart on the weekly timeframe. The inverse head-and-shoulders pattern is a technical analysis formation characterized by three distinct price troughs, including a lower “head” set between two higher “shoulders.”
Typically, the inverse pattern signals a possible bullish breakout and is validated when the price breaches the neckline — a trendline connecting the crests (swing highs) between the head. As shown in the chart below, the Bitcoin price has already broken through the neckline to reach a new all-time high.
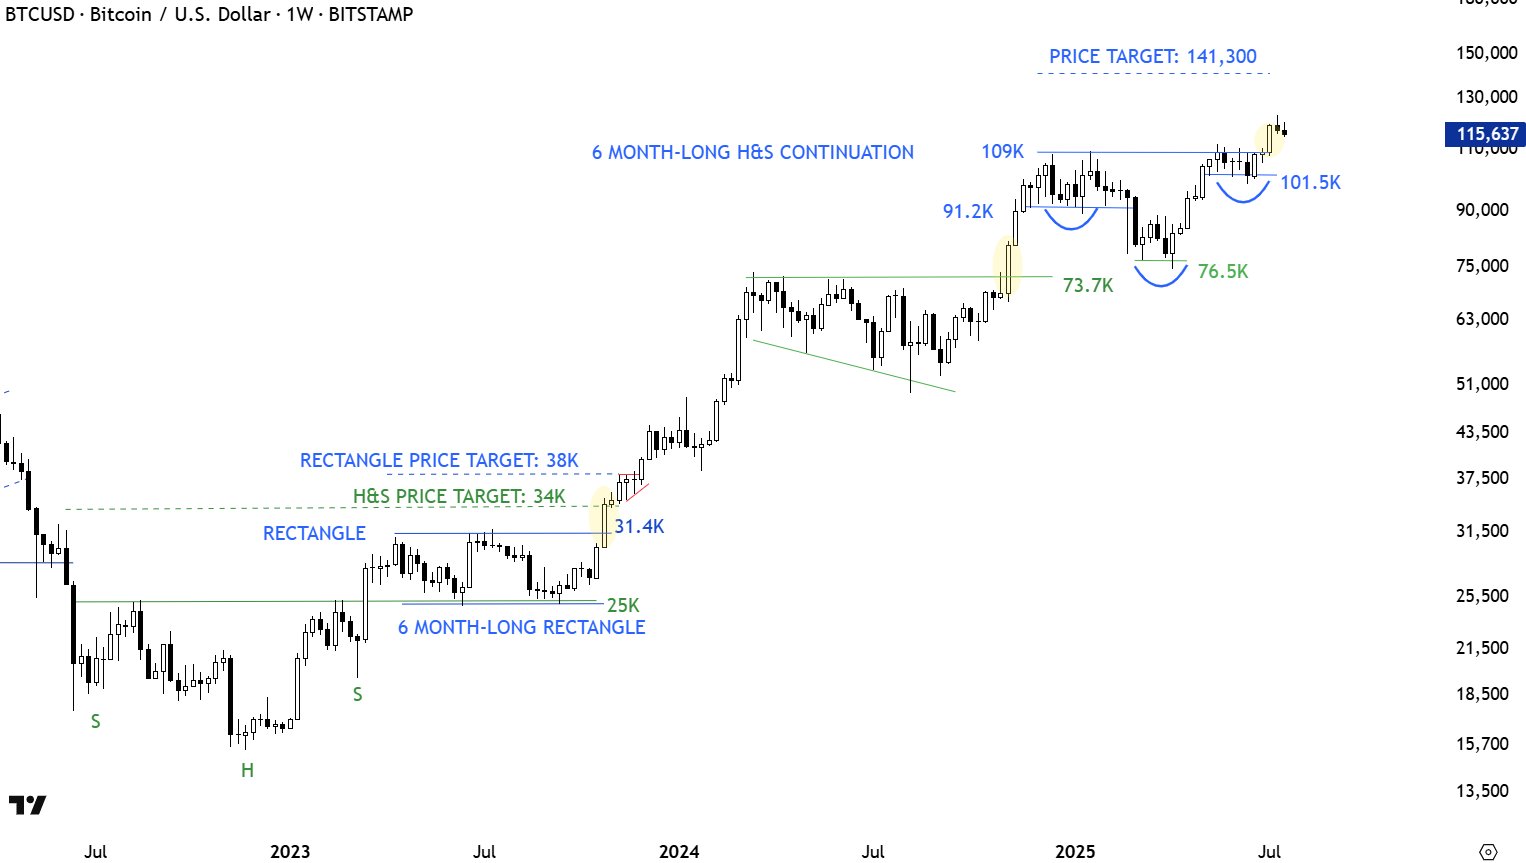
However, Kibar explained that the price breakout witnessed by Bitcoin might not be the textbook breakout typically expected in most inverse head-and-shoulders pattern scenarios. According to the market expert, most head-and-shoulder breakouts are followed by pullbacks and retests rather than straight rallies.
Chart data provided by the analyst shows that, since May 2017, the Bitcoin price has witnessed a retest or pullback (type 2 continuation) more times than a straight rally (type 1 continuation) after a head-and-shoulder pattern breakout. This trend explains the rationale behind Kibar’s bearish projection for $BTC in the next few days.
If the price of Bitcoin does suffer a deeper correction as in the type 2 continuation, it is likely to return to the neckline — and around the $109,000 mark. A move like this would represent an over 5% decline from the current price point.
Bitcoin Price At A Glance
After a horrendous start to the day, the market leader seems to be recovering nicely from its recent fall to $115,000. As of this writing, the price of $BTC stands at around $117,323, reflecting a mere 0.6% decline in the past 24 hours.