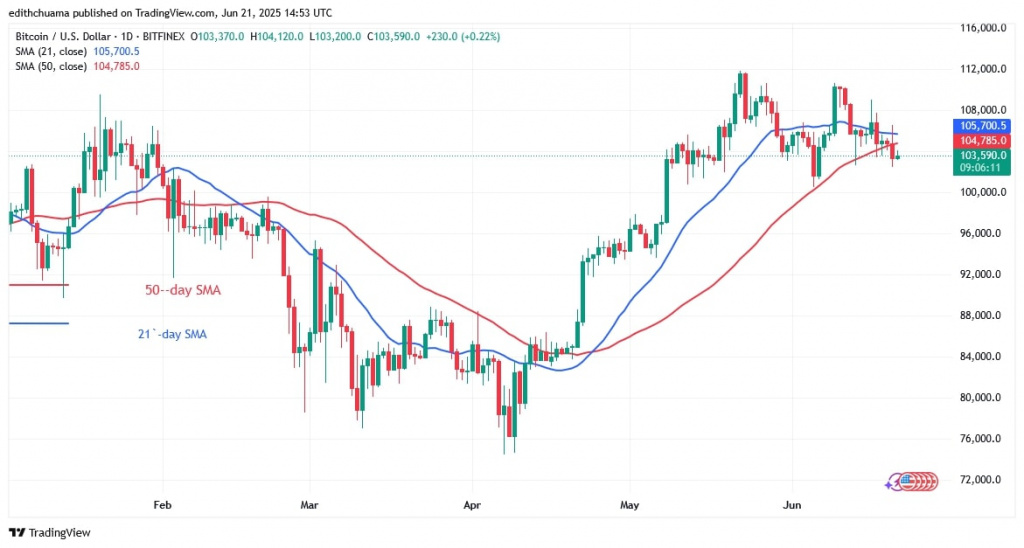
Bitcoin is gradually approaching the 50-day SMA barrier. If the cryptocurrency drops off the 50-day SMA and breaks below the current support at $102,000, it will continue to fall to the psychological price level of $100,000.
However, if the bears break the $100,000 support, the negative momentum will continue to the $94,800 floor. Bitcoin is currently valued at $103,660.
$BTC price indicators analysis
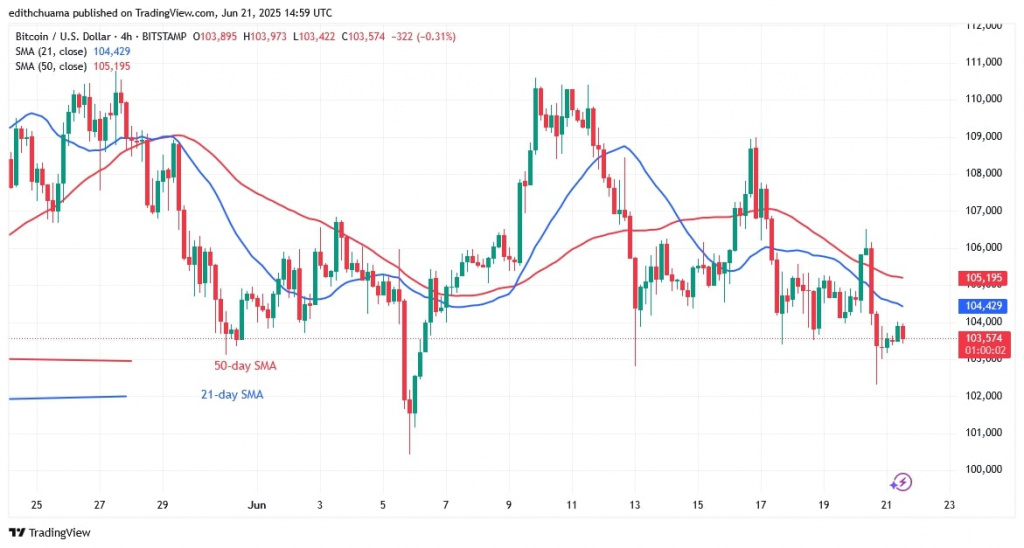
Since June 20, the price of Bitcoin has fallen below the moving average lines after a decline. The sideways trend means that the upward moving average lines are horizontal. Although the moving average lines on the 4-hour chart are horizontal, the price moves both above and below them.
Technical indicators
Key supply zones: $108,000, $109,000, $110,000
Key demand zones: $90,000, $80,000, $70,000
What is the next move for Bitcoin?
Bitcoin has fallen into the downtrend zone on the daily chart. In other words, Bitcoin is vulnerable to a further drop in value as the price bars are below the moving average lines.
On the 4-hour chart, Bitcoin is trading above the $102,000 support but below the $110,000 resistance. The Doji candlesticks are currently visible and the price movement has not changed.
Disclaimer. This analysis and forecast are the personal opinions of the author. They are not a recommendation to buy or sell cryptocurrency and should not be viewed as an endorsement by CoinIdol.com. Readers should do their research before investing in funds.

 coinidol.com