newsbtc.com

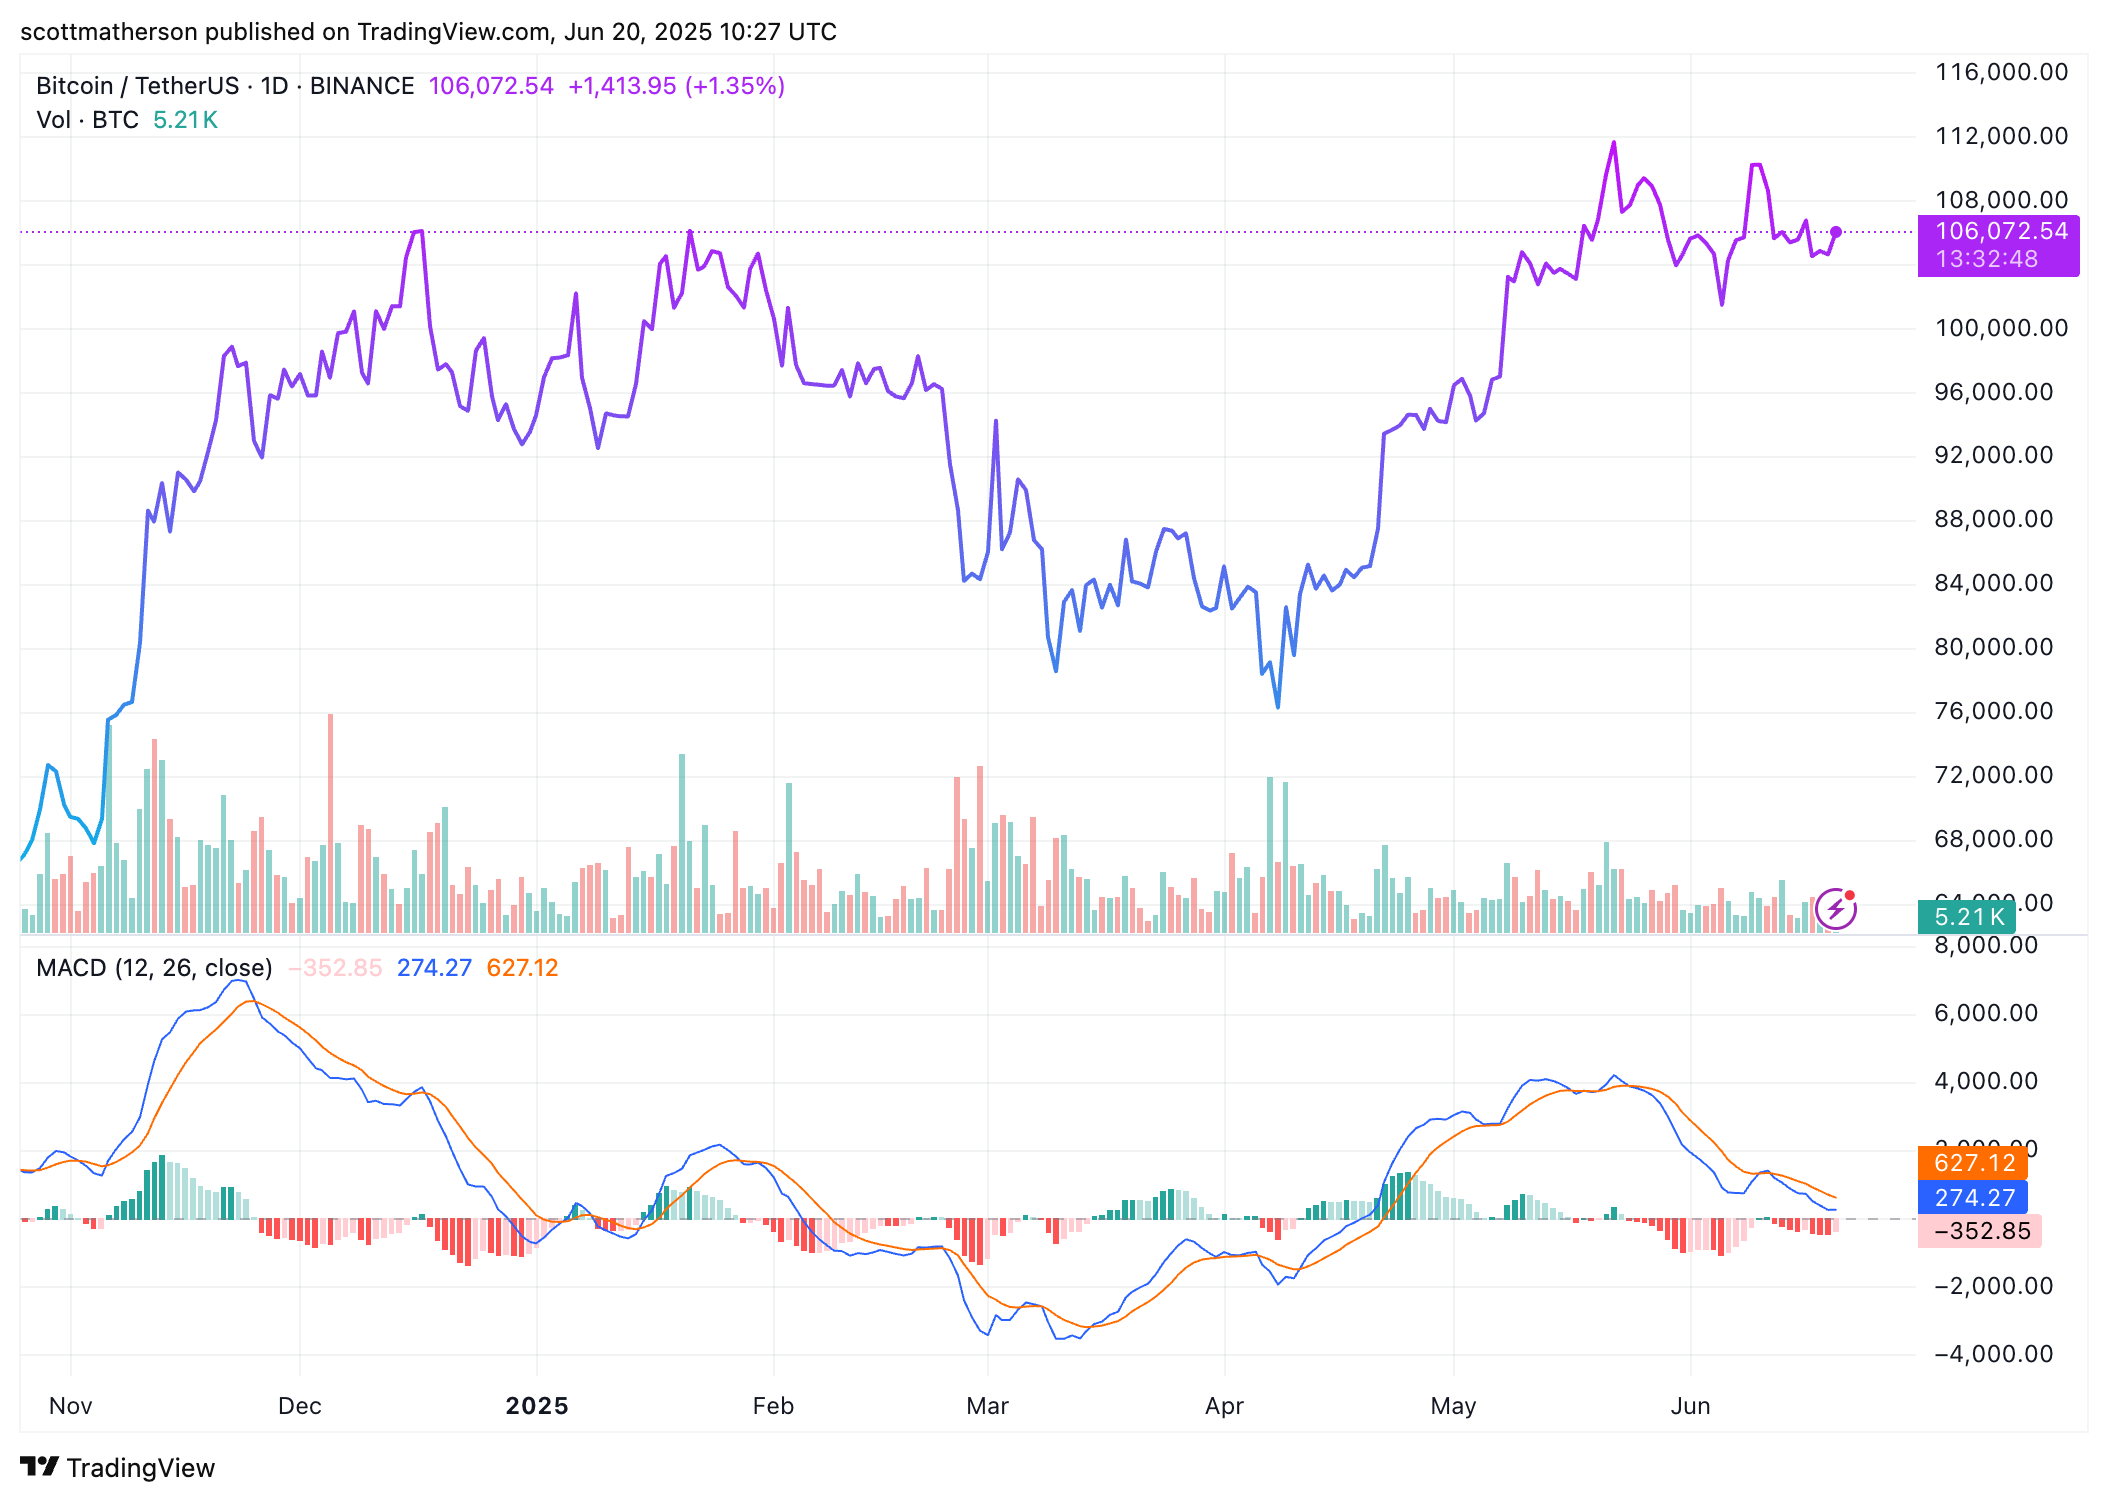
Bitcoin is currently hovering in a tightly compressed price range after failing multiple times to break above $110,000 earlier this month. The past few days have been characterized by the leading cryptocurrency trading around $105,000, with neither bulls nor bears taking control. Despite the overall consolidation, a subtle yet significant signal is starting to flash beneath the surface, particularly on the 4-hour chart, that might send Bitcoin to a new all-time high soon.
Return Of Rare Divergence Pattern On Bitcoin’s 4H Chart
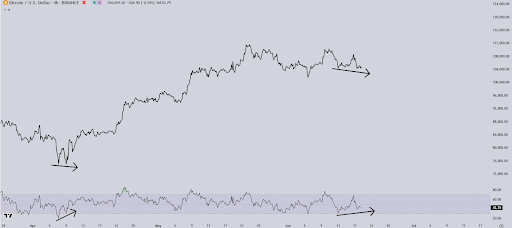
Crypto analyst Luca (@CrypticTrades_) took to social media platform X to share a chart that highlights an important technical development on Bitcoin’s 4-hour timeframe: the return of a bullish divergence. This signal, which previously appeared in early April, preceded the massive rally that catapulted Bitcoin to its May 22 all-time high of $111,800. The same divergence is forming once again and another Bitcoin price breakout may be very close.
As shown in the 4-hour candlestick timeframe chart below, the divergence is clearly illustrated between price action and the Relative Strength Index (RSI). Price has been forming lower lows, while the RSI has been printing higher lows. This mismatch serves as an early indicator that selling momentum is fading, and a reversal to the upside could follow. The previous instance of this pattern directly preceded a sharp move from a $74,000 low in early April to above $111,000 in just a few weeks.