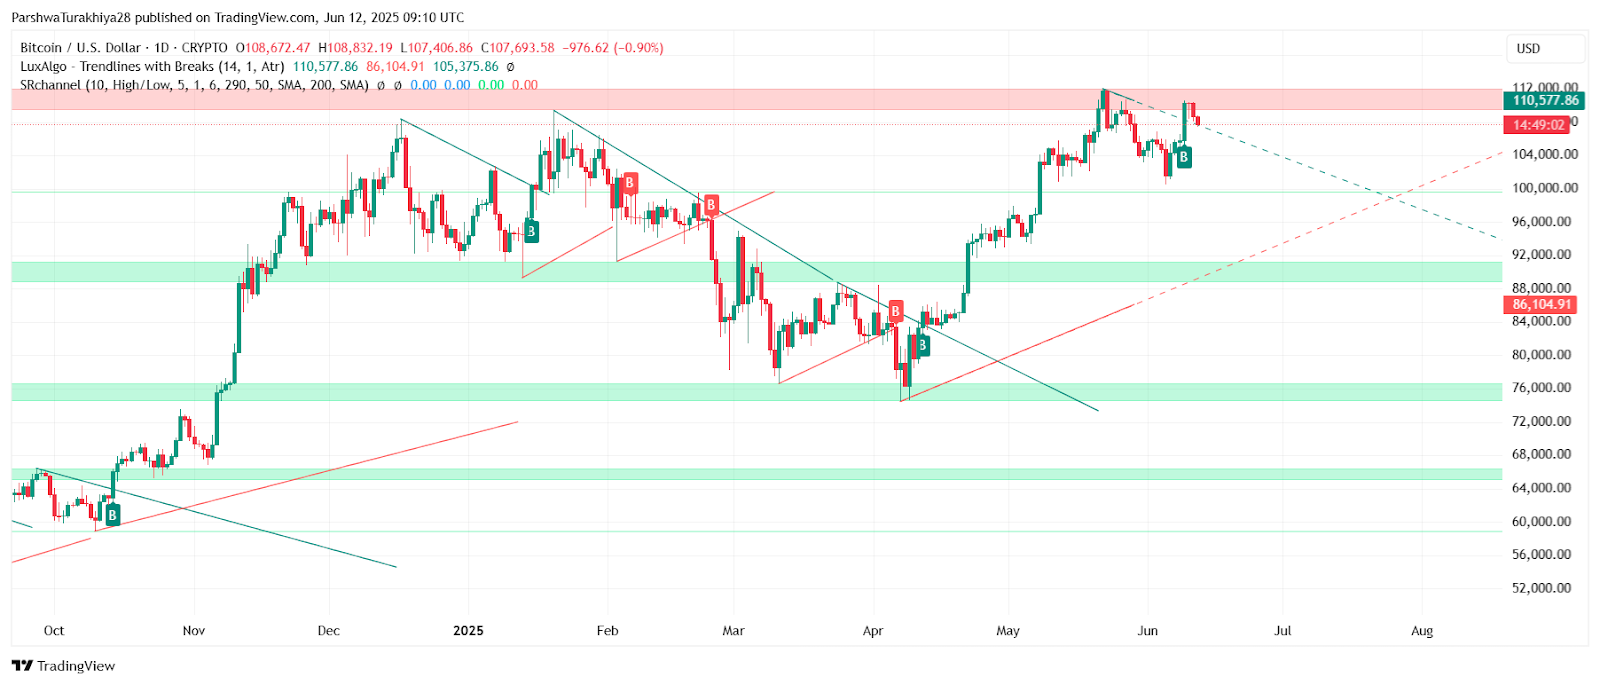
$BTC/USD price dynamics (Source: TradingView)
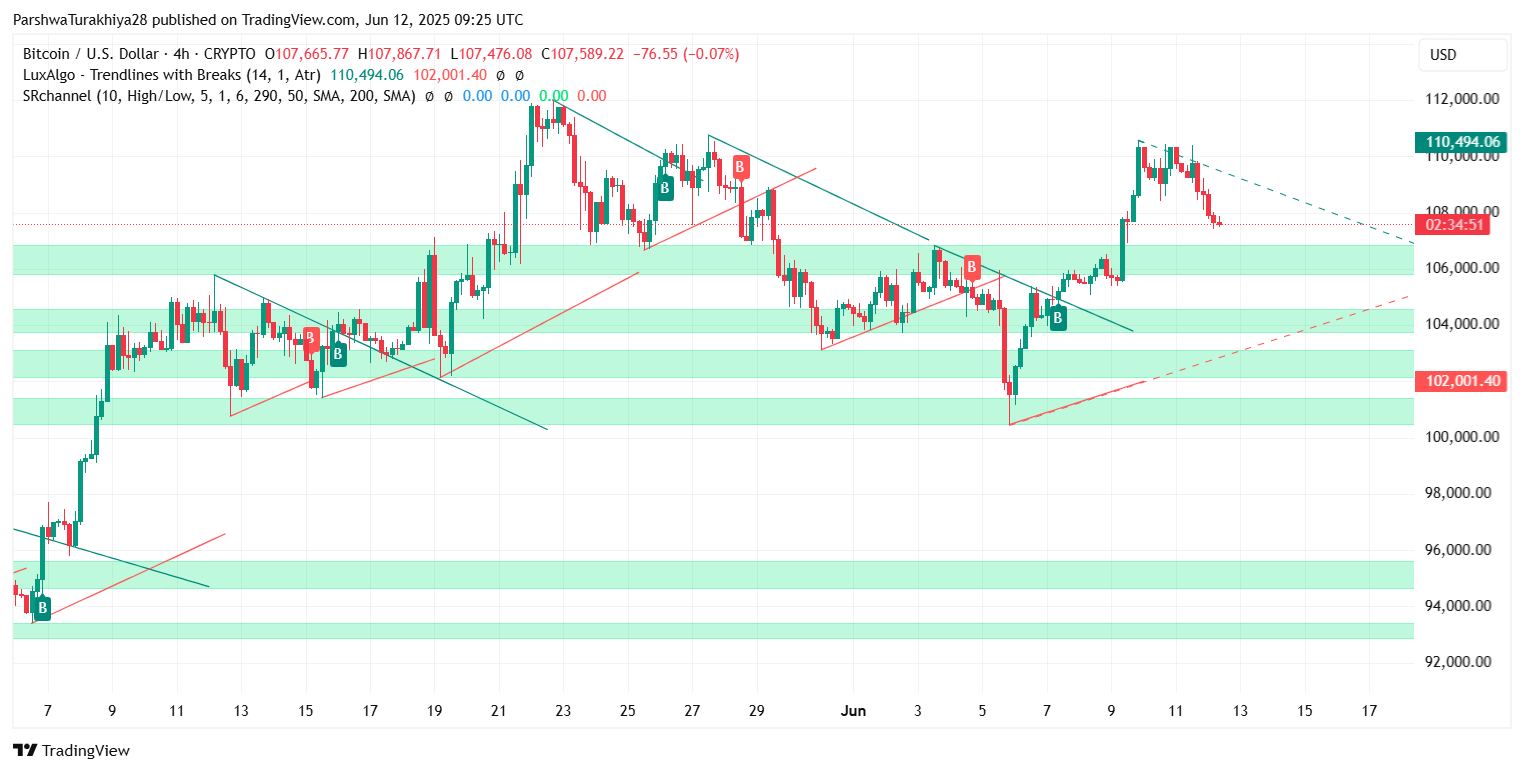
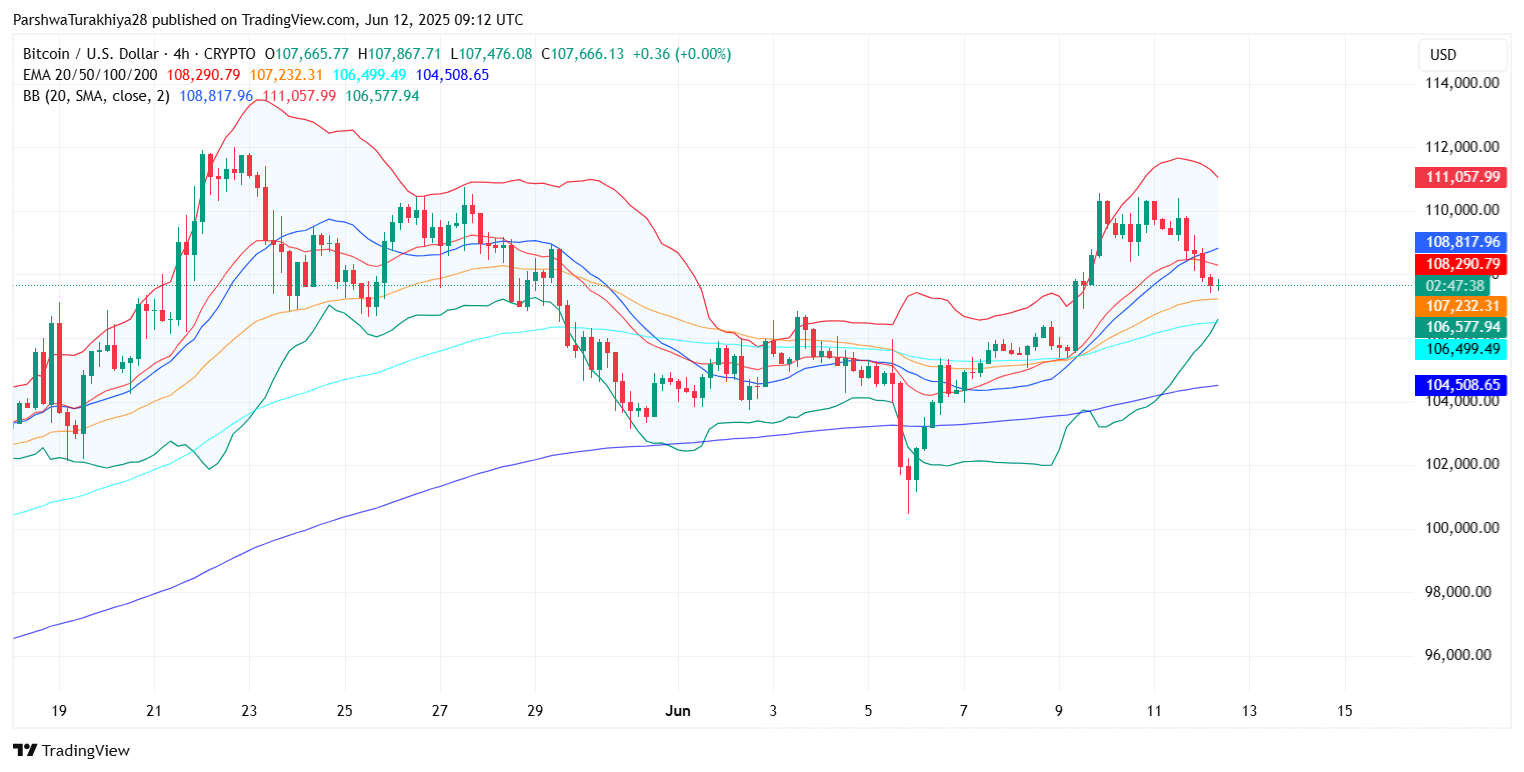
On the 4-hour chart, a bearish divergence is forming as Bitcoin price pulls back while MACD histogram and RSI trend lower. The latest Bitcoin price update reflects a potential cooling phase after the rally from the $100,500 base earlier this month. The recent pullback remains healthy within the broader structure, as long as $BTC holds support near $106,250 (0.5 Fib) and the rising 50-EMA near $107,230.
Short-Term Momentum Cools As Indicators Reset
$BTC/USD price dynamics (Source: TradingView)
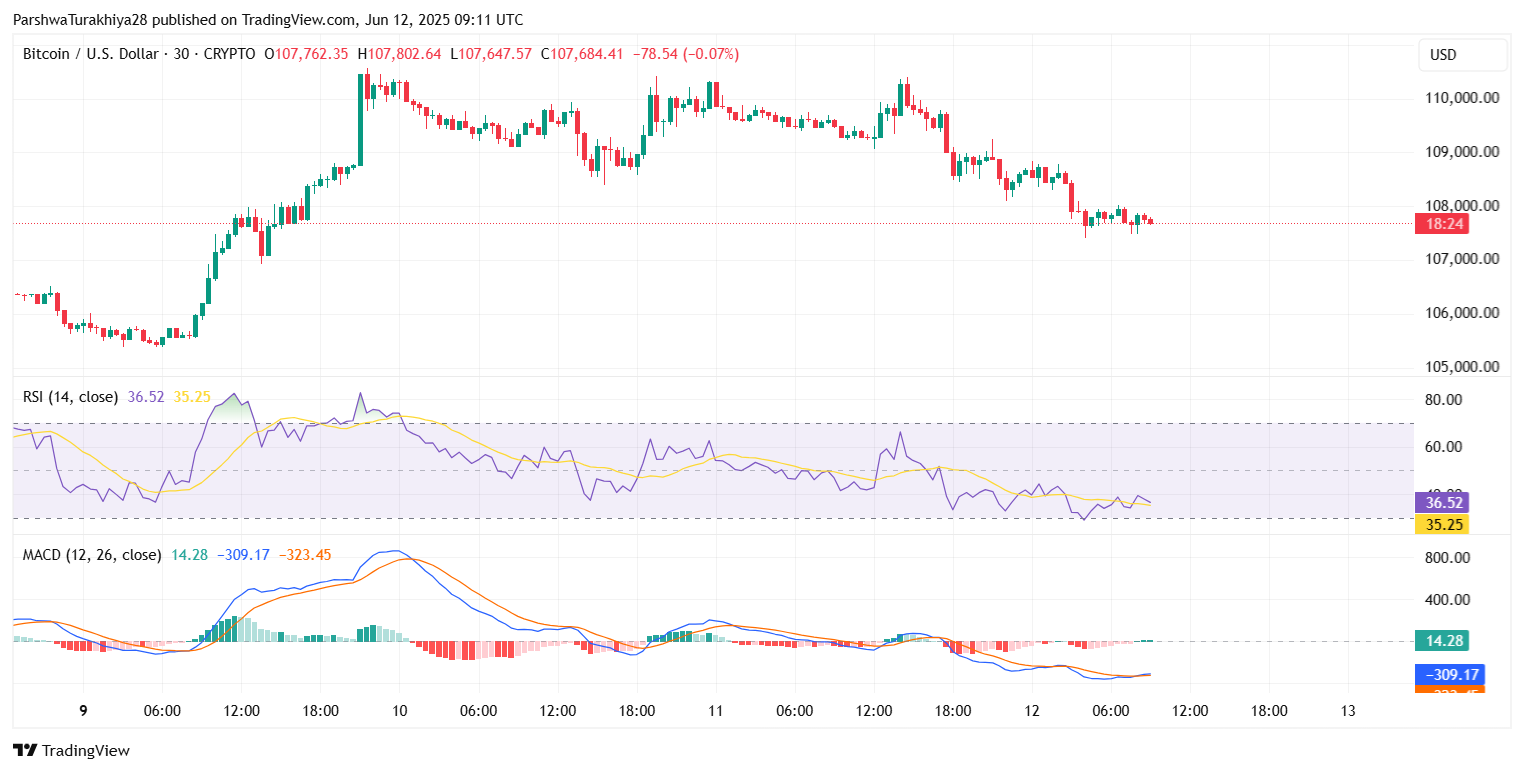
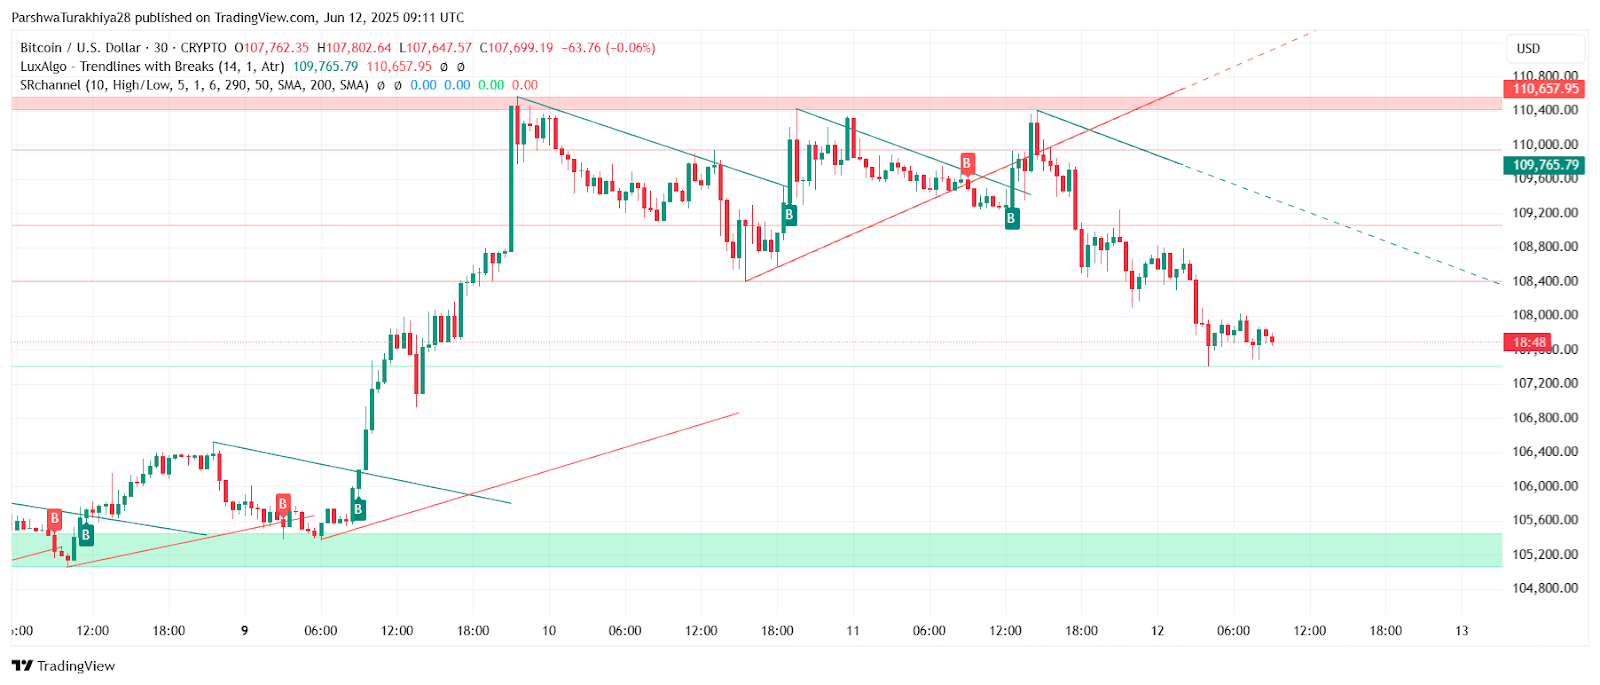
On the 30-minute chart, $BTC has been range-bound between $108,300 and $107,600 with MACD in negative territory and RSI hovering near 36. The RSI shows persistent bearish pressure intraday, and the histogram confirms waning momentum. However, the MACD lines are beginning to flatten, signaling that bears are losing steam. This suggests a potential sideways consolidation before the next move.
$BTC/USD price dynamics (Source: TradingView)
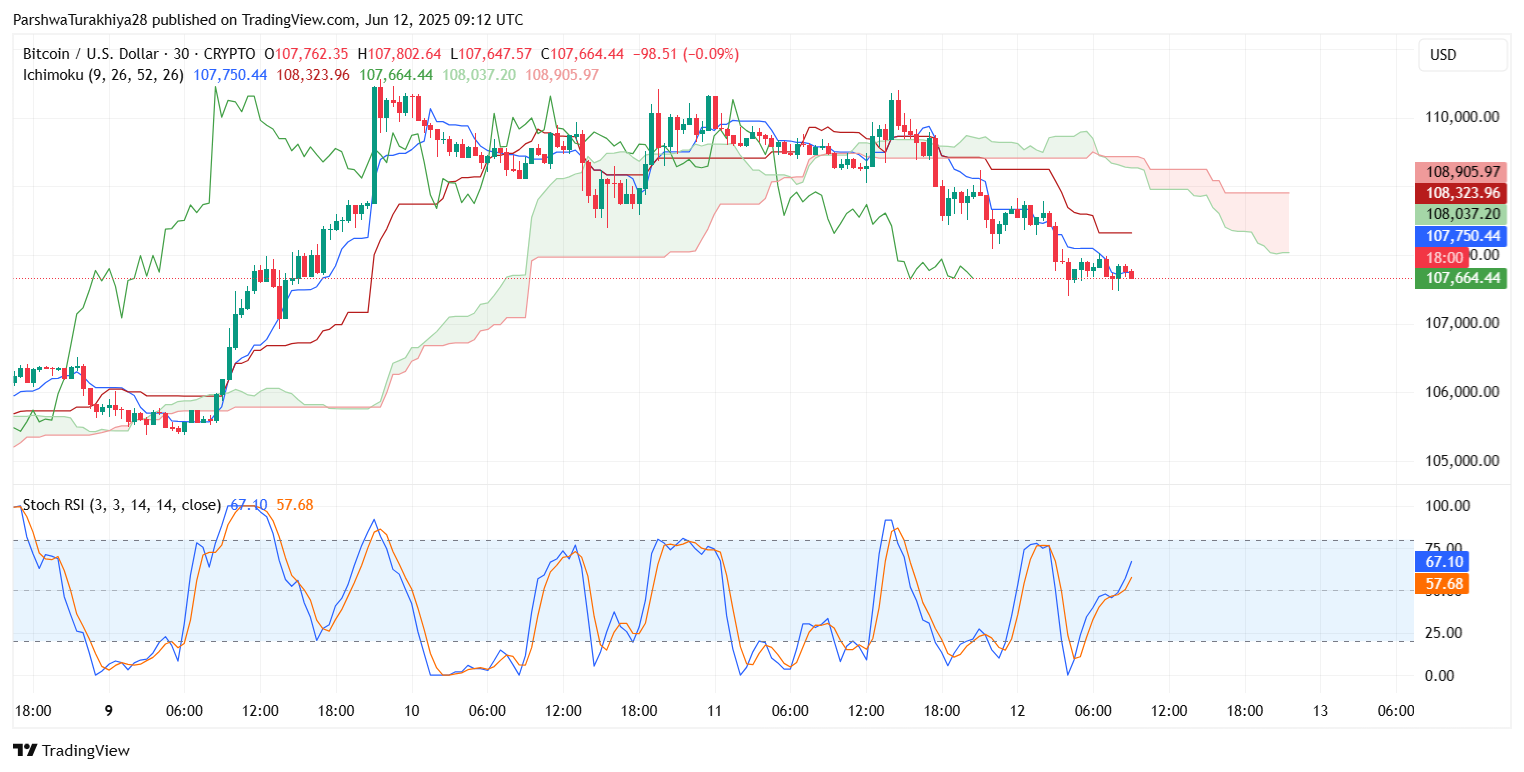
The Ichimoku Cloud further validates this cooling phase. Price is currently hovering below the Tenkan-sen and Kijun-sen, with the cloud acting as mild resistance. If $BTC can reclaim $108,200 and flip the cloud into support, a fresh rally may resume. Conversely, sustained rejection here could lead to further pressure on the $106,500–$106,250 zone.
Fibonacci Levels and Trendlines Signal Key Inflection
$BTC/USD price dynamics (Source: TradingView)
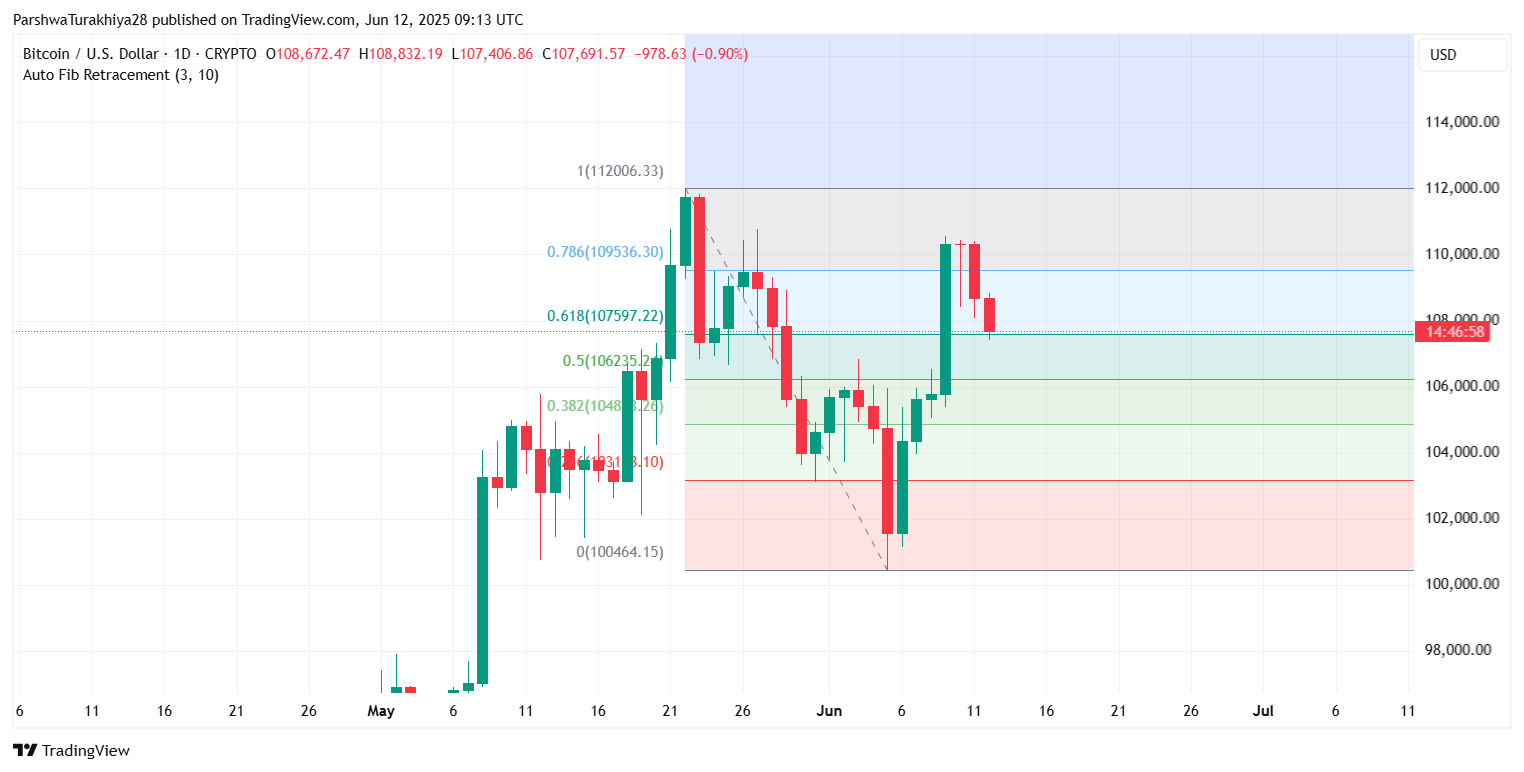
From a structural standpoint, $BTC remains above the key breakout trendline that extends from the June 7 low. This diagonal support intersects with the horizontal demand zone around $105,200–$106,000, making it a high-confluence area to watch.
The Fibonacci retracement tool applied to the recent swing high and low shows price trapped between the 0.618 and 0.5 levels. A decisive move above $107,600 could open the way toward $109,500 and eventually the previous top at $112,000. However, failure to hold the current zone would expose $BTC to a correction toward the 200-EMA near $104,500.
Why is the Bitcoin Price Going Down Today?
$BTC/USD price dynamics (Source: TradingView)
The Bitcoin price going down today is primarily due to weakening short-term momentum and rejection from the upper resistance band near $111,000. The MACD and RSI both suggest short-term exhaustion, while the Bollinger Bands on the 4-hour chart show price rolling over from the upper band. Traders are also booking profits after $BTC’s impressive rally earlier this month, adding to the corrective move. Despite the dip, no major bearish breakdown has occurred yet, and the broader trend remains bullish above $104,500.
Bitcoin Price Forecast for June 13
$BTC/USD price dynamics (Source: TradingView)
As $BTC consolidates just under key resistance, traders should focus on how price behaves around the $107,200–$106,250 support zone. A break below $106,250 could confirm a short-term top, while a reclaim of $108,300 might fuel another test of $110,000.
As long as $BTC stays above the 0.5 Fib and the 100/200 EMA zone, dips are likely to be bought, keeping the Bitcoin price outlook constructive. However, short-term Bitcoin price volatility remains high, and traders should monitor key trendlines and momentum resets before initiating new positions.
Disclaimer: The information presented in this article is for informational and educational purposes only. The article does not constitute financial advice or advice of any kind. Coin Edition is not responsible for any losses incurred as a result of the utilization of content, products, or services mentioned. Readers are advised to exercise caution before taking any action related to the company.

 coinedition.com