Bitcoin continues to hold around the $108,000 mark, consolidating within a narrow range after a sharp rally from April lows. Price action suggests strength, but momentum has cooled slightly, setting the stage for a critical few days ahead.
Technical Analysis
The Daily Chart
On the daily chart, $BTC remains above both the 100-day and 200-day moving averages, which are located in the $90,000 – $96,000 range, and have also crossed bullishly in recent weeks. The RSI sits around 63, showing that the rally isn’t yet overheated but is nearing the upper range.
A healthy consolidation around the $108,000 level could serve as a base for another leg up, provided bullish momentum holds and volume supports a breakout.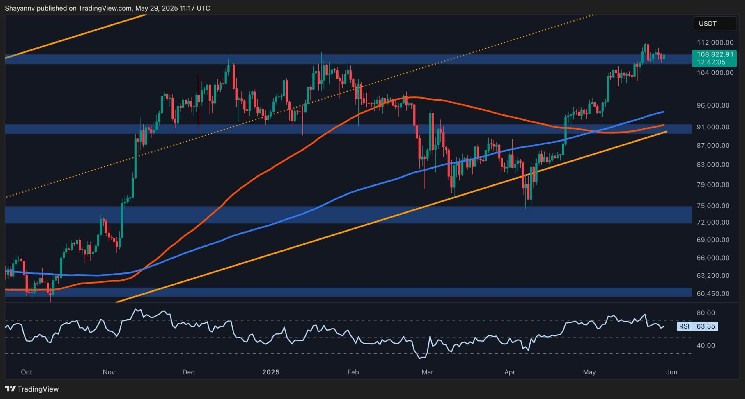
The 4-Hour Chart
The 4-hour chart shows a rising channel structure, and despite a recent breakdown of the lower trendline, the price has convincingly defended the horizontal support level at $106,000. This area has now become an intraday support zone.
The RSI is around the neutral 50 level, suggesting balanced momentum after a brief correction. A clean break and close above $109,000 and a return inside the channel could trigger a push towards the $112,000–115,000 range, while any breakdown below $106,000 might open the door for a short-term pullback toward the $102,000–$100,000 region.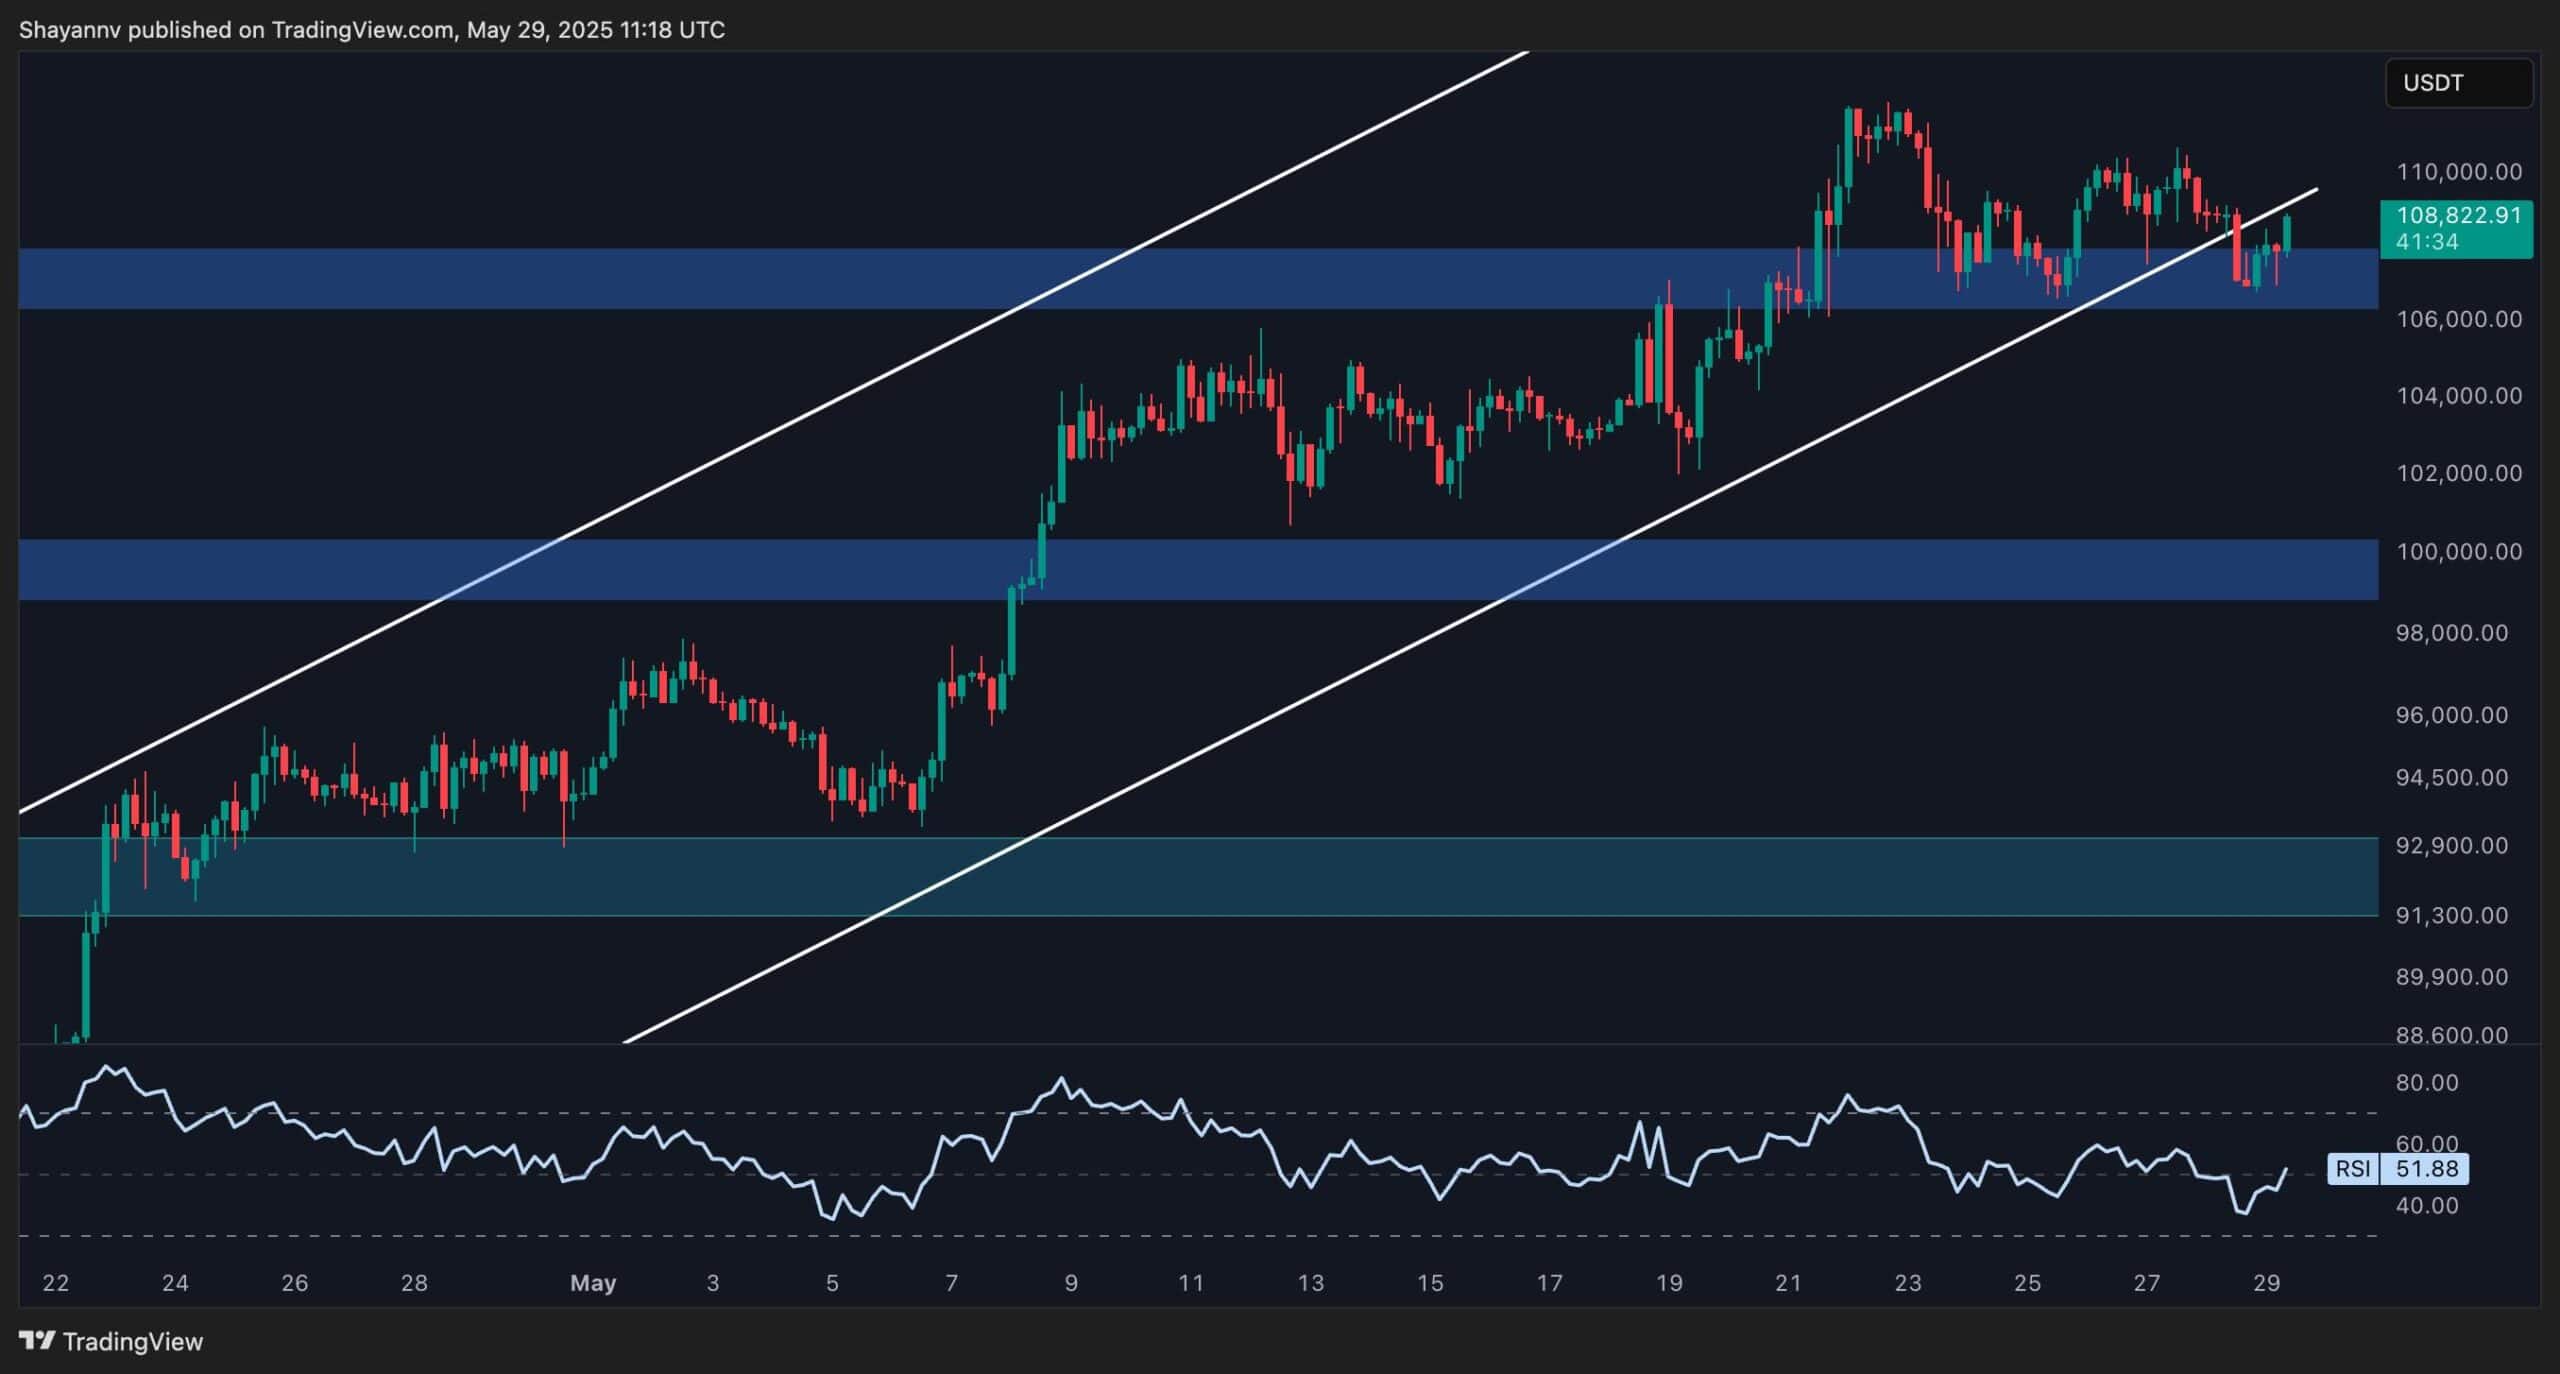
Sentiment Analysis
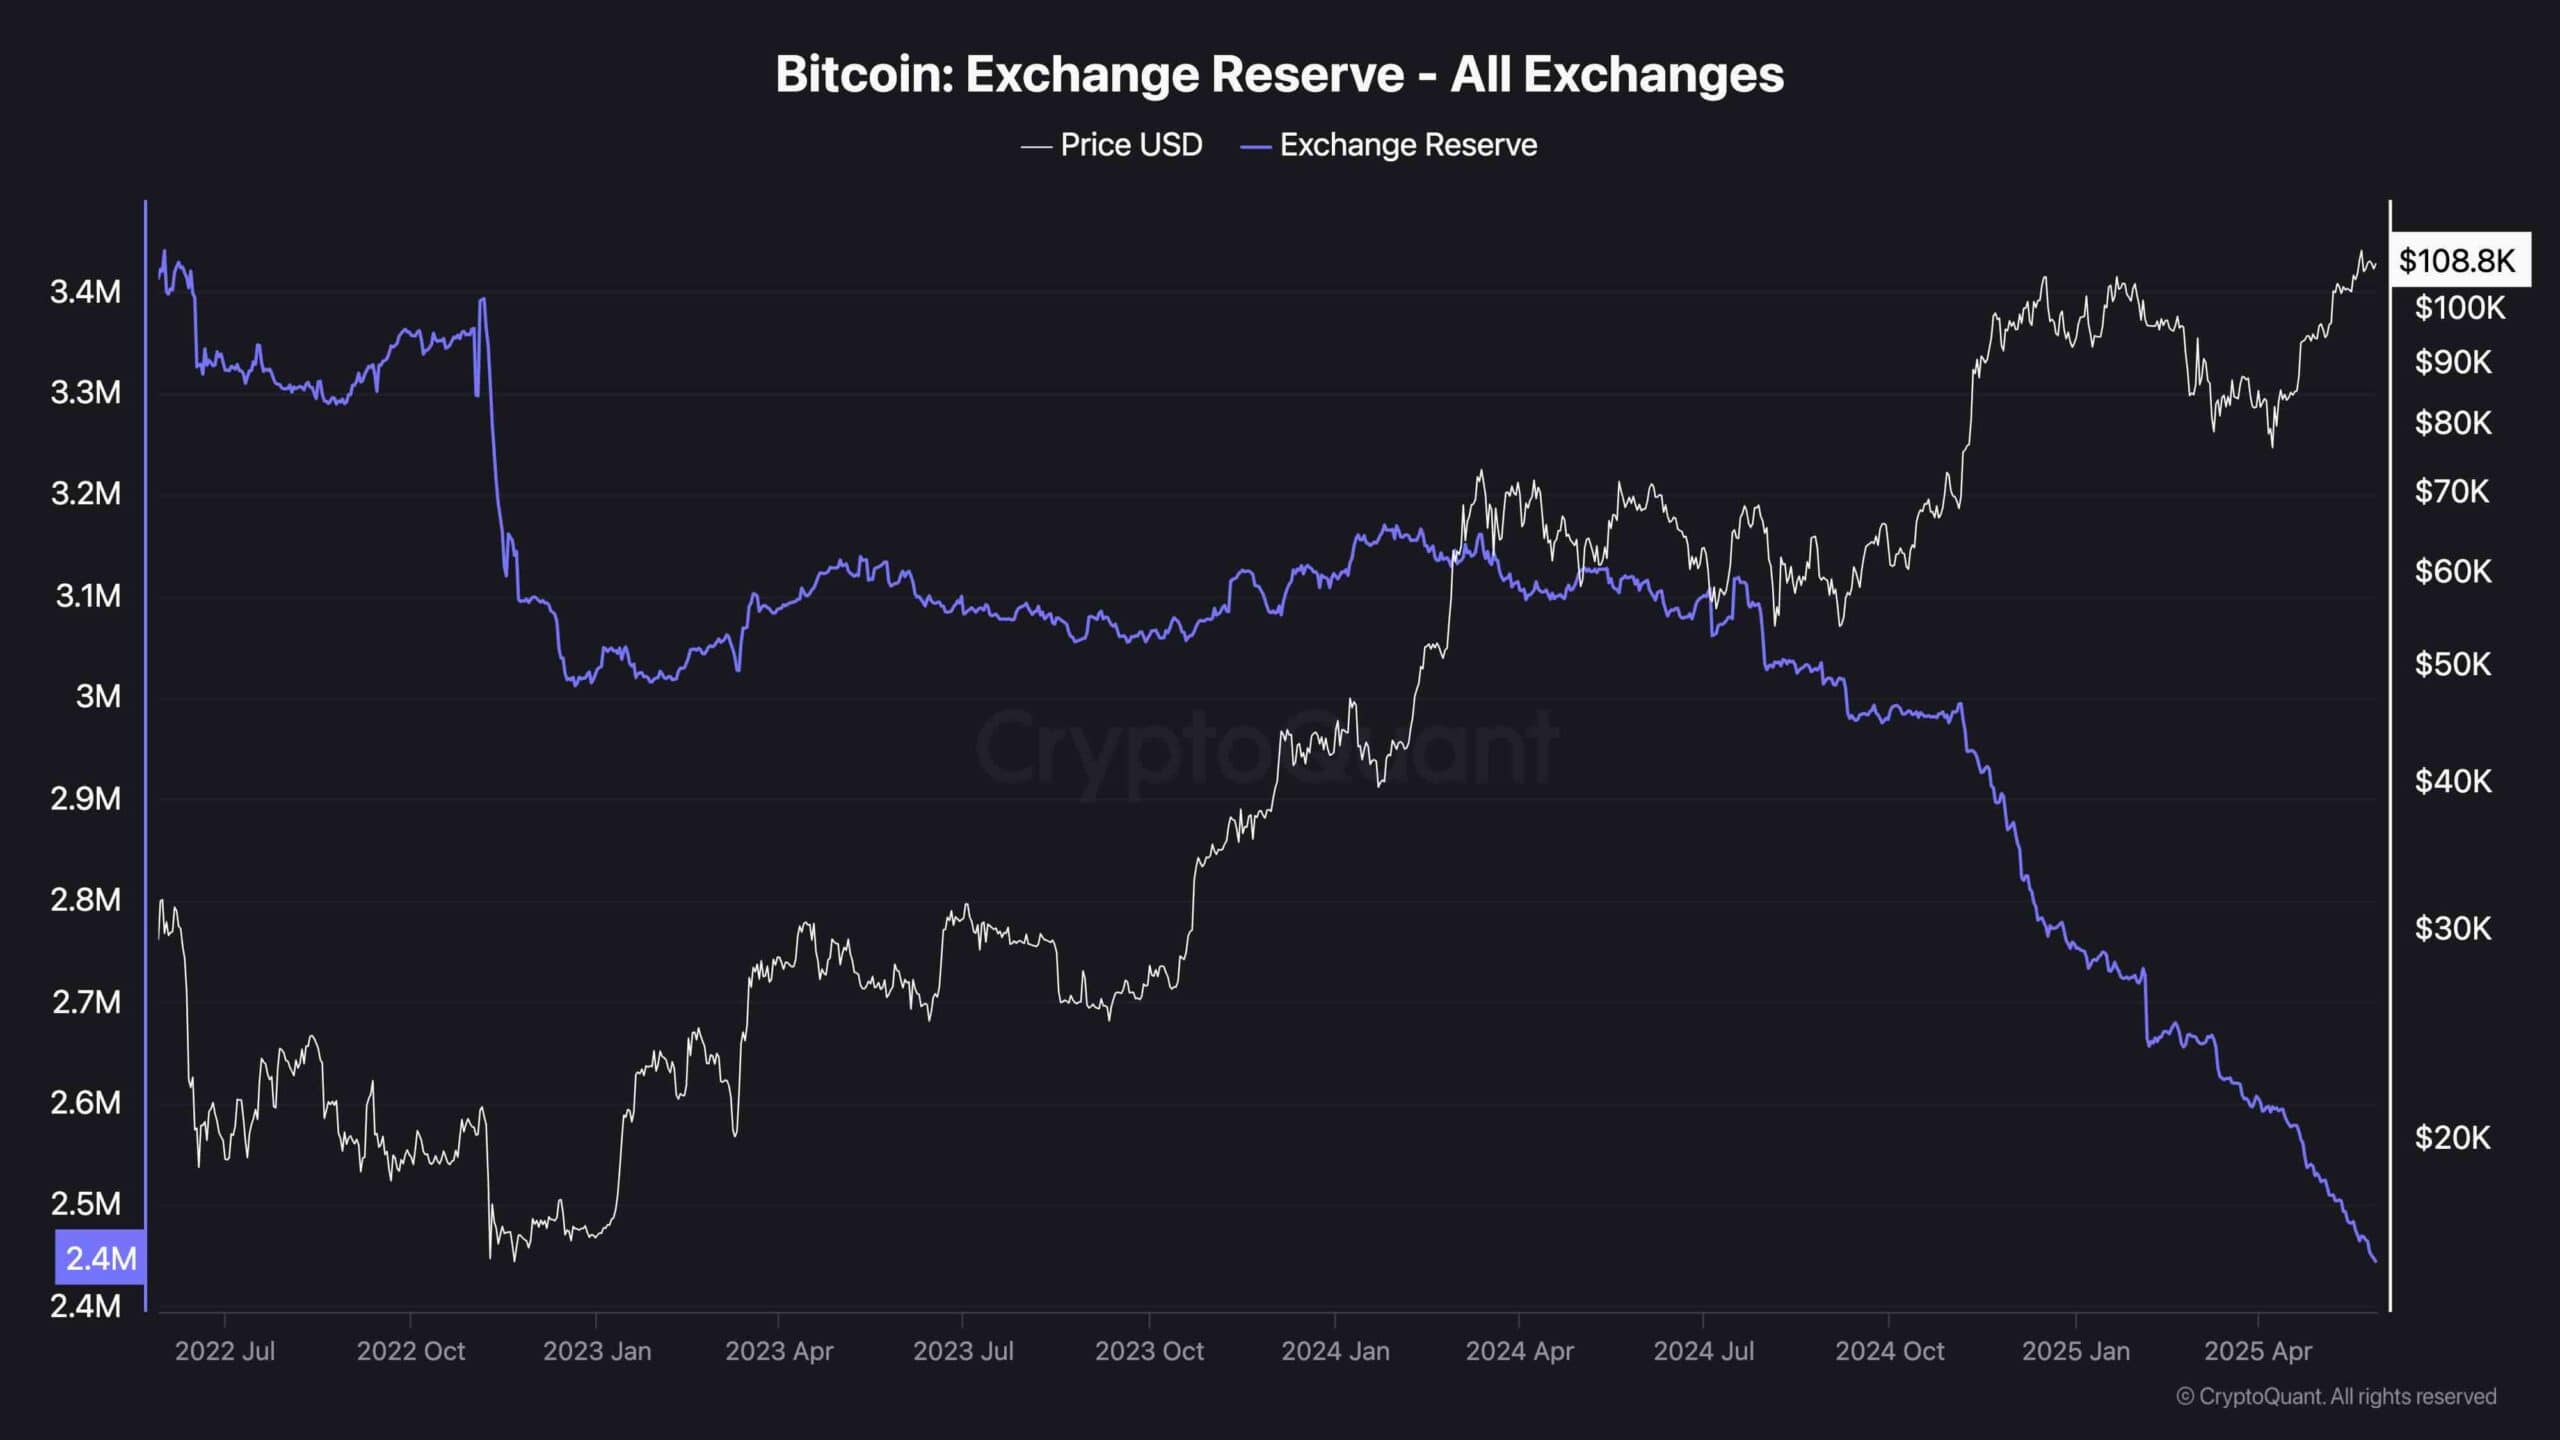
Exchange Reserve
On-chain data continues to support a bullish bias. Exchange reserves are at their lowest level in years, now sitting around 2.4 million $BTC. This sustained and aggressive decline reinforces the idea that investors are moving $BTC off exchanges, likely for long-term storage, reducing sell-side liquidity.
With supply tightening and price climbing, the conditions remain ripe for higher valuations, especially if macro conditions stay favorable and demand from institutional channels remains strong.