
-
Bitcoin Tops $100K Again: $BTC jumps 6.41% in one day, with bullish technicals and ETF inflows boosting investor confidence.
-
Larry Fink Sees $500K $BTC: BlackRock CEO predicts Bitcoin could hit $500,000+ in 5–10 years, calling it a future $10T asset.
Bitcoin’s bullish momentum continues. On May 8, $BTC surged 6.41% in a single day, once again climbing above the crucial $100K mark. In the last seven days, Bitcoin has risen by 6.9%, and in the past 24 hours alone, it gained at least 0.3%.
The recent rally has sparked renewed excitement in the crypto space, especially after a bold prediction from BlackRock CEO Larry Fink, who believes Bitcoin could trade well above $500,000 within the next 5 to 10 years.
Larry Fink’s Bitcoin Price Prediction
🚨 BREAKING 🚨
— Crypto Beast (@cryptobeastreal) May 9, 2025
Blackrock CEO Larry Fink says: "we will be seeing #bitcoin well above $500k in the next 5 to 10 years, this is a $10+ trillion dollar asset" pic.twitter.com/P4hIBqoxkq
BlackRock’s CEO Larry Fink predicts Bitcoin could surpass $500K within 5–10 years. He also labeled Bitcoin a potential $10 trillion asset, reinforcing growing institutional faith in crypto.
The momentum is backed by ETF activity. The U.S. market now hosts eleven Bitcoin Spot ETFs, with a combined AUM of $118.59B. Their total market cap stands at $120.76B, with a daily volume of $2.66B.
BlackRock’s iShares Bitcoin Trust (IBIT) leads the market with an AUM of $62.65B. In the first few days of this month alone, 21,303.28 $BTC flowed into IBIT.
Larry Fink’s bold outlook highlights BlackRock’s belief in Bitcoin’s expanding role in the global financial system.
Bitcoin Price Analysis
On November 5, 2024, Bitcoin traded at $69,374.85. Between then and December 17, $BTC grew by 56.23%. From December 18 to February 23, 2025, it mostly ranged between $106,132.47 and $92,455.22. On February 24, it dropped by 4.92% in a single day, falling below that range. Later, on April 7, $BTC hit a low of $74,532.07.
However, by April 9, strong buying pressure emerged. Since then, the price has jumped 35.38%, reaching $103,376.94.
In terms of monthly performance:
- January: +9.54%
- February: -17.5%
- March: -2.19%
- April: +14.2%
- May (so far): +9.57%
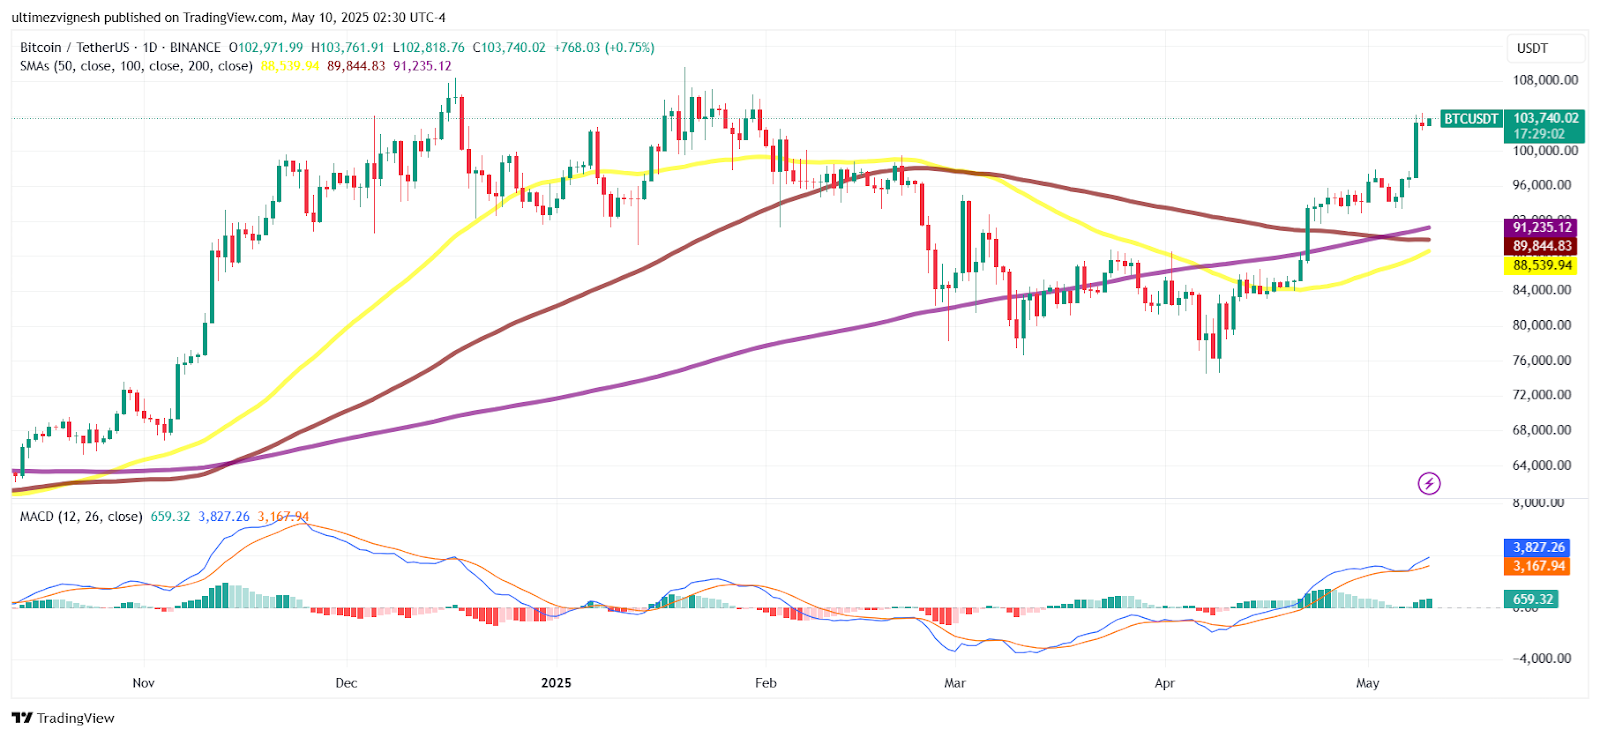
The Relative Strength Index (RSI) stands at 75.29, placing $BTC in overbought territory. However, the market is currently above all three key moving averages:
- 50-SMA: $88,534.40
- 100-SMA: $89,842.09
- 200-SMA: $91,233.80
The MACD line is at 3,803.03, well above the signal line at 3,163.09, signaling bullish momentum. Though the On-Balance Volume (OBV) is at -492.54K, indicating some negative volume pressure, overall sentiment remains bullish.