Bitcoin continues to trade just below the $96K resistance, consolidating after its sharp rally in late April. The price is currently hovering in a narrow range while the market digests recent gains.
Momentum has slightly cooled off, but no major bearish reversal signs have emerged yet.
Technical Analysis
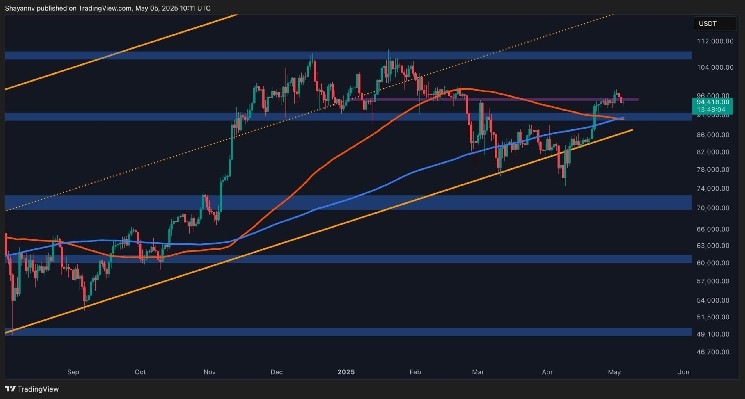
The Daily Chart
$BTC remains in an overall bullish structure on the daily timeframe, holding above the $91K support and both the 100 and 200-day moving averages. After breaking through the $90K–$91K range, the asset is now testing the $95K resistance zone, which also aligns with the neckline of the previous consolidation.
Moreover, the 100-day and 200-day moving averages have printed a bearish crossover near the $90K level, which is the only major worrying sign. Yet, as long as Bitcoin holds above both of them, the medium-term bullish trend remains intact.
The 4-Hour Chart
On the 4-hour chart, $BTC has recently been trapped inside an ascending channel pattern, which typically signals a local top or slowdown in bullish momentum, especially if broken to the downside.
The asset is currently testing the lower boundary of the pattern around the $94K–$94.5K area, now acting as support. If this level fails to hold, the next demand zone lies around the $92K mark. On the flip side, reclaiming $96K would likely ignite another leg higher, targeting $98K and even $100K.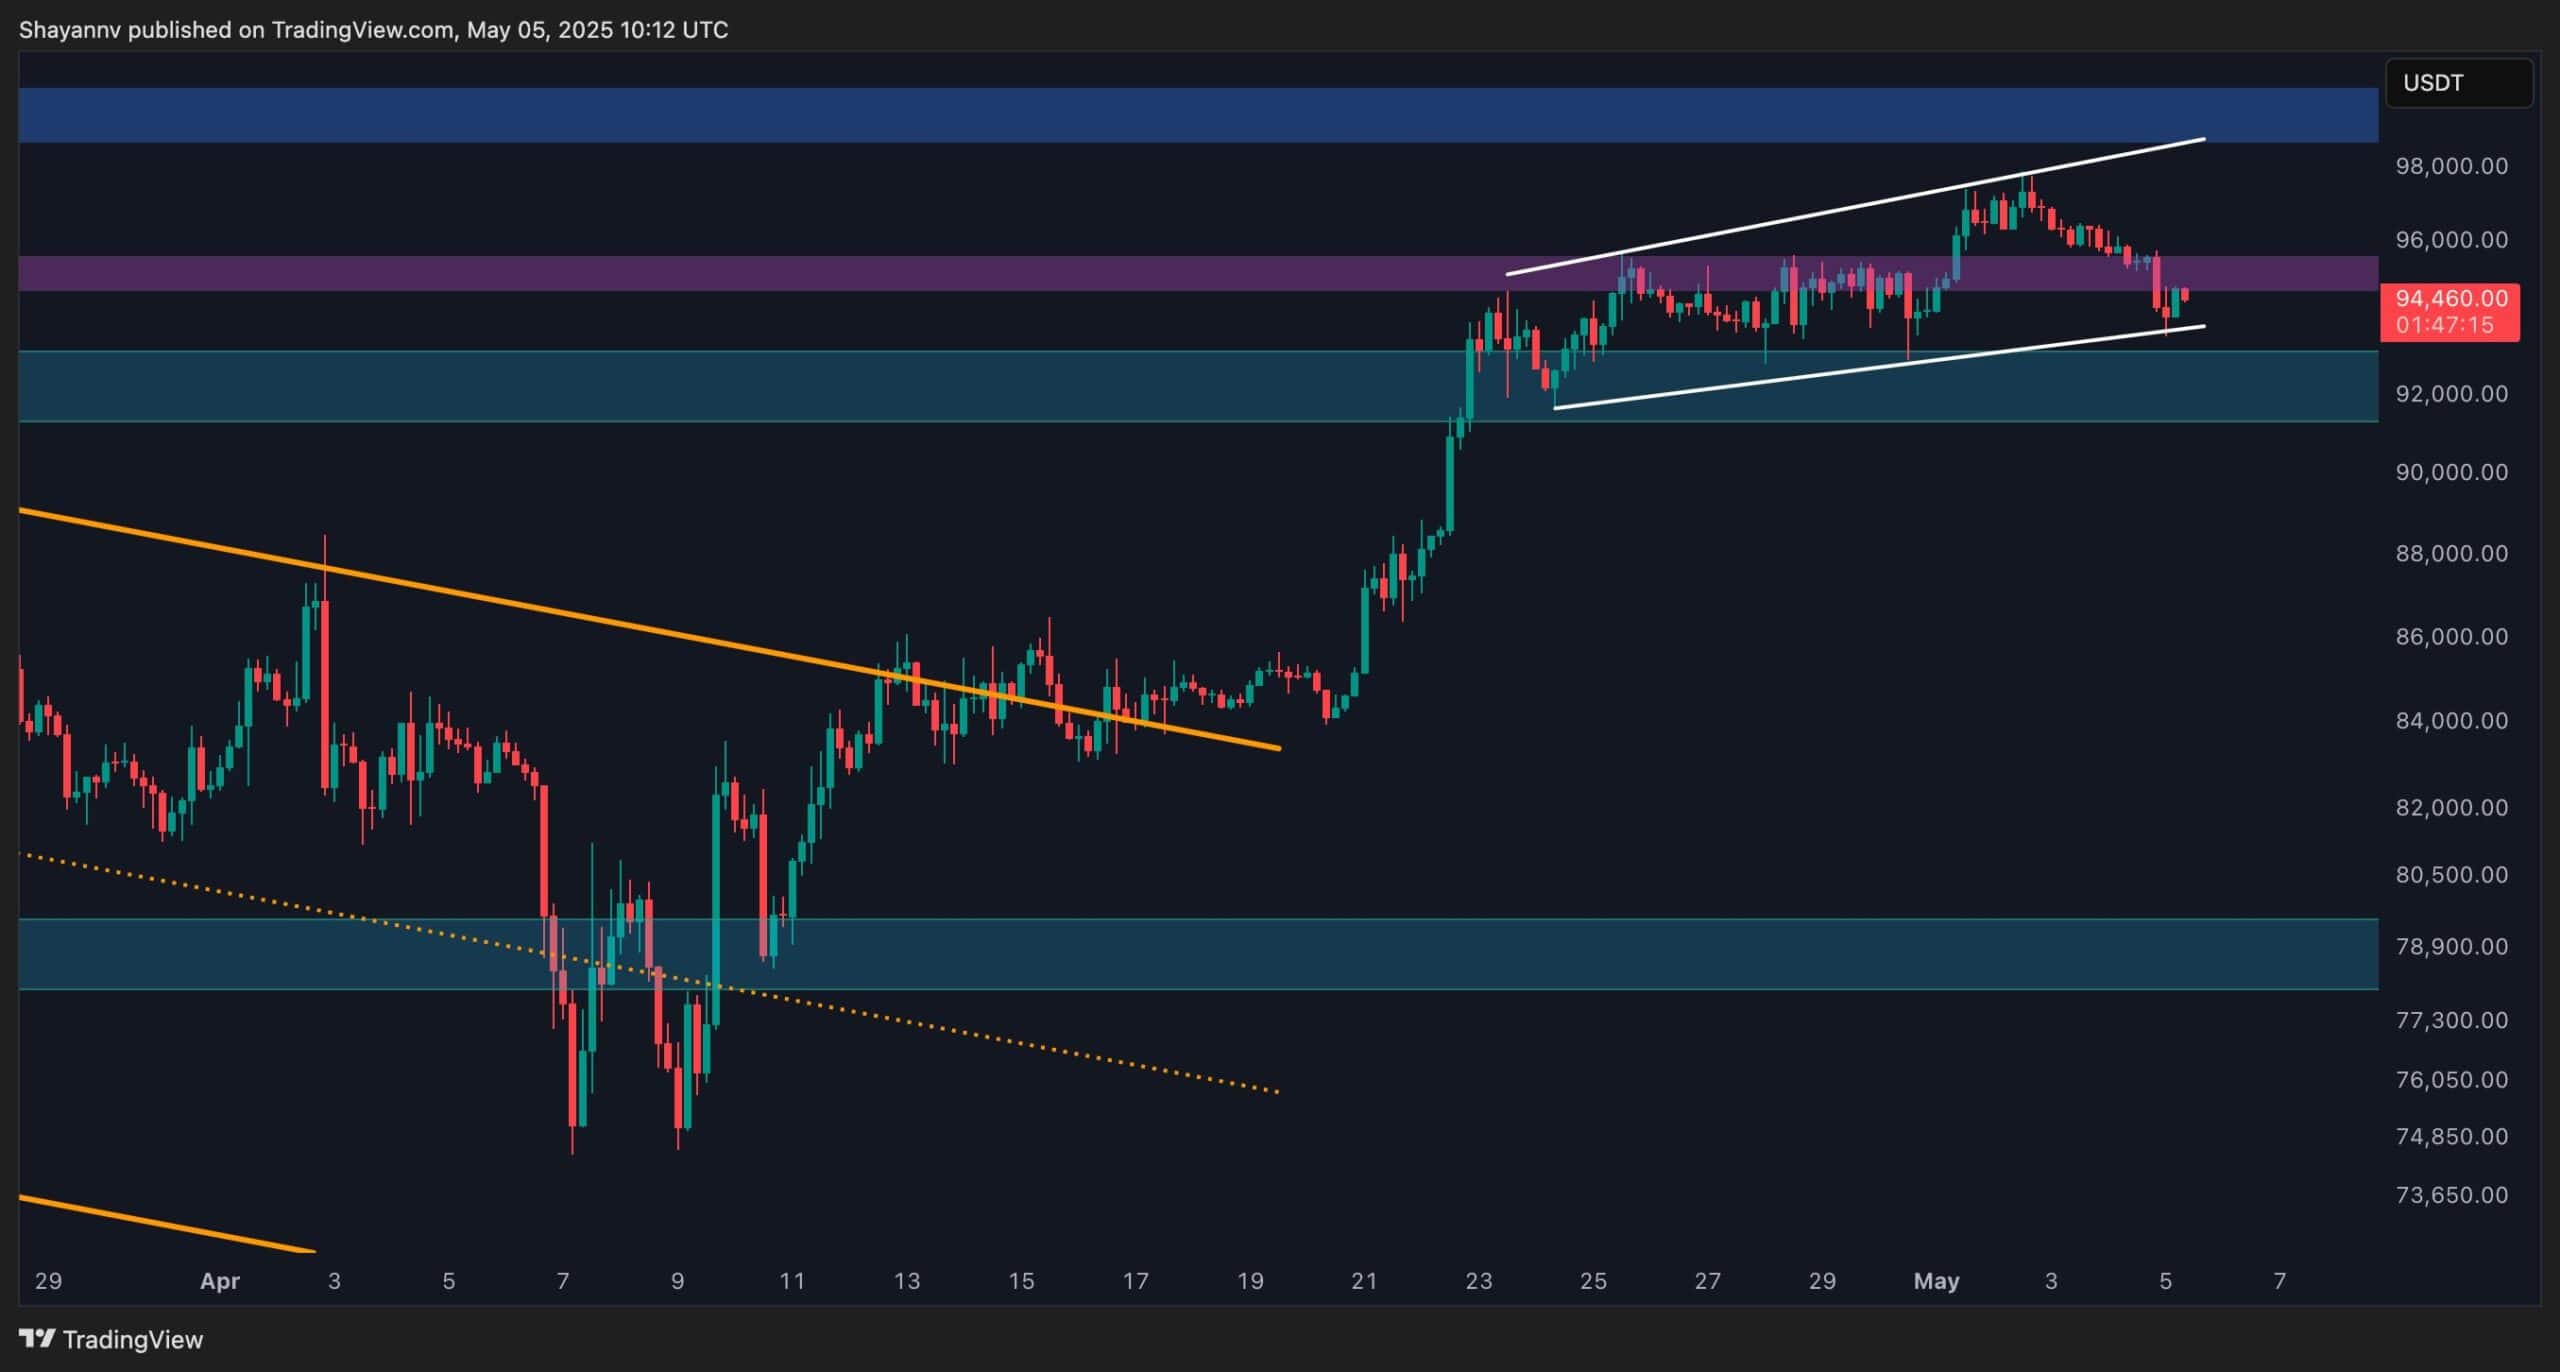
Onchain Analysis
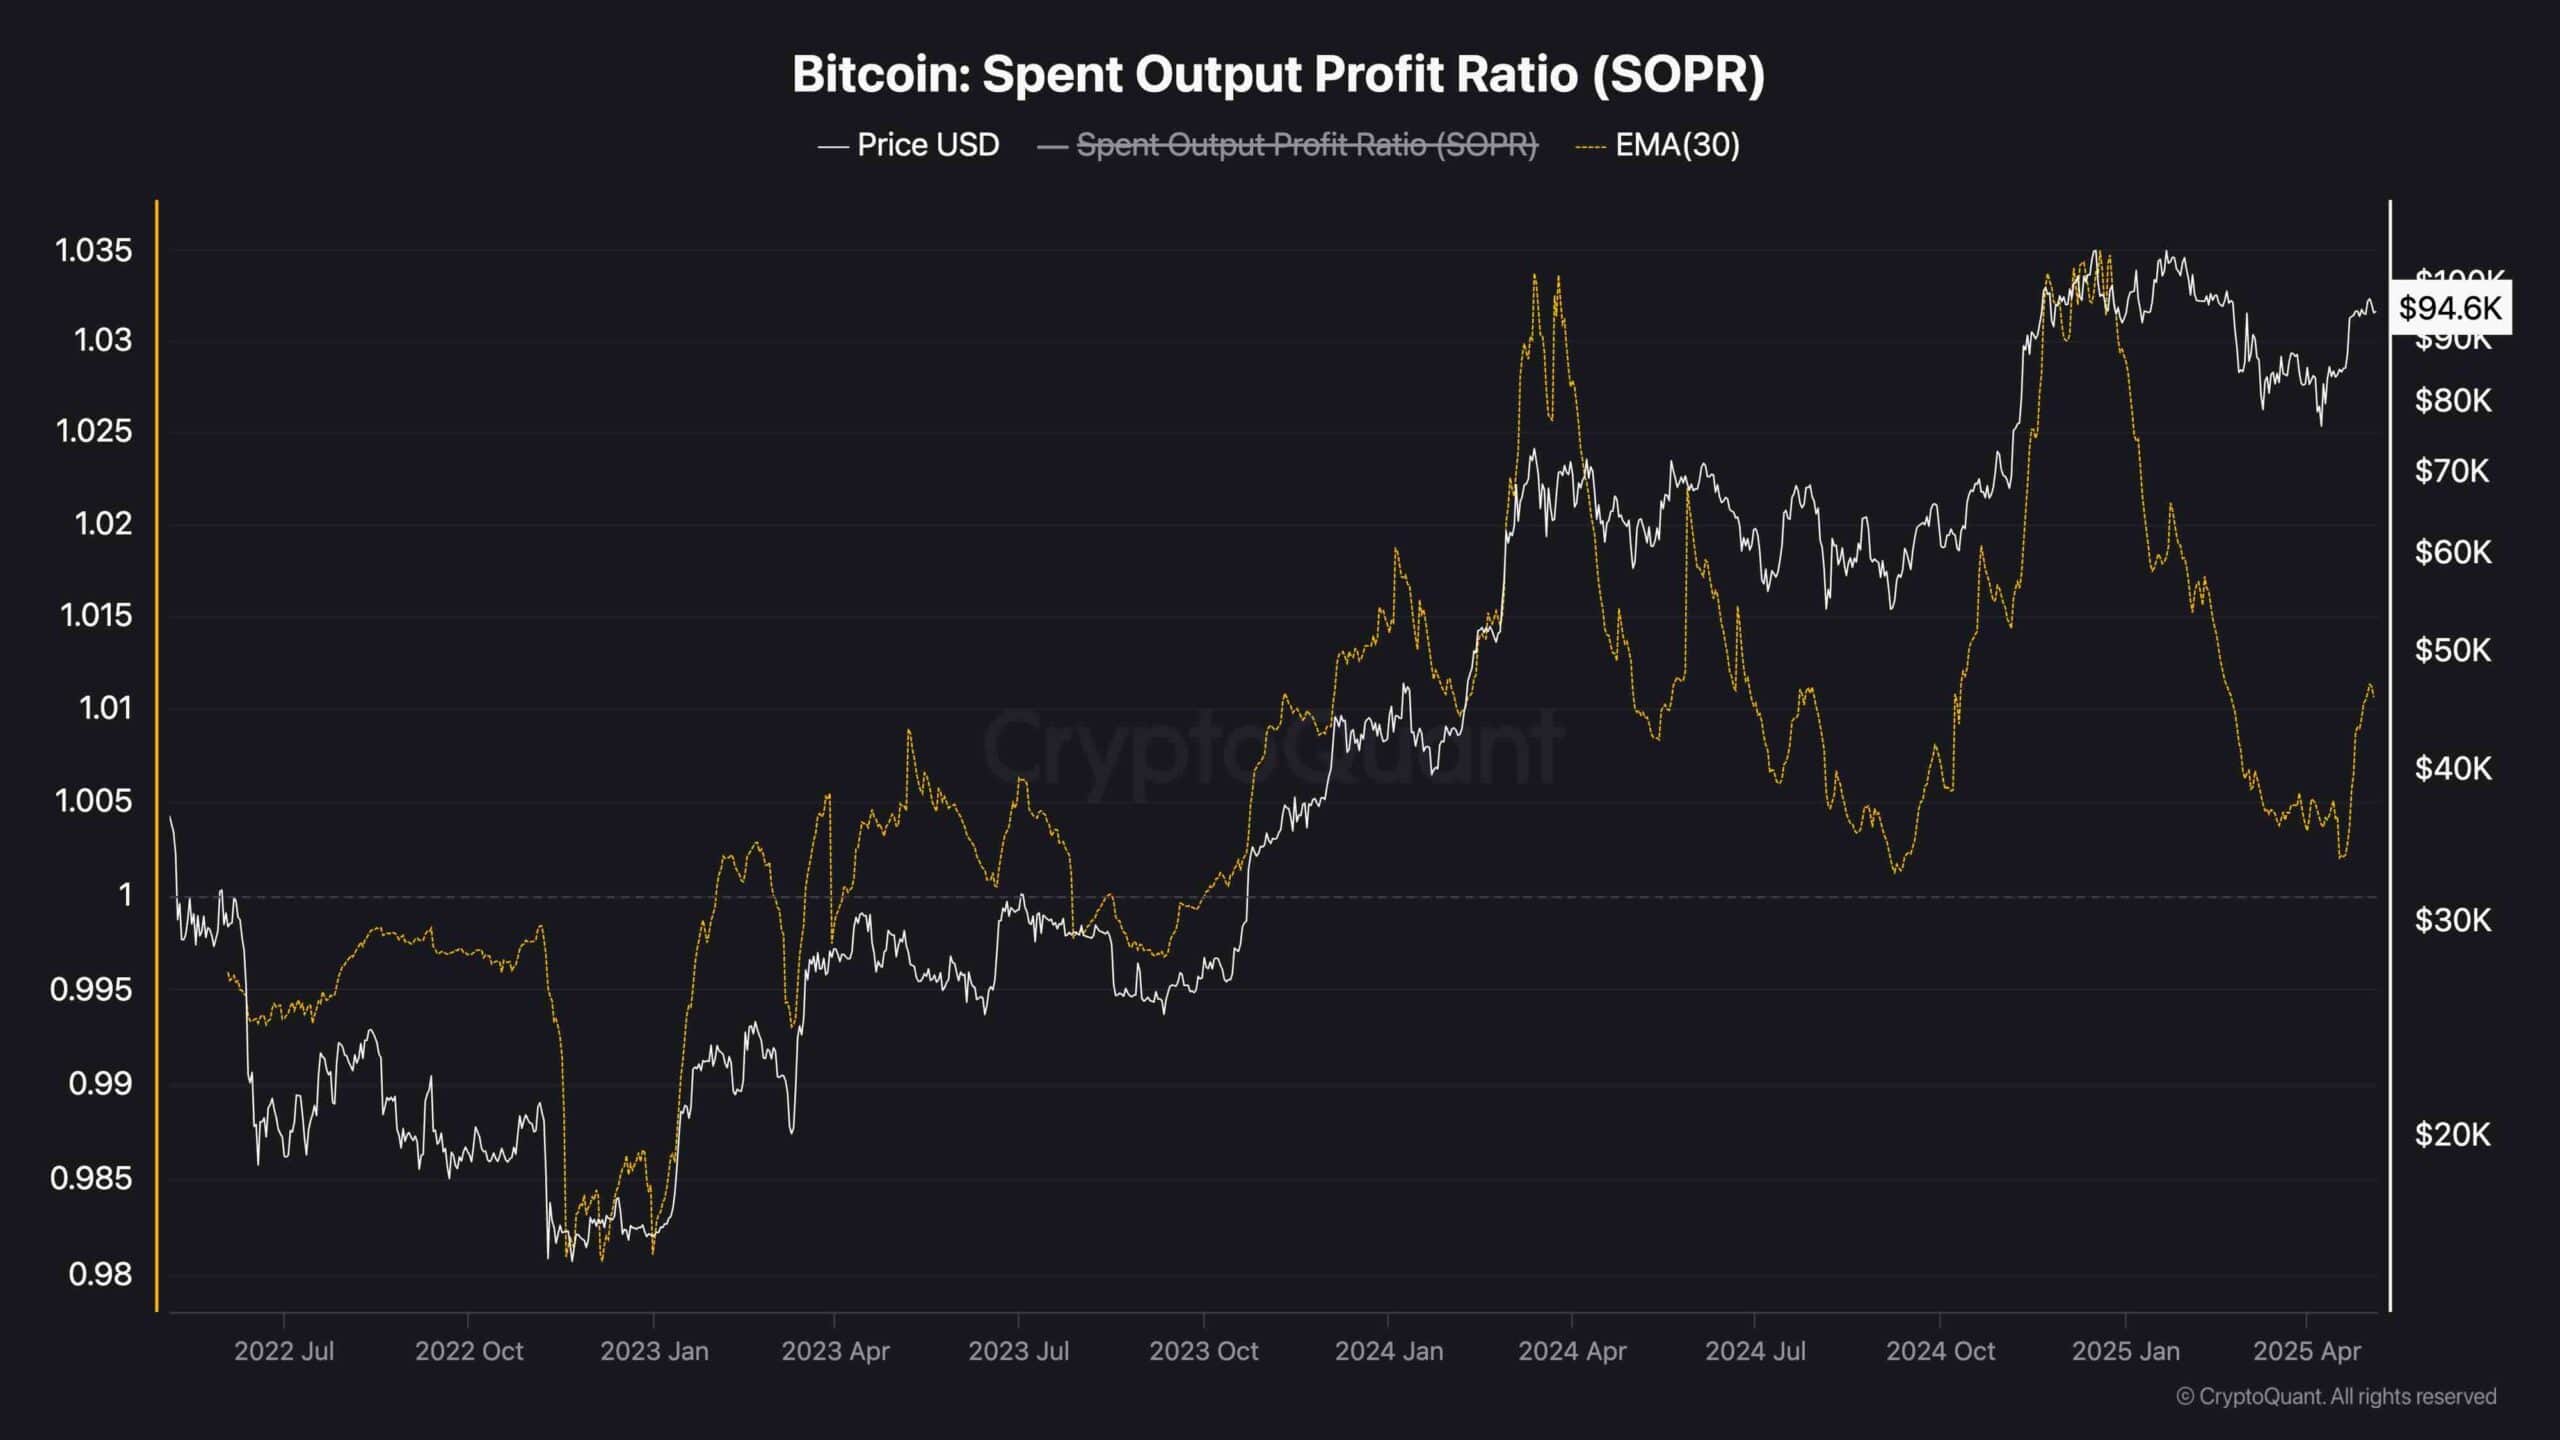
SOPR (EMA 30)
On-chain metrics suggest the bullish bias remains supported by healthy profit-taking dynamics and limited sell-side pressure. The Spent Output Profit Ratio (SOPR) remains above the 1.0 threshold, indicating that coins moving on-chain are doing so in profit. Importantly, SOPR recently rebounded with the price, suggesting that even after the rally, holders are not rushing to exit positions at a loss.
This reflects strong conviction in the market and typically supports trend continuation rather than immediate correction.