
A rare technical pattern that preceded a 69% rally in Bitcoin ($BTC) last year has just made a comeback - and traders should take notice.
The so-called golden cross, where the 23-day moving average crosses above the 200-day moving average, is about to be officially printed on Bitcoin’s daily chart. The last time this happened was October 2024. What followed was a surge from below $65,000 to over $108,000 in just a few months.
Now, it is back.
According to the latest observation, $BTC’s 23-day price curve is striving to cross the 200-day one from below, triggering what many see as a textbook bull rally signal.
It is worth noting, though, that historically, golden crosses do not always guarantee immediate upside - but when they coincide with macro momentum and a breakout-ready chart, the results can be explosive.
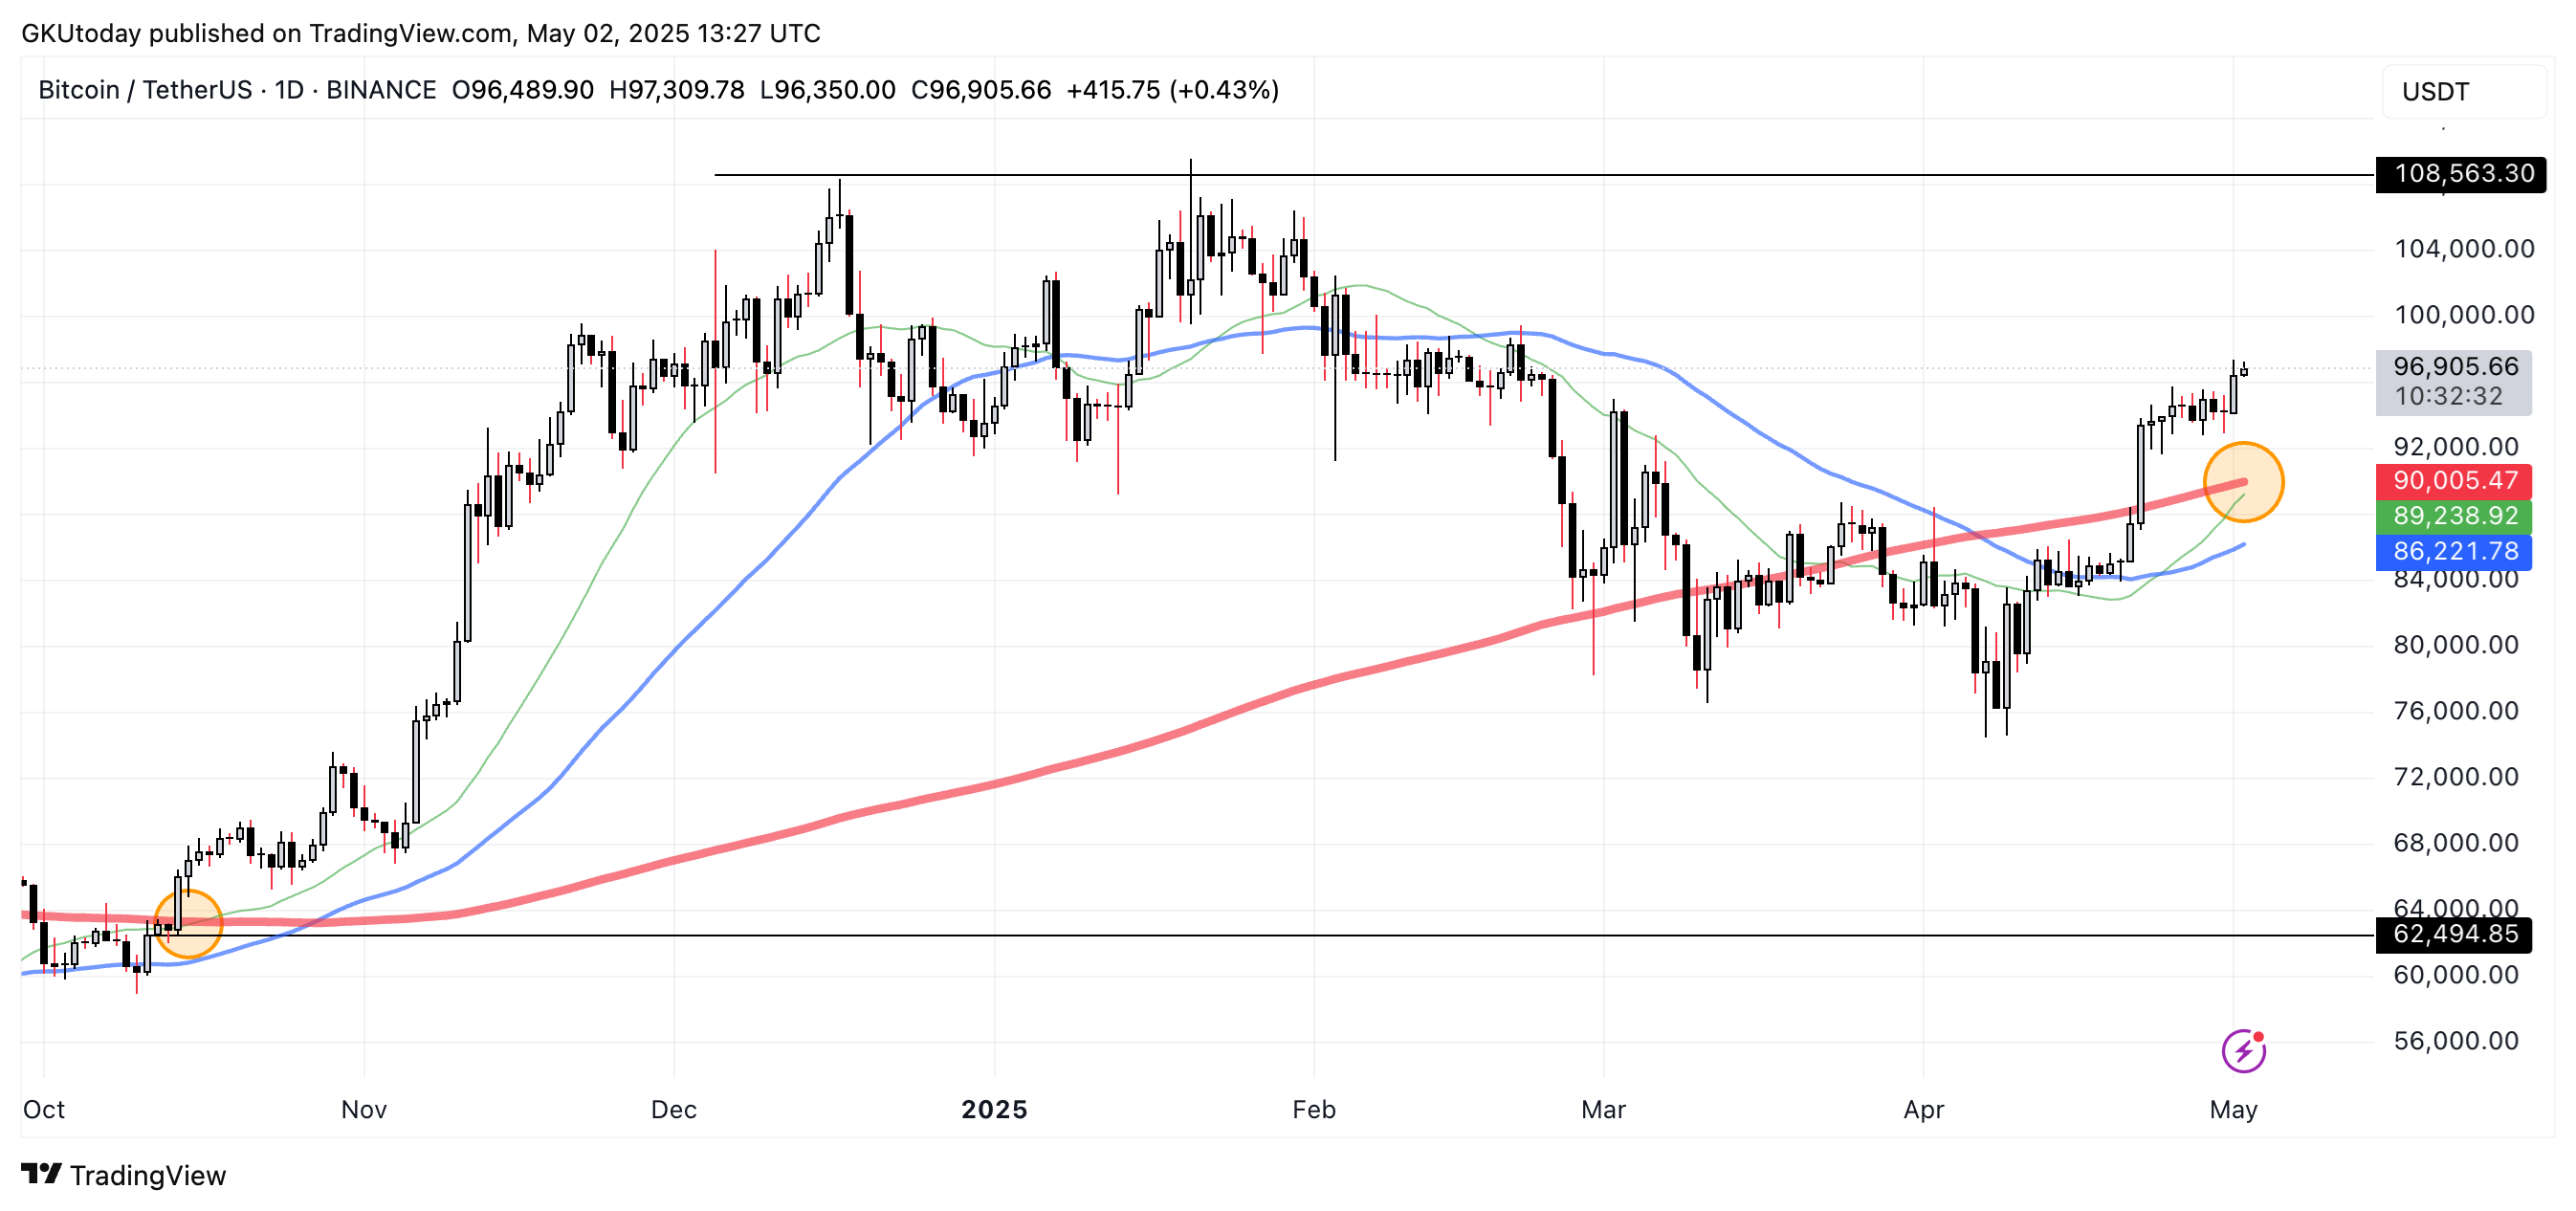
This time, the timing could not be more intriguing. Bitcoin is already trading above $96,000 and eyeing the $108,563 resistance level - the same local top it failed to break in March. With this pattern in play, bulls may now have the technical tailwind they have been waiting for.
The last time $BTC printed this exact cross, the market was similarly consolidating near key resistance before blasting through on renewed volume and institutional inflows. Add to that today's market environment - where the ETFs are flowing and Strategy buys billions every week - and this technical pattern suddenly looks like more than just coincidence.
But bull-minded traders beware: false breakouts and "cross-fakeouts" have happened before. The coming days will be critical in confirming whether history really is repeating itself.