Fast forward to today, Bitcoin is hovering above $94,000, with the Upper Bollinger Band positioned at $108,000. According to Severino, merely reaching this Upper Bollinger Band level, as it did in 2021, is not enough reason to buy Bitcoin in anticipation of a price increase. Instead, the analyst asserts that a full monthly close above $108,000 is needed to confirm a breakout and continuation of the bullish trend.
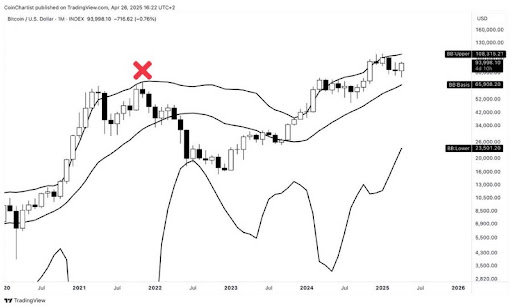
The analyst also disclosed that he would consider buying Bitcoin once it closes sufficiently above this level. However, if the flagship cryptocurrency fails to close above the Upper Bollinger Band for a month, it could mirror the 2021 double top and fake breakout, potentially leading to another steep bear market this cycle.
Overall, Severino advises investors to closely watch Bitcoin’s price action around this key Bollinger Band. He stresses that capital preservation far outweighs succumbing to the Fear Of Missing Out (FOMO). With elevated risks and rising volatility, the analyst believes that clear confirmation signals are the only way to engage with the market safely.
$BTC’s Heikin Ashi Candle Flips Bearish
While Severino confirms the ideal time to buy $BTC, the analyst also announced that the Bitcoin Heikin Ashi candles have turned bearish. The analyst shared a 12-week Heikin Ashi candlestick chart, which shows Bitcoin flashing early warning signs of a potential bear market.
The chart highlights a critical moment where Bitcoin’s Heikin Ashi candle turned red for the first time since its previous price peaks in 2014, 2018, and 2022. Historically, such a signal has marked the beginning of prolonged bear markets and deep price corrections.
Further strengthening the bearish outlook, Severino pointed out that the Fisher Transform, a technical indicator used to detect trend reversals, is exhibiting a bearish crossover, with the green Fisher line dropping below the red Trigger line. In previous cycles, whenever these two signals — the Heikin Ashi and Fisher Transform — aligned, Bitcoin experienced substantial declines that lasted for months, if not years.
Featured image from Pixabay, chart from Tradingview.com

 newsbtc.com