The following chart illustrates this rebound in $BTC’s Apparent Demand, which essentially reflects net changes in one-year inactive supply adjusted by daily block rewards – a metric designed to better represent organic demand growth.
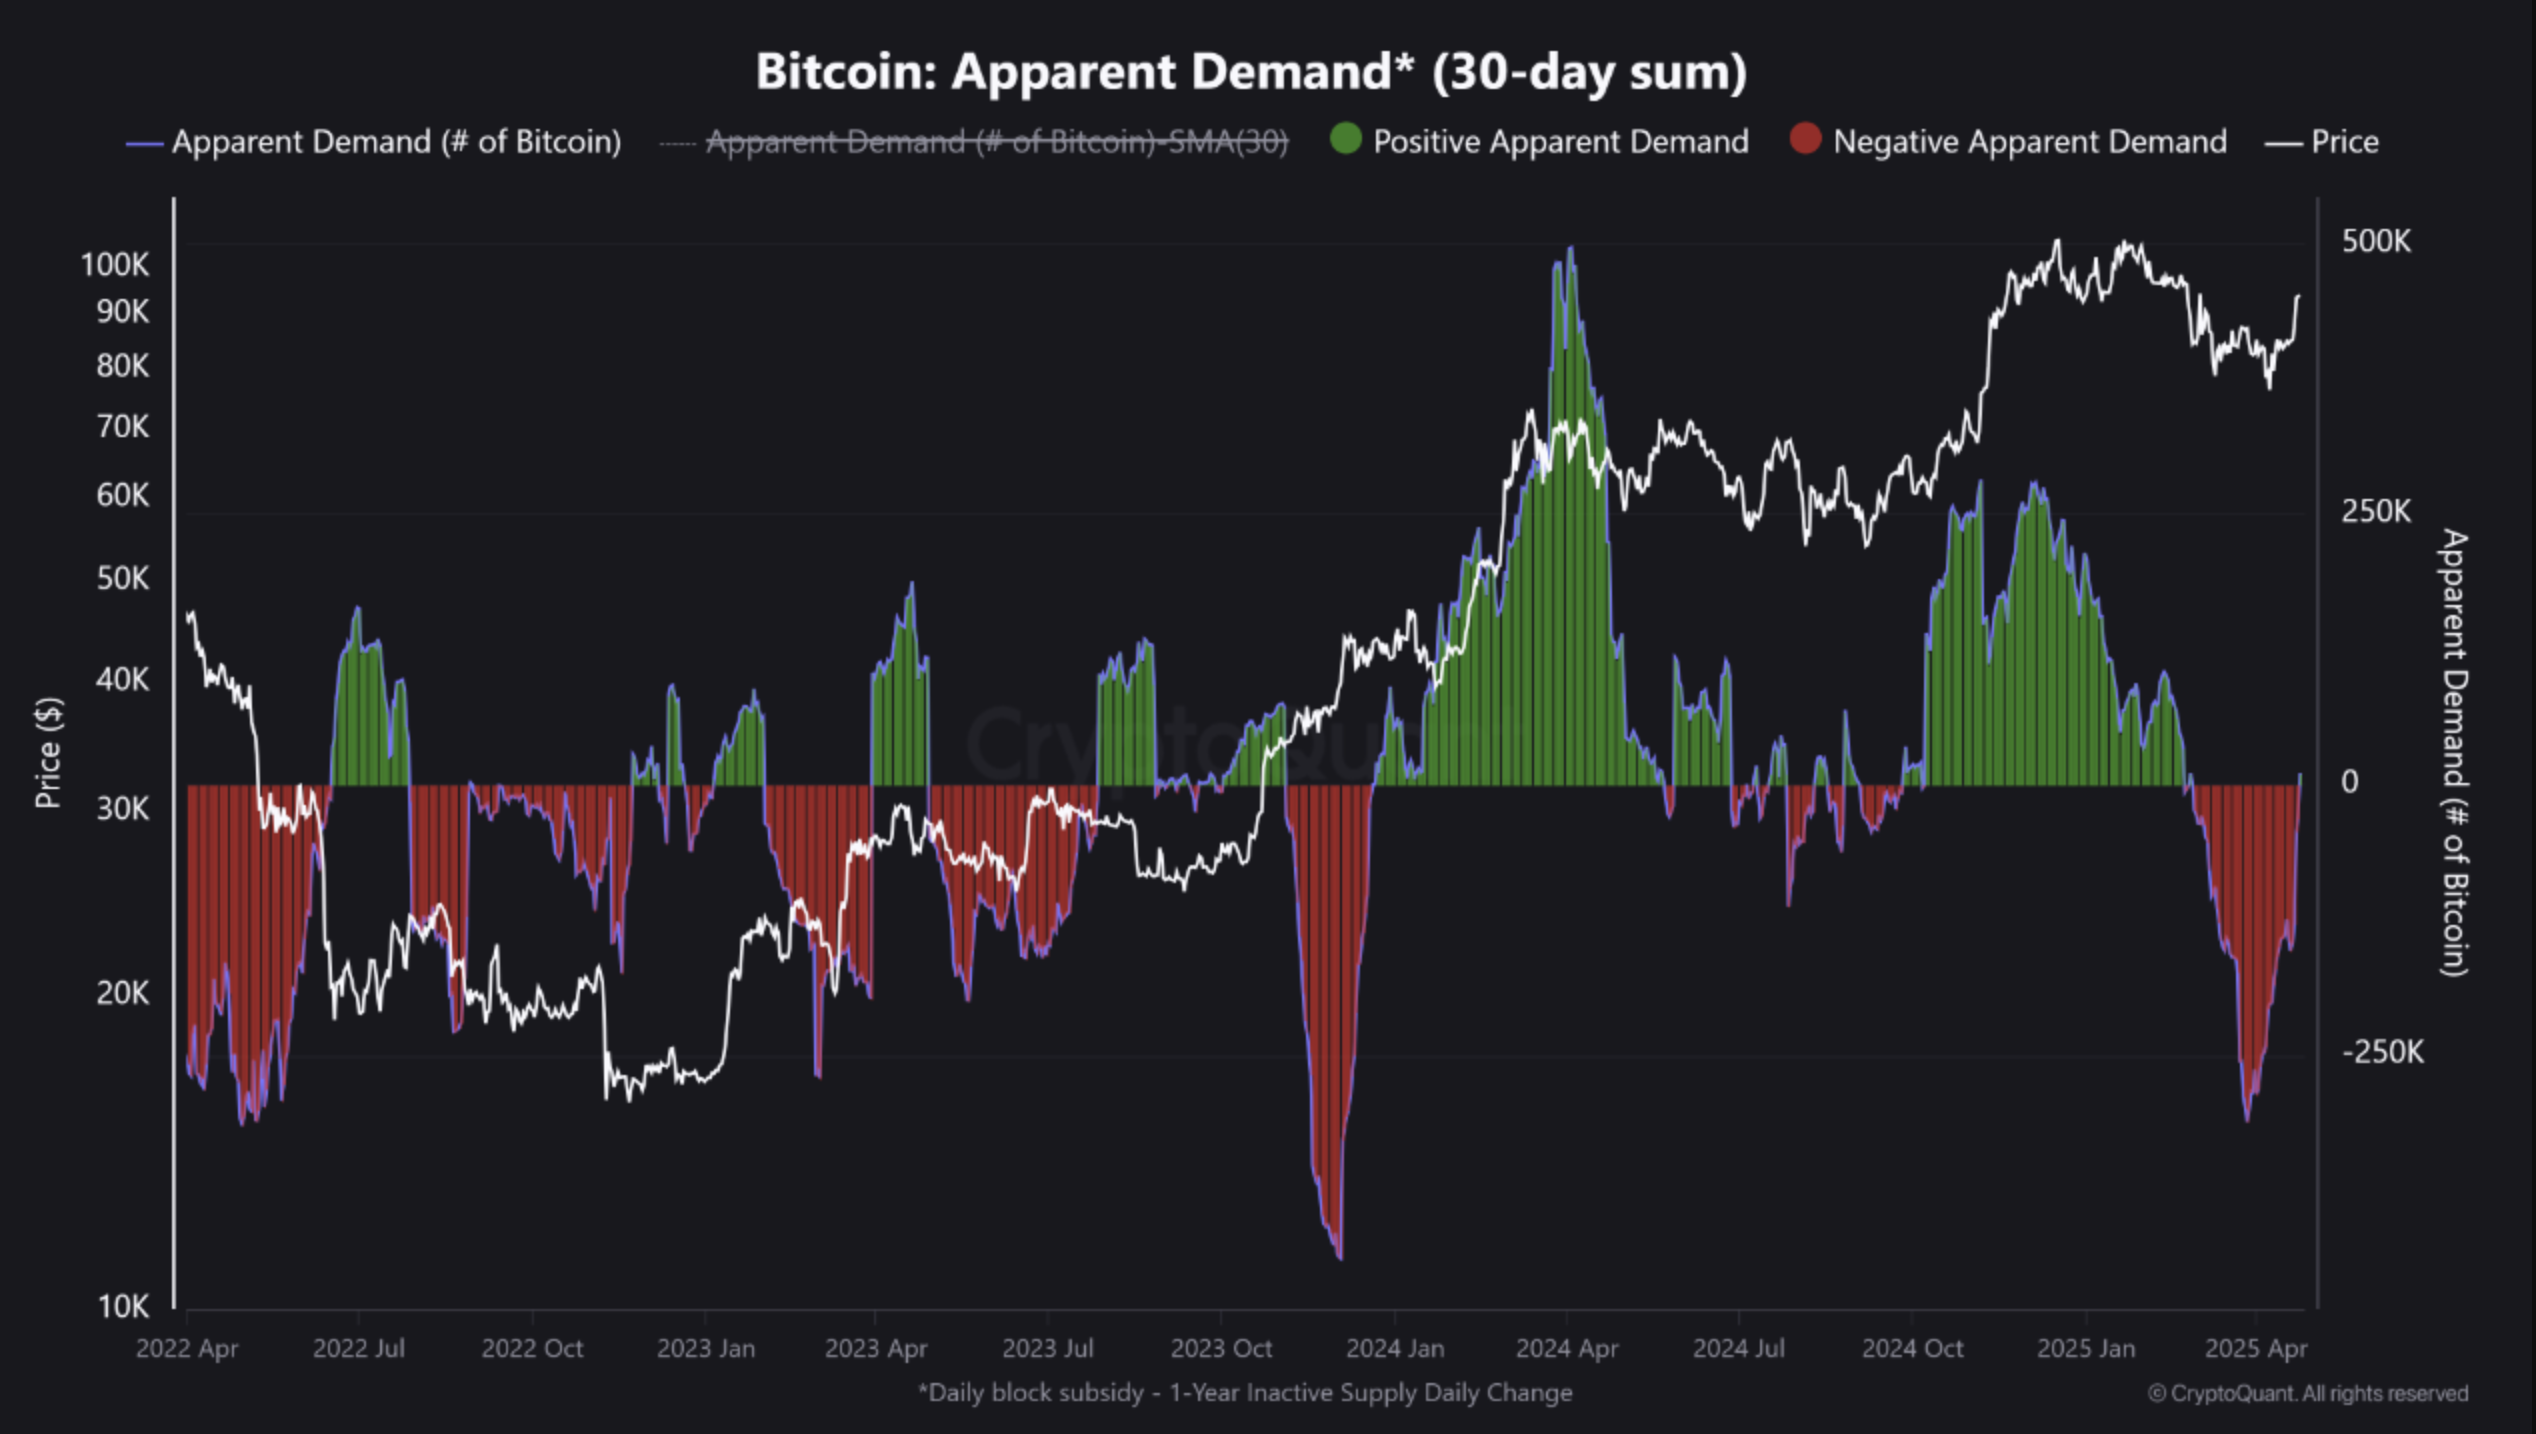
Previously, this metric had fallen deeply into negative territory – dipping below -200,000 (highlighted in red) – suggesting waning demand. However, its recent reversal into positive territory signals that long-dormant capital is flowing back into the market. As noted in the post:
The demand pivot is closely aligned with the recent price rebound above $87K, implying this recovery is underpinned by real on-chain behavior rather than purely speculative flows.
This marks the first positive Apparent Demand reading since February and aligns with rising inflows into spot Bitcoin exchange-traded funds (ETFs), as well as growing accumulation by long-term holders.
Data from SoSoValue shows that US-based spot $BTC ETFs have recorded five consecutive days of net positive inflows, totalling more than $2.5 billion. The cumulative net inflow into spot $BTC ETFs now stands at an impressive $38.05 billion.
Is A $BTC Rally In Sight?
IT Tech noted that past reversals in Apparent Demand have historically preceded either significant rallies or periods of strong price support. If the current trend continues, $BTC may have the momentum needed to challenge the $90,000 level in the near term.
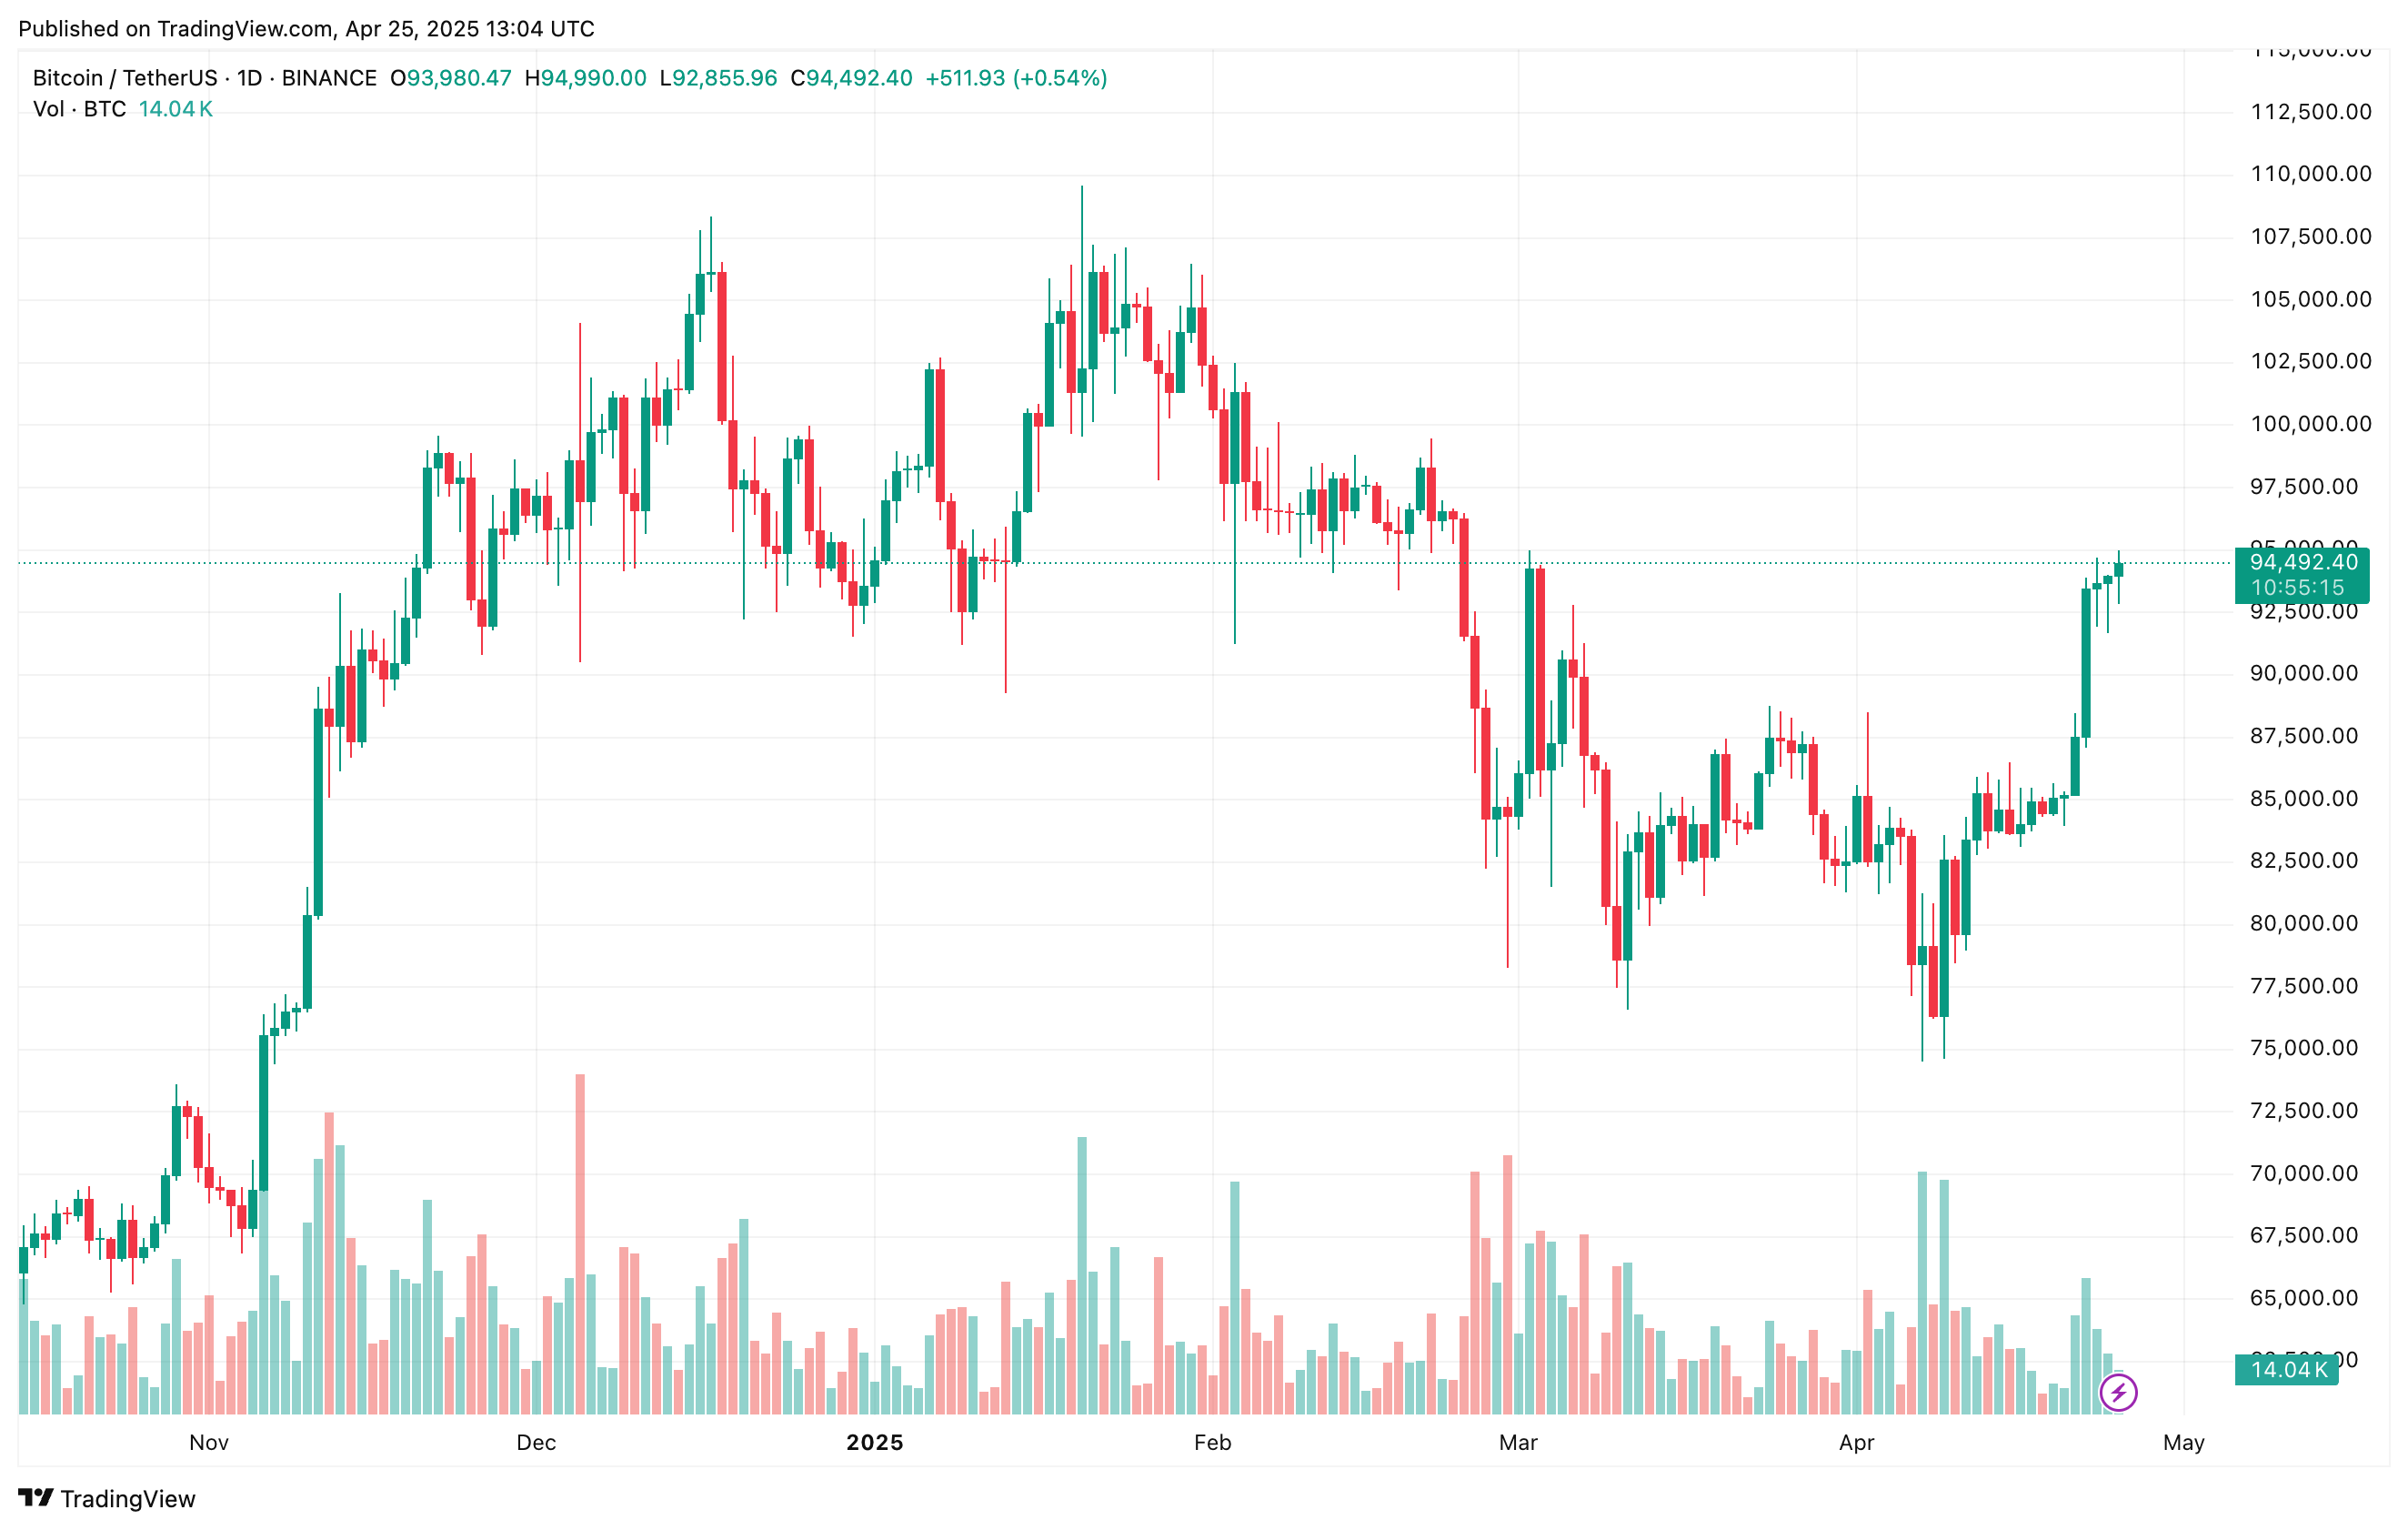
However, analysts caution that Bitcoin must hold its current support around $91,500 to maintain upward momentum. This level is particularly important because it is close to the realized price of short-term $BTC holders, according to CryptoQuant contributor Crazzyblockk.
Further adding to this outlook, prominent crypto analyst Rekt Capital emphasized that Bitcoin needs to secure a weekly close above $93,500 and reclaim it as support in order to establish a clear path to $100,000. At press time, $BTC trades at $94,492, up 2% in the last 24 hours.
Featured image from Unsplash, charts from CryptoQuant and Tradingview.com

 newsbtc.com