
Bitcoin ($BTC USD) has often traded in tandem with the US stock market indices, the Nasdaq Composite and S&P 500.
However, onchain data analytics provider CryptoQuant has revealed a negative correlation between Bitcoin and Nasdaq.
The price of Bitcoin has increased by over 10% over the past week, whereas the Nasdaq plummeted drastically, within the same period.
Insight on the Chart Decoupling
CryptoQuant shared a screenshot of the $BTC and S&P 500 Index correlation in an X post.
The chart shows that the historical correlation between $BTC USD and the stock market has broken. The stock market and $BTC are now moving in quite the opposite direction.
CryptoQuant analyst oinonen_t noted that the Bitcoin correlation with Nasdaq, which stood at 0.91 in January, has reduced to 0.83.
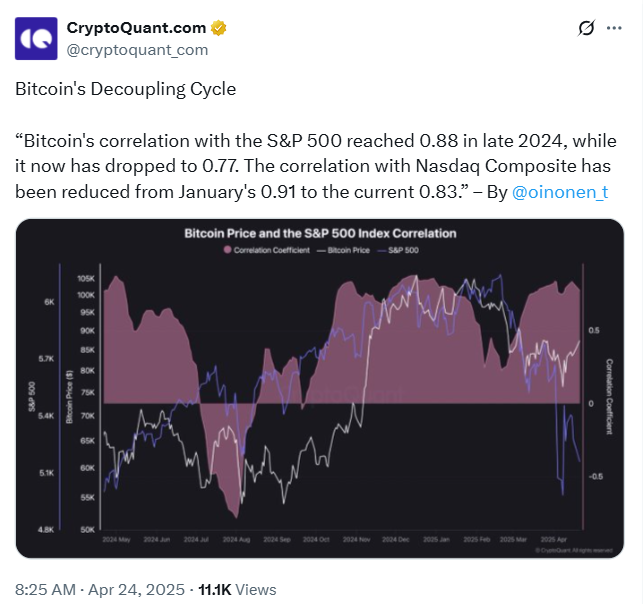
Likewise, the correlation with the S&P 500 has dropped to 0.77 from 0.88 in late 2024.
Bitcoin’s price has remained relatively stable since US President Donald Trump declared a pause on global tariffs.
The flagship coin is up 10.3% in the past week. The weekly spike comes as Bitcoin continued recouping its losses from ‘Liberation Day,’ rising 3.3% to $90,750.
Meanwhile, traditional assets shuddered. The Nasdaq and S&P 500 indexes have declined by 4.6% and 5.2%, respectively, in the past month.
Bitcoin’s decoupling from traditional “risk-on” assets marks the beginning of a significant shift.
It indicates Bitcoin’s unique value proposition as a scarce, decentralized, and globally accessible asset is increasingly resonating with investors.
As more investors adopt Bitcoin amid ongoing geopolitical tensions, $BTC’s price is expected to hit a new all-time high.
$BTC USD Correlation to Nasdaq Turns Positive
Mike McGlone, a Senior Community Strategist at Bloomberg Intelligence, has drawn attention to Bitcoin’s 100-day correlation to the Nasdaq. He noted that the correlation has turned favorable to 0.52.
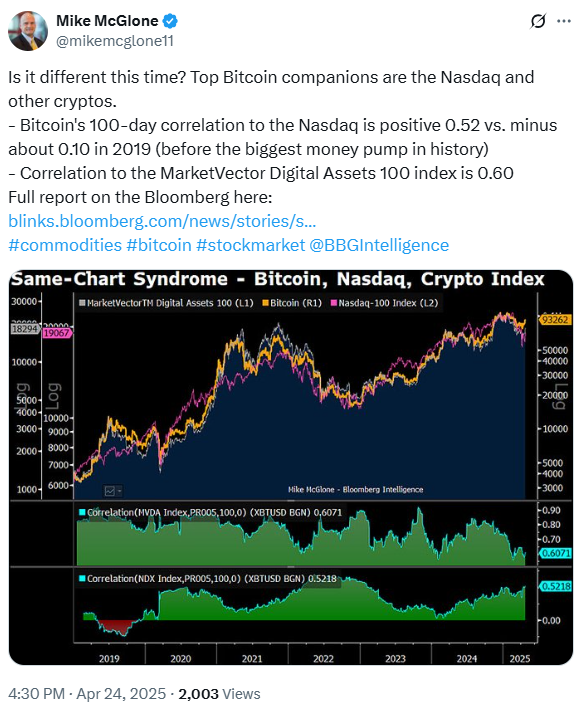
This value marks a massive move from the negative value recorded in 2019 (before the largest money pump in history).
During this period, the correlation fell to -0.10. It is important to note that the 100-day correlations often turn negative during or following substantial Bitcoin drawdowns.
Simply put, a “positive” correlation indicates that Bitcoin and Nasdaq are moving in the same direction.
On the other hand, a negative correlation shows the assets are moving in the opposite direction.
Market Analyst Spotlight Bullish Signal
$BTC USD price was trading at $93,529 at press time, up 0.13% over the past 24 hours. While Bitcoin has moved past key crucial levels, market analysts claim more rallies lie ahead.
Popular onchain analyst Ali Martinez has spotlighted a key bullish signal for the leading cryptocurrency.
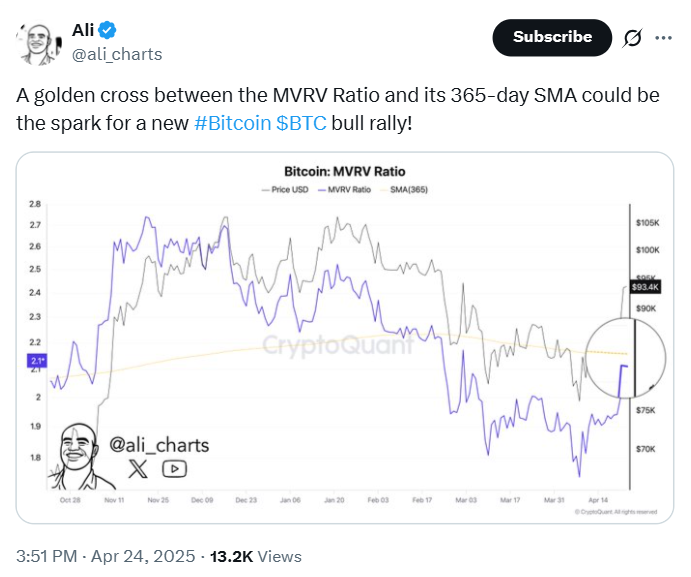
The analyst noted that a golden cross pattern has formed between the MVRV Ratio and its 365-day SMA. Ali claims this pattern could indicate the continuation of an ongoing Bitcoin bull run.
Notably, a golden cross happens when a short-term moving average crosses above a long-term moving average, signaling potential sustained upward momentum.
Market analysts point to the $92,000 level as critical support on the $BTC Chart.
With Bitcoin currently holding above this key support, the golden cross of the MVRV and 365-day SMA could reinforce bullish sentiment.
Bitcoin could easily cross the $100,000 psychological level in the next few days.