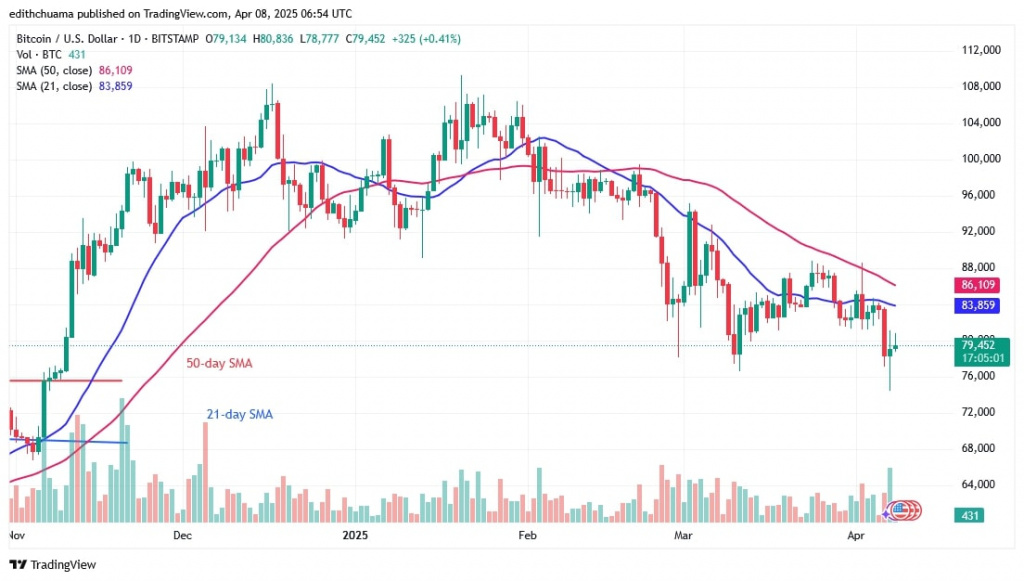
On the other hand, Bitcoin will fall if it is rejected at the top of $80,000. The largest cryptocurrency will fall to $68,980 if Bitcoin breaks the 21-day SMA support. Bitcoin's current value is $79,093 at the time of this writing.
$BTC price indicator analysis
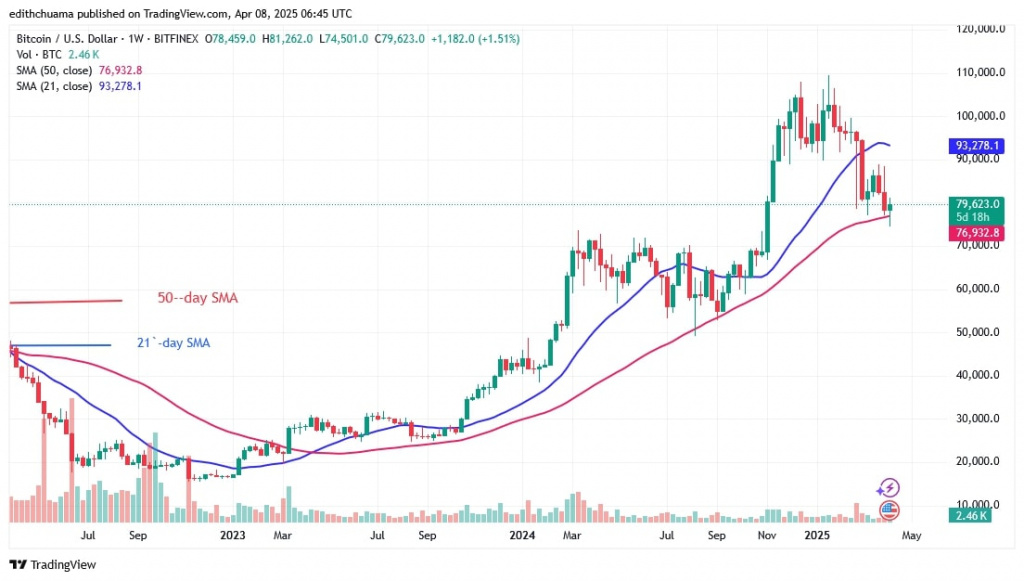
Bitcoin is trapped between the 21-day SMA support and the 50-day SMA resistance. In other words, Bitcoin is trading between its high of $92,000 and its low of $77,000.
Bitcoin will start a trend if the 21-day SMA support and the 50-day SMA barrier are broken. The moving average lines leaning south show a bearish trend. The moving average lines on the weekly chart sloping north show the previous uptrend.
Technical indicators
Key supply zones: $108,000, $109,000, $110,000
Key demand zones: $90,000, $80,000, $70,000
What is the next move for Bitcoin?
Bitcoin price is currently trading above the $77,000 support and below the moving average lines, and the uptrend is meeting resistance at the $80,000 high.
The daily chart shows that Bitcoin is falling below the moving average lines and that the bears will have the upper hand over the bulls as long as they are in the bearish trend zone.
Disclaimer. This analysis and forecast are the personal opinions of the author. They are not a recommendation to buy or sell cryptocurrency and should not be viewed as an endorsement by CoinIdol.com. Readers should do their research before investing in funds.

 coinidol.com