The Stablecoin Ratio Channel is at historic buy zones, indicating rising accumulation potential. While that’s happening, stablecoin market cap growth indicates that capital is staying in crypto and could power the next breakout for Bitcoin price as it consolidates.
Stablecoin Ratio Channel Points to Market Opportunity
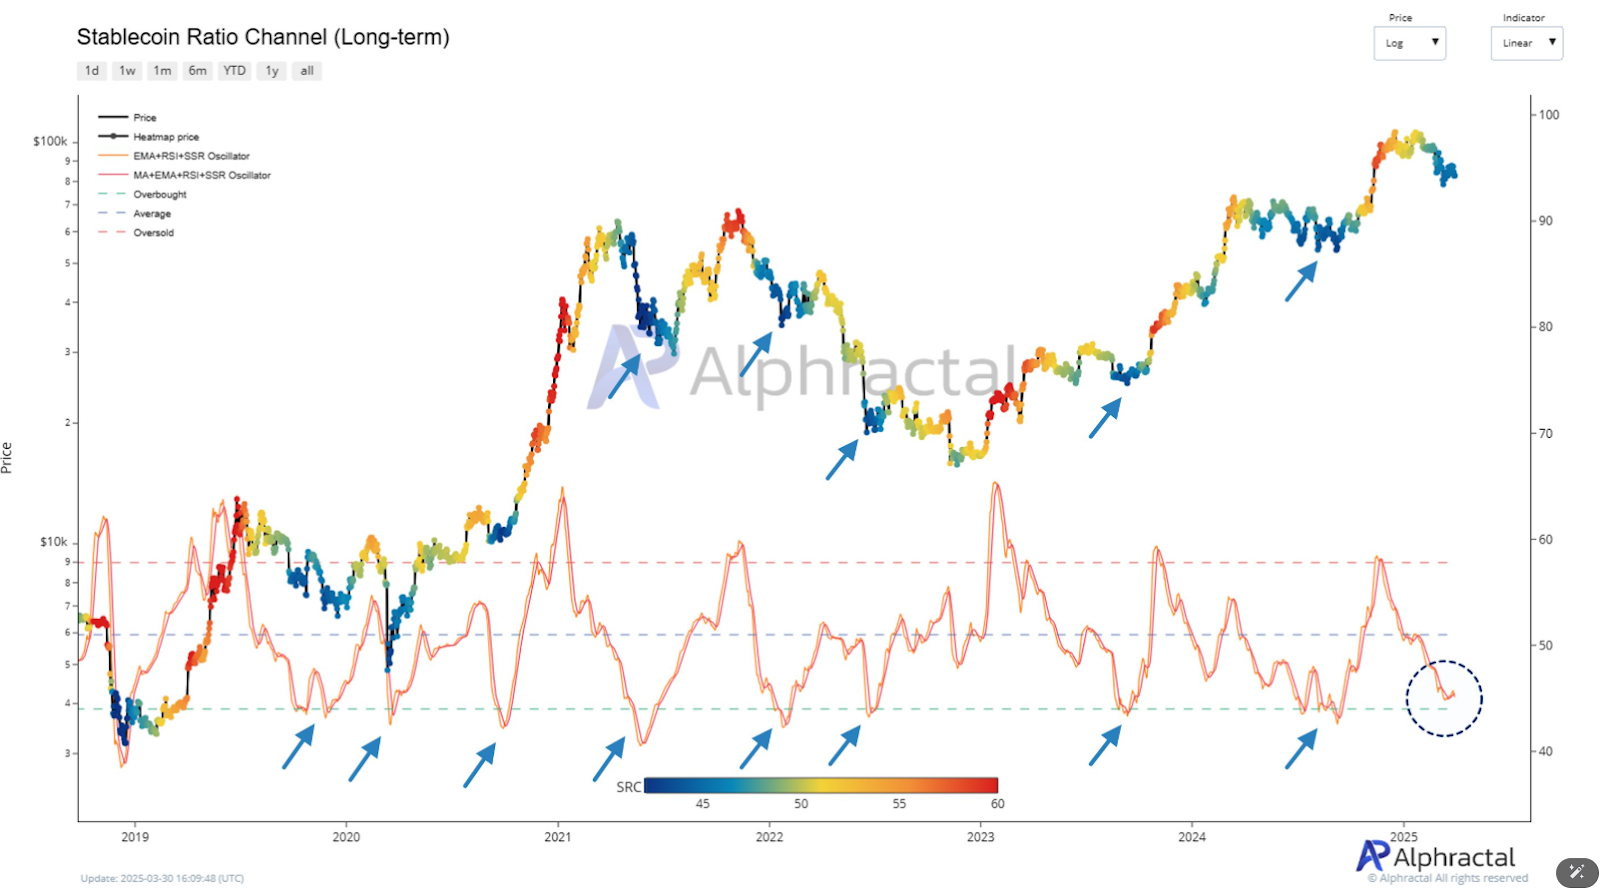
According to Alphractal, the current value of the oscillator is close to the lower dotted green line in the Stablecoin Ratio Channel (SRC) chart. In the past, this level has often been followed by market bottoms.
The Stablecoin Supply Ratio (SSR) that the SRC uses is a ratio of Bitcoin’s market cap to the total market cap of stablecoins. If the SSR is low, it implies that there are a lot of stablecoins relative to Bitcoin, and therefore buying power is on the sidelines.

Bitcoin’s price has often rebounded each time the SRC has dropped near or below the green “oversold” zone, when the reading is around 3.5. Past examples include mid-2020, mid-2021, and late-2022. As can be seen on the chart, the current oscillator reading is approaching that level once again.
The data also uses a smoothed oscillator by combining the SSR with RSI and EMA filters to suppress the market noise.
Currently, this oscillator is approaching that territory and has not yet crossed the buy signal threshold. “Yet, a major buying signal hasn’t happened… but market conditions are starting to line up for a strong entry point,” Alphractal said.
Stablecoin Market Cap Expands as Bitcoin Price Consolidates
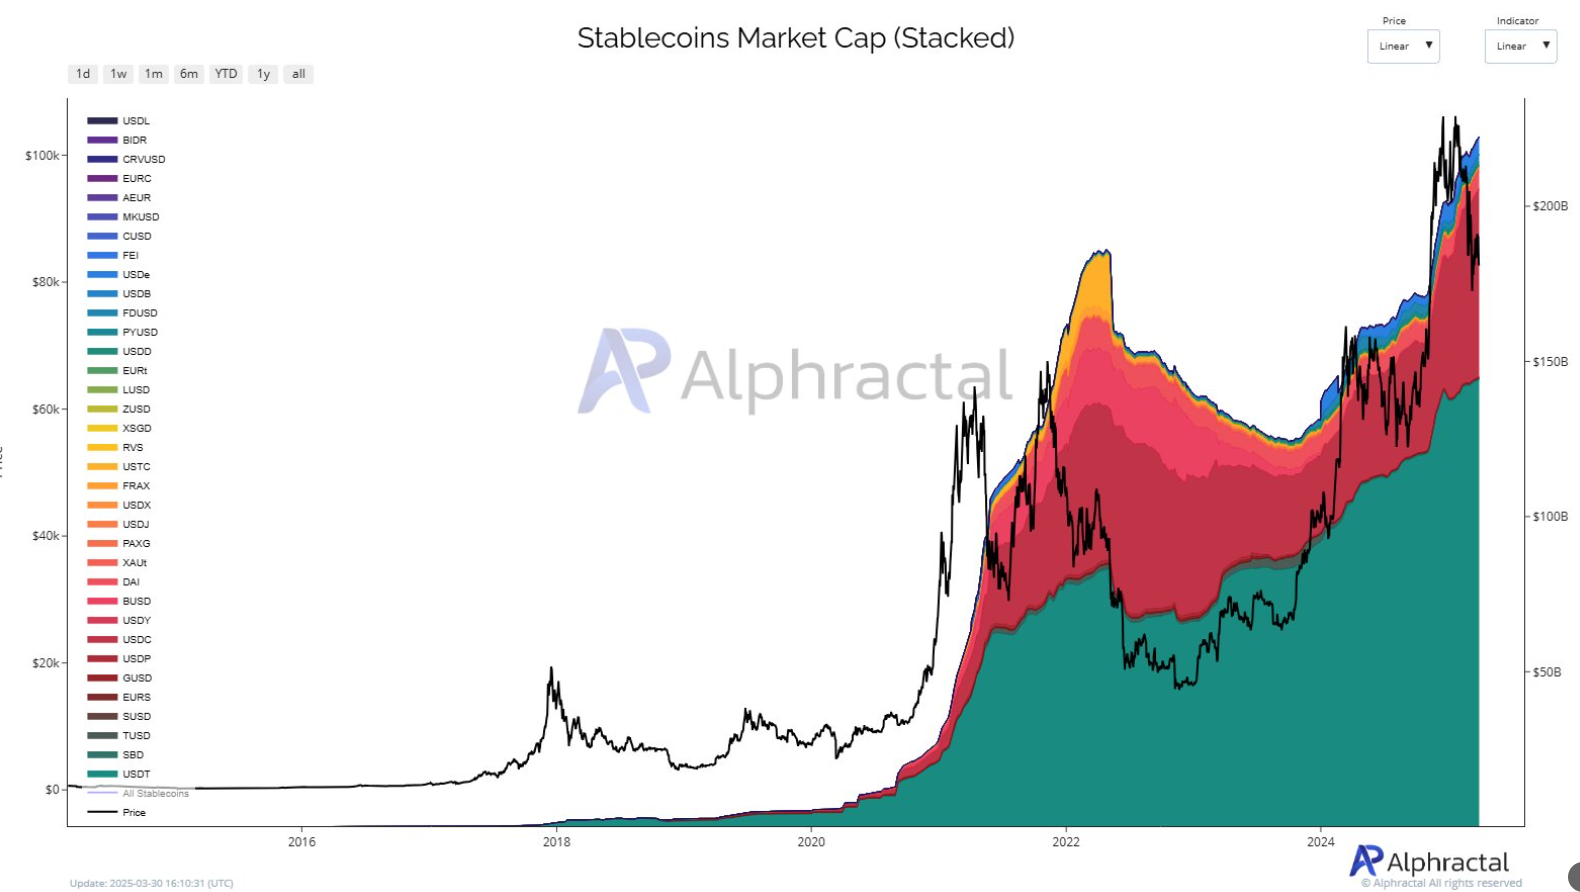
Alphractal also has another chart that shows Bitcoin’s price and the total stablecoin market cap. As of late March 2025, the stablecoin market cap is over $150 billion and growing. The growth is being driven by new stablecoin issuances and conversions from altcoins.

Historically, when the price of Bitcoin is stagnant, the stablecoin supply increases, which precedes the market rally. USDT still has the largest share of the stablecoin market, followed by USDC and DAI.
Currently, bitcoin’s price is consolidating around $82,000 while stablecoin supply increases. This setup has previously led to higher prices when accumulation ends and capital returns to risk assets.
Logarithmic Growth Model Suggests Higher Targets
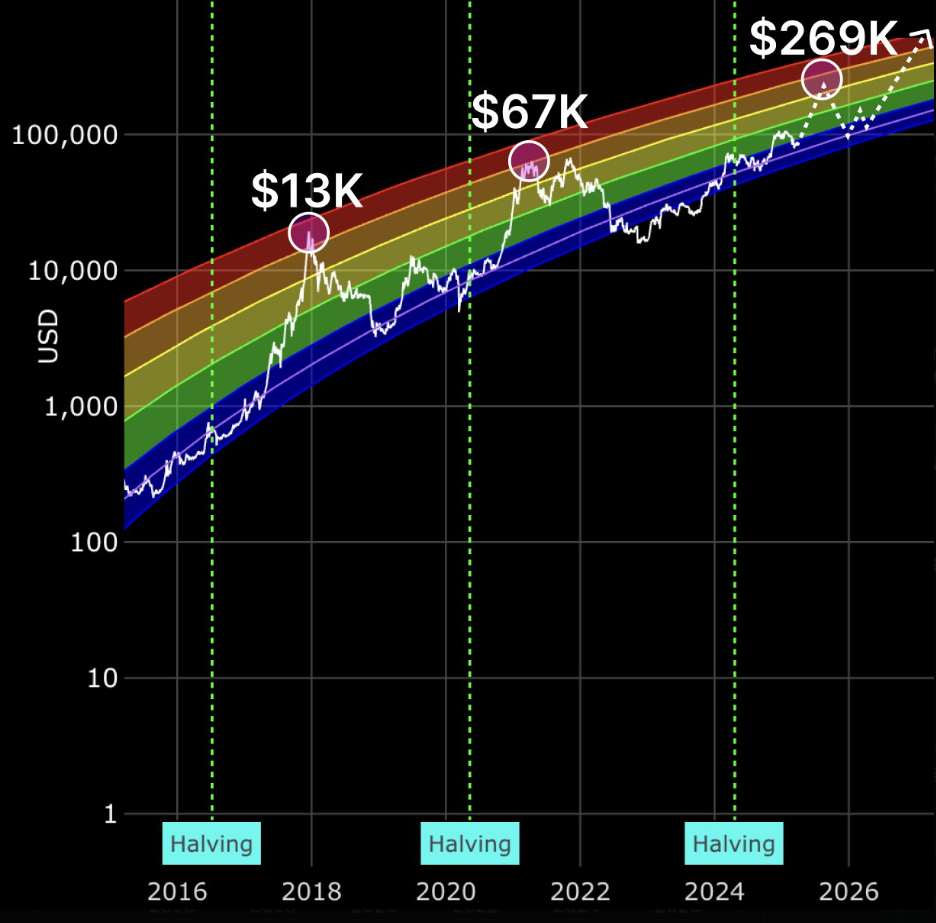
Meanwhile, CryptoAtlas shared a rainbow chart that shows Bitcoin’s long-term price trend using a logarithmic regression model. After each halving event, there is a peak. The model predicts that the next target could hit as high as $269,000.

After the 2016 halving, the model aligns with the previous market tops at $13,000 and after the 2020 halving at $67,000. Historical patterns show that major price increases happen 12 to 18 months after the next halving, which happened in April 2024.
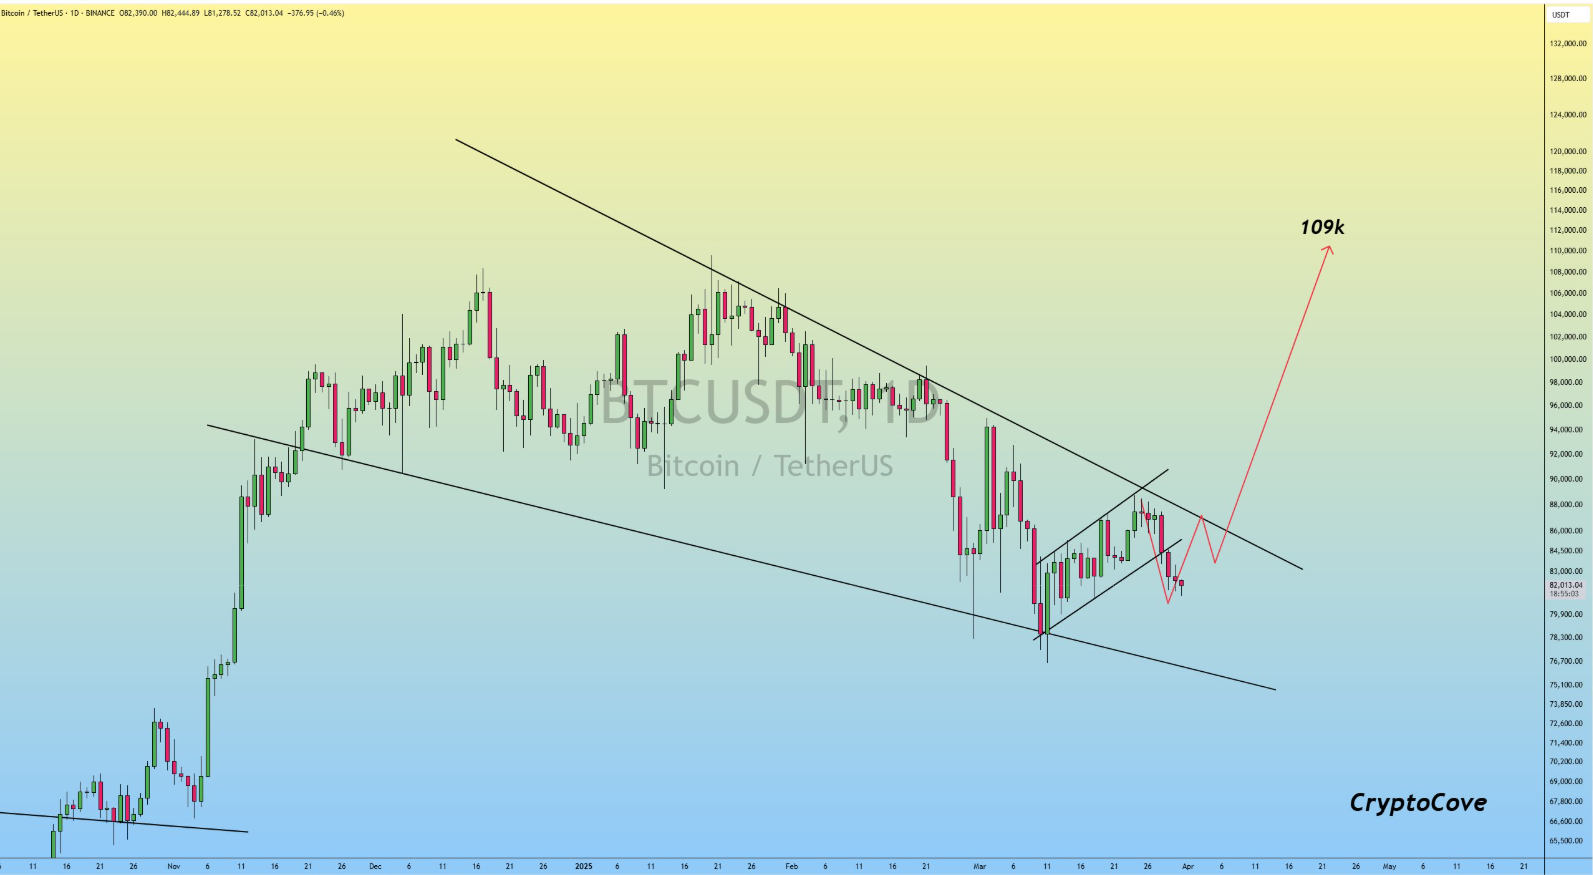
Moreover, CryptoFaibik’s chart shows a falling wedge pattern on the daily BTC/USDT chart. Since December 2024, this formation has been forming. The price has recently bounced from its lower boundary and the wedge is narrowing.

An upside breakout is expected by the analyst in early April. The widest part of the wedge added to the breakout point is the target projected by the pattern, which is $109,000.
 thecoinrepublic.com
