
Bitcoin’s price is currently $84,160, with a market capitalization of $1.66 trillion and a 24-hour trading volume of $15.07 billion. The 24-hour intraday price range spans from $83,238 to $84,492, suggesting steady price compression as traders await a breakout signal.
Bitcoin
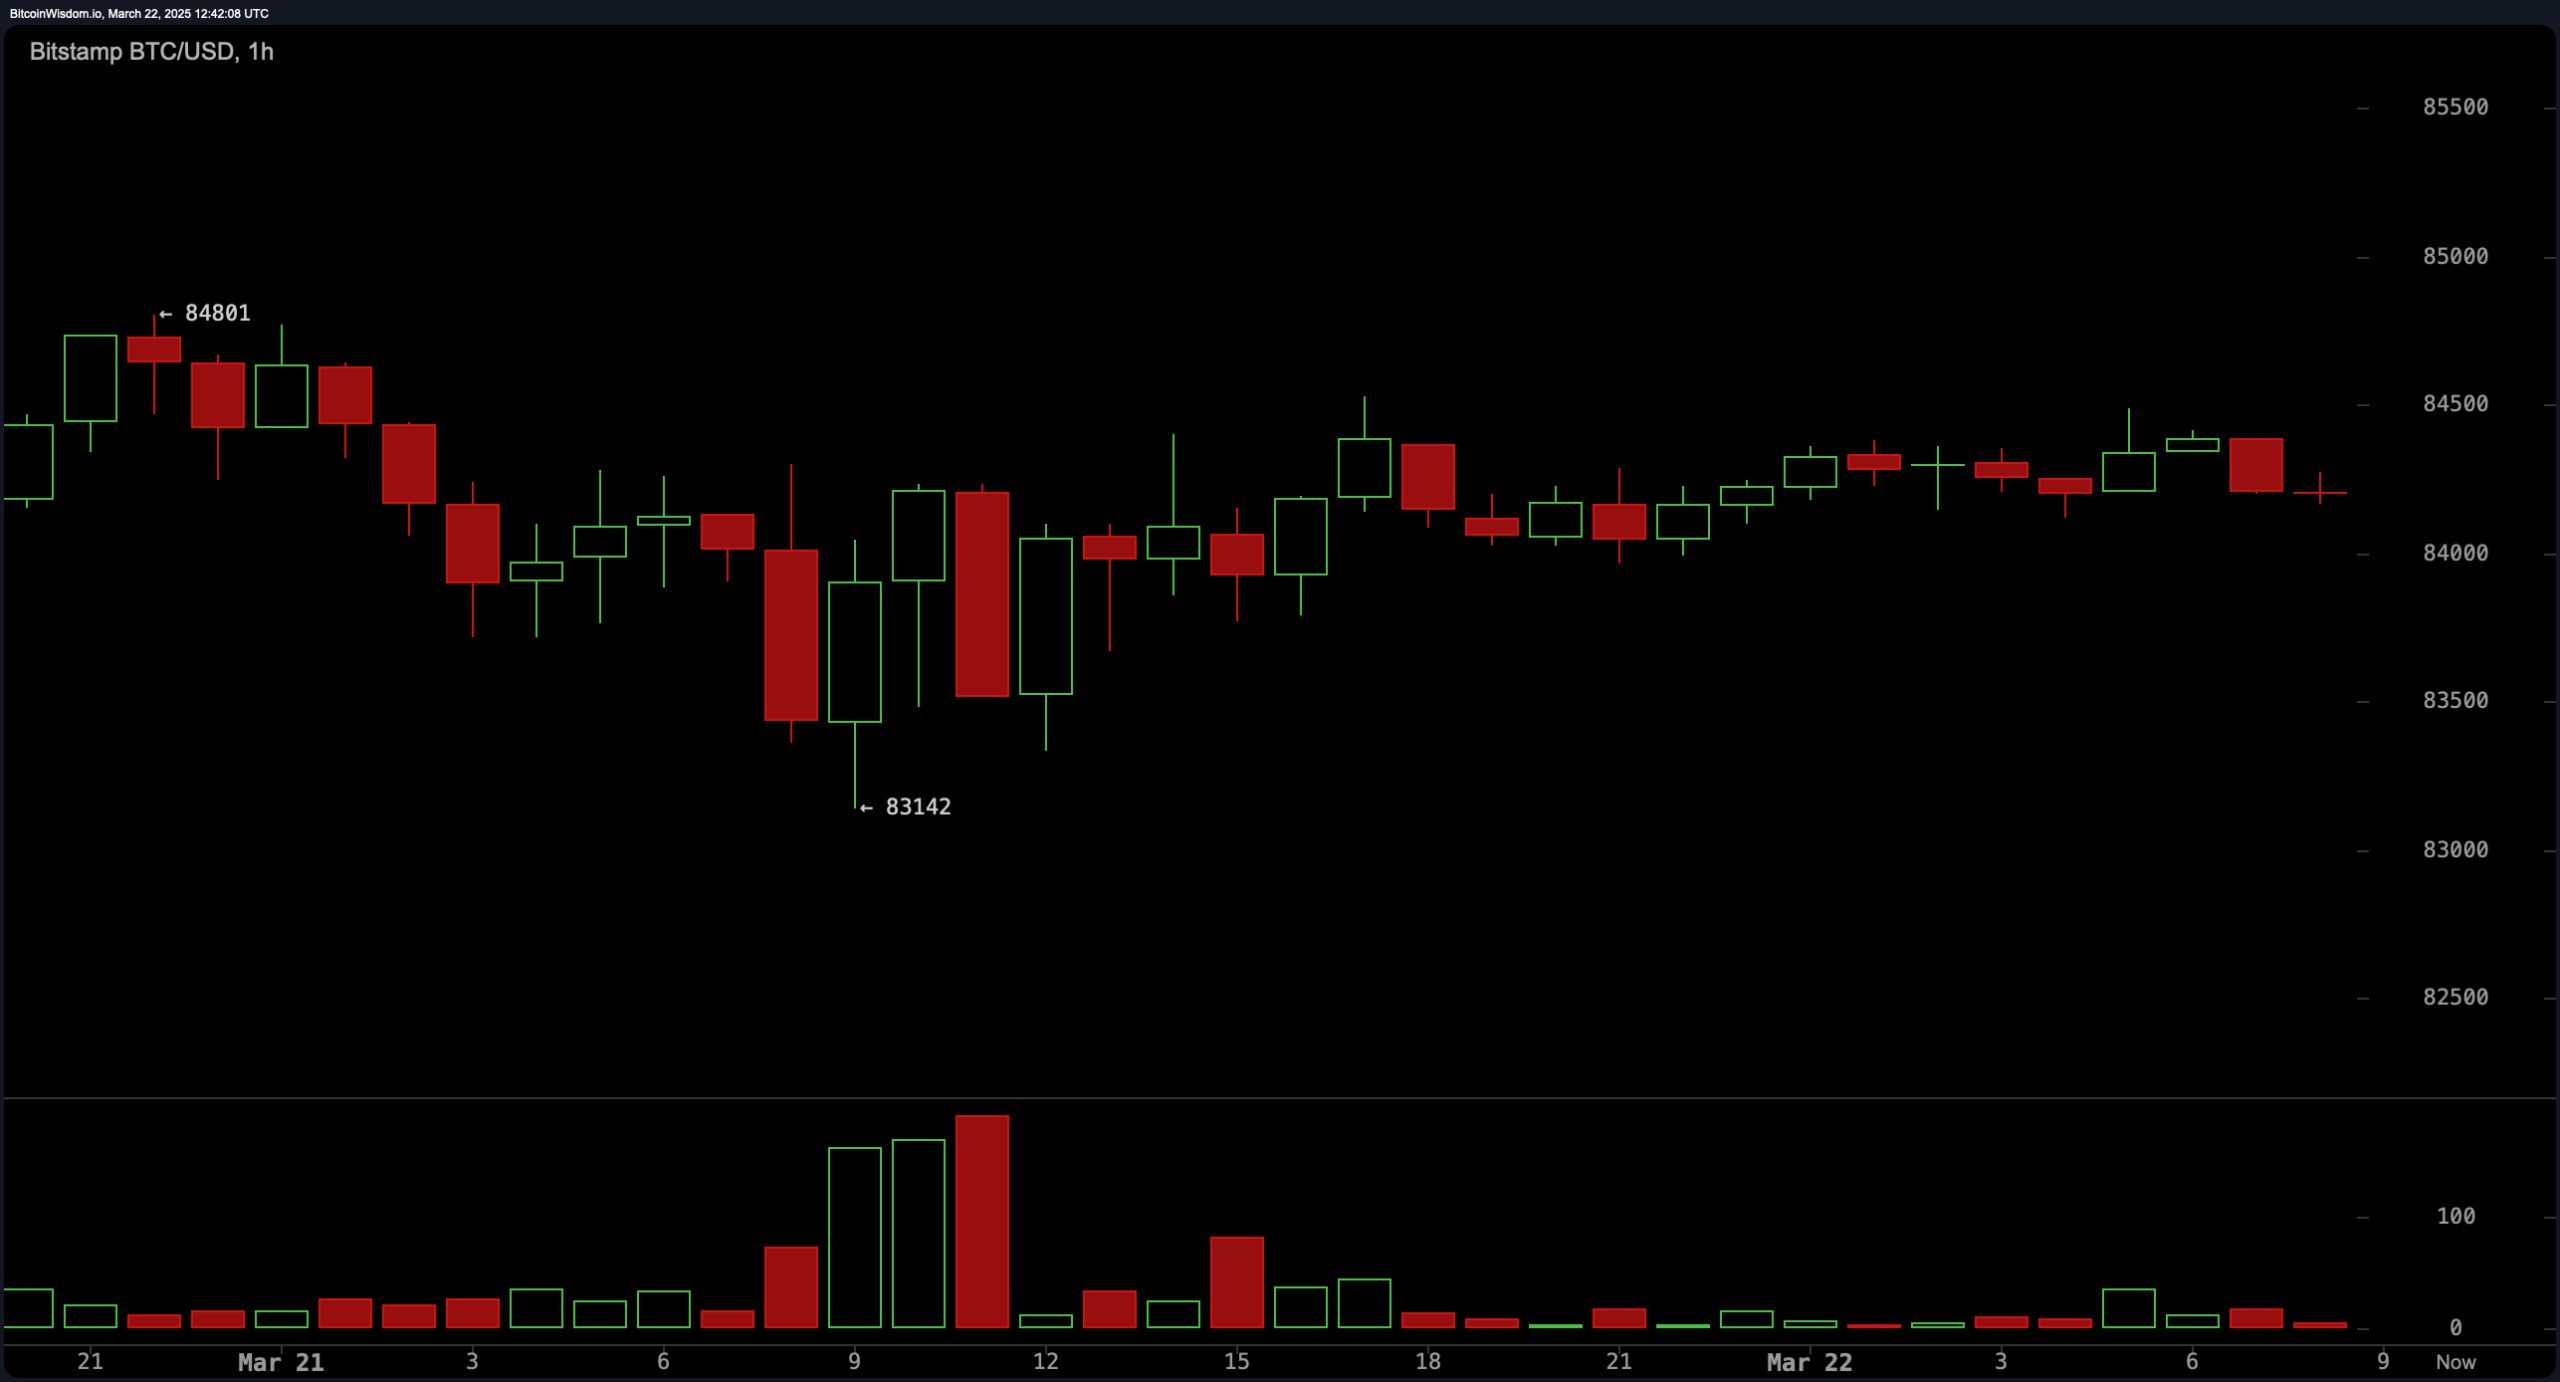
On the 1-hour chart, bitcoin is exhibiting a tight trading band between $83,000 and $84,500, showing signs of accumulation with a series of higher lows after rebounding from $83,142. Entry points for aggressive scalpers are forming between $83,500 and $84,000, with suggested exits around $85,000 to $85,500. However, low trading volume in recent sessions underscores the need for caution, as any move lacks momentum confirmation. A conservative long entry would ideally be placed above the $84,800 mark, contingent on stronger volume confirmation to justify the upward extension.
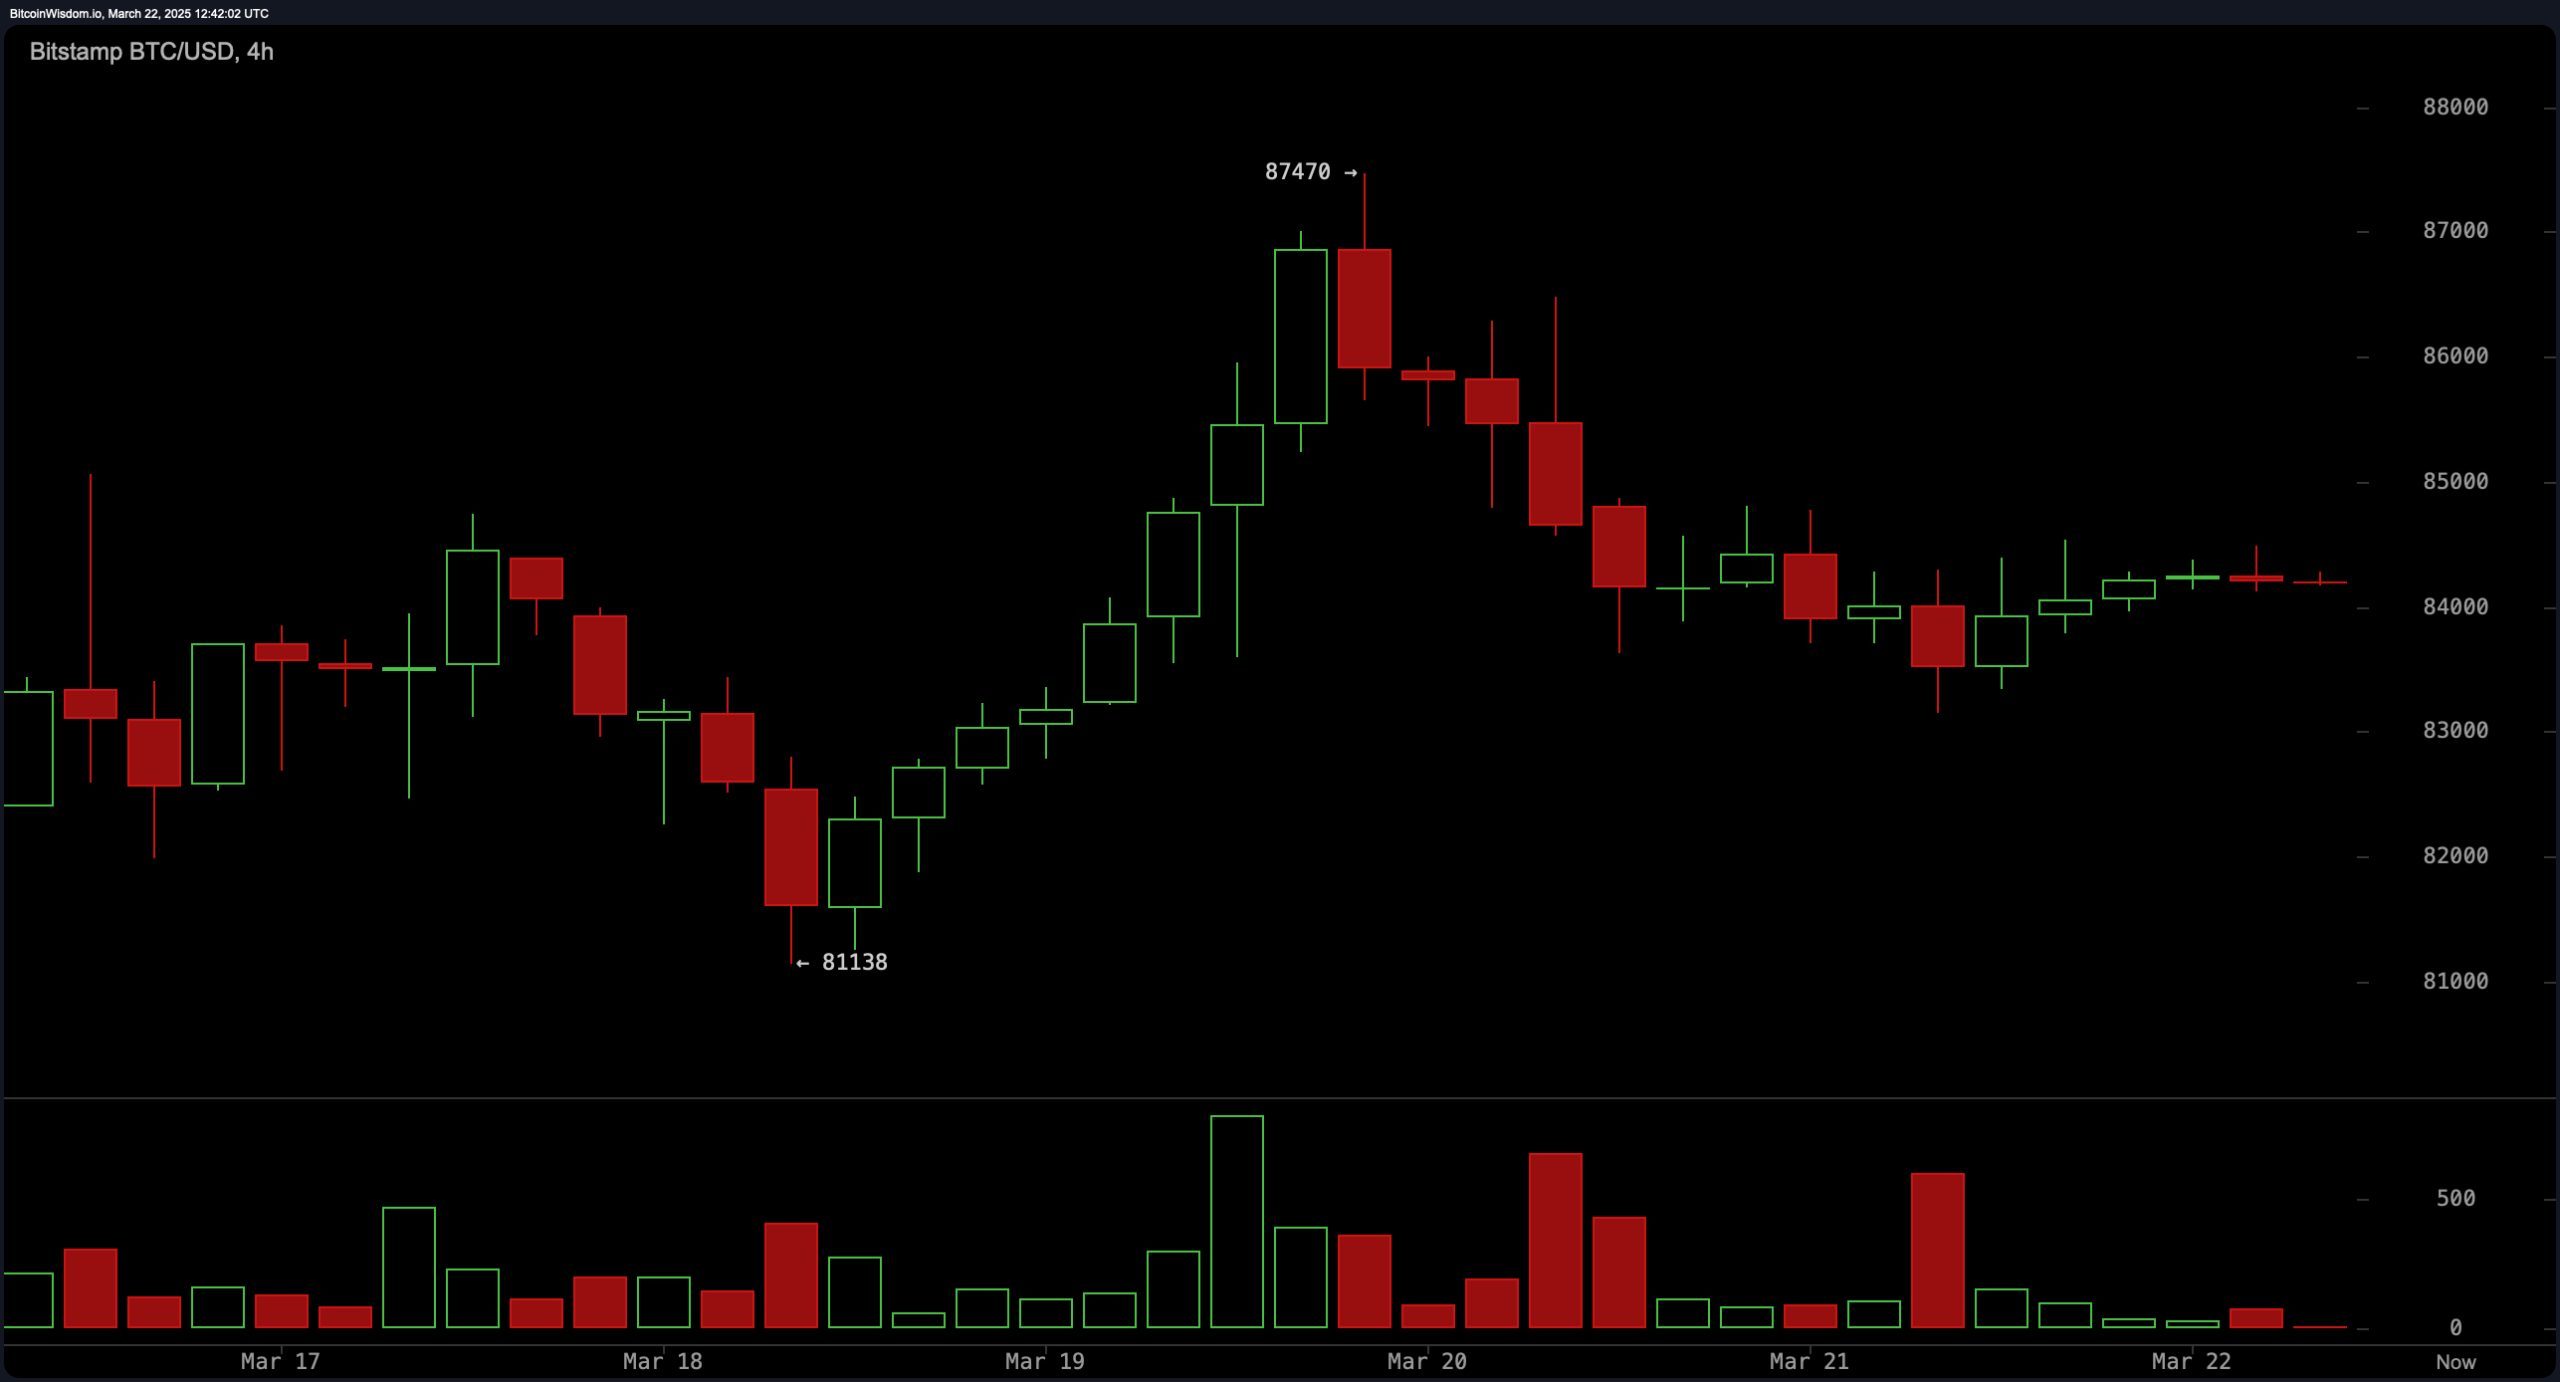
From the 4-hour perspective, bitcoin has stabilized after a short-term bounce off the $81,138 level. The asset is currently locked in a consolidation channel between $83,000 and $84,500, with resistance seen near $85,000. The recent bullish push that began on March 19–20 has so far failed to produce a clean breakout, suggesting that any upward move remains tentative. A breakout above $84,800–$85,000 could initiate a climb toward $87,000, whereas failure to hold above $83,000 could reverse momentum and trigger a test of the $81,000 support zone.
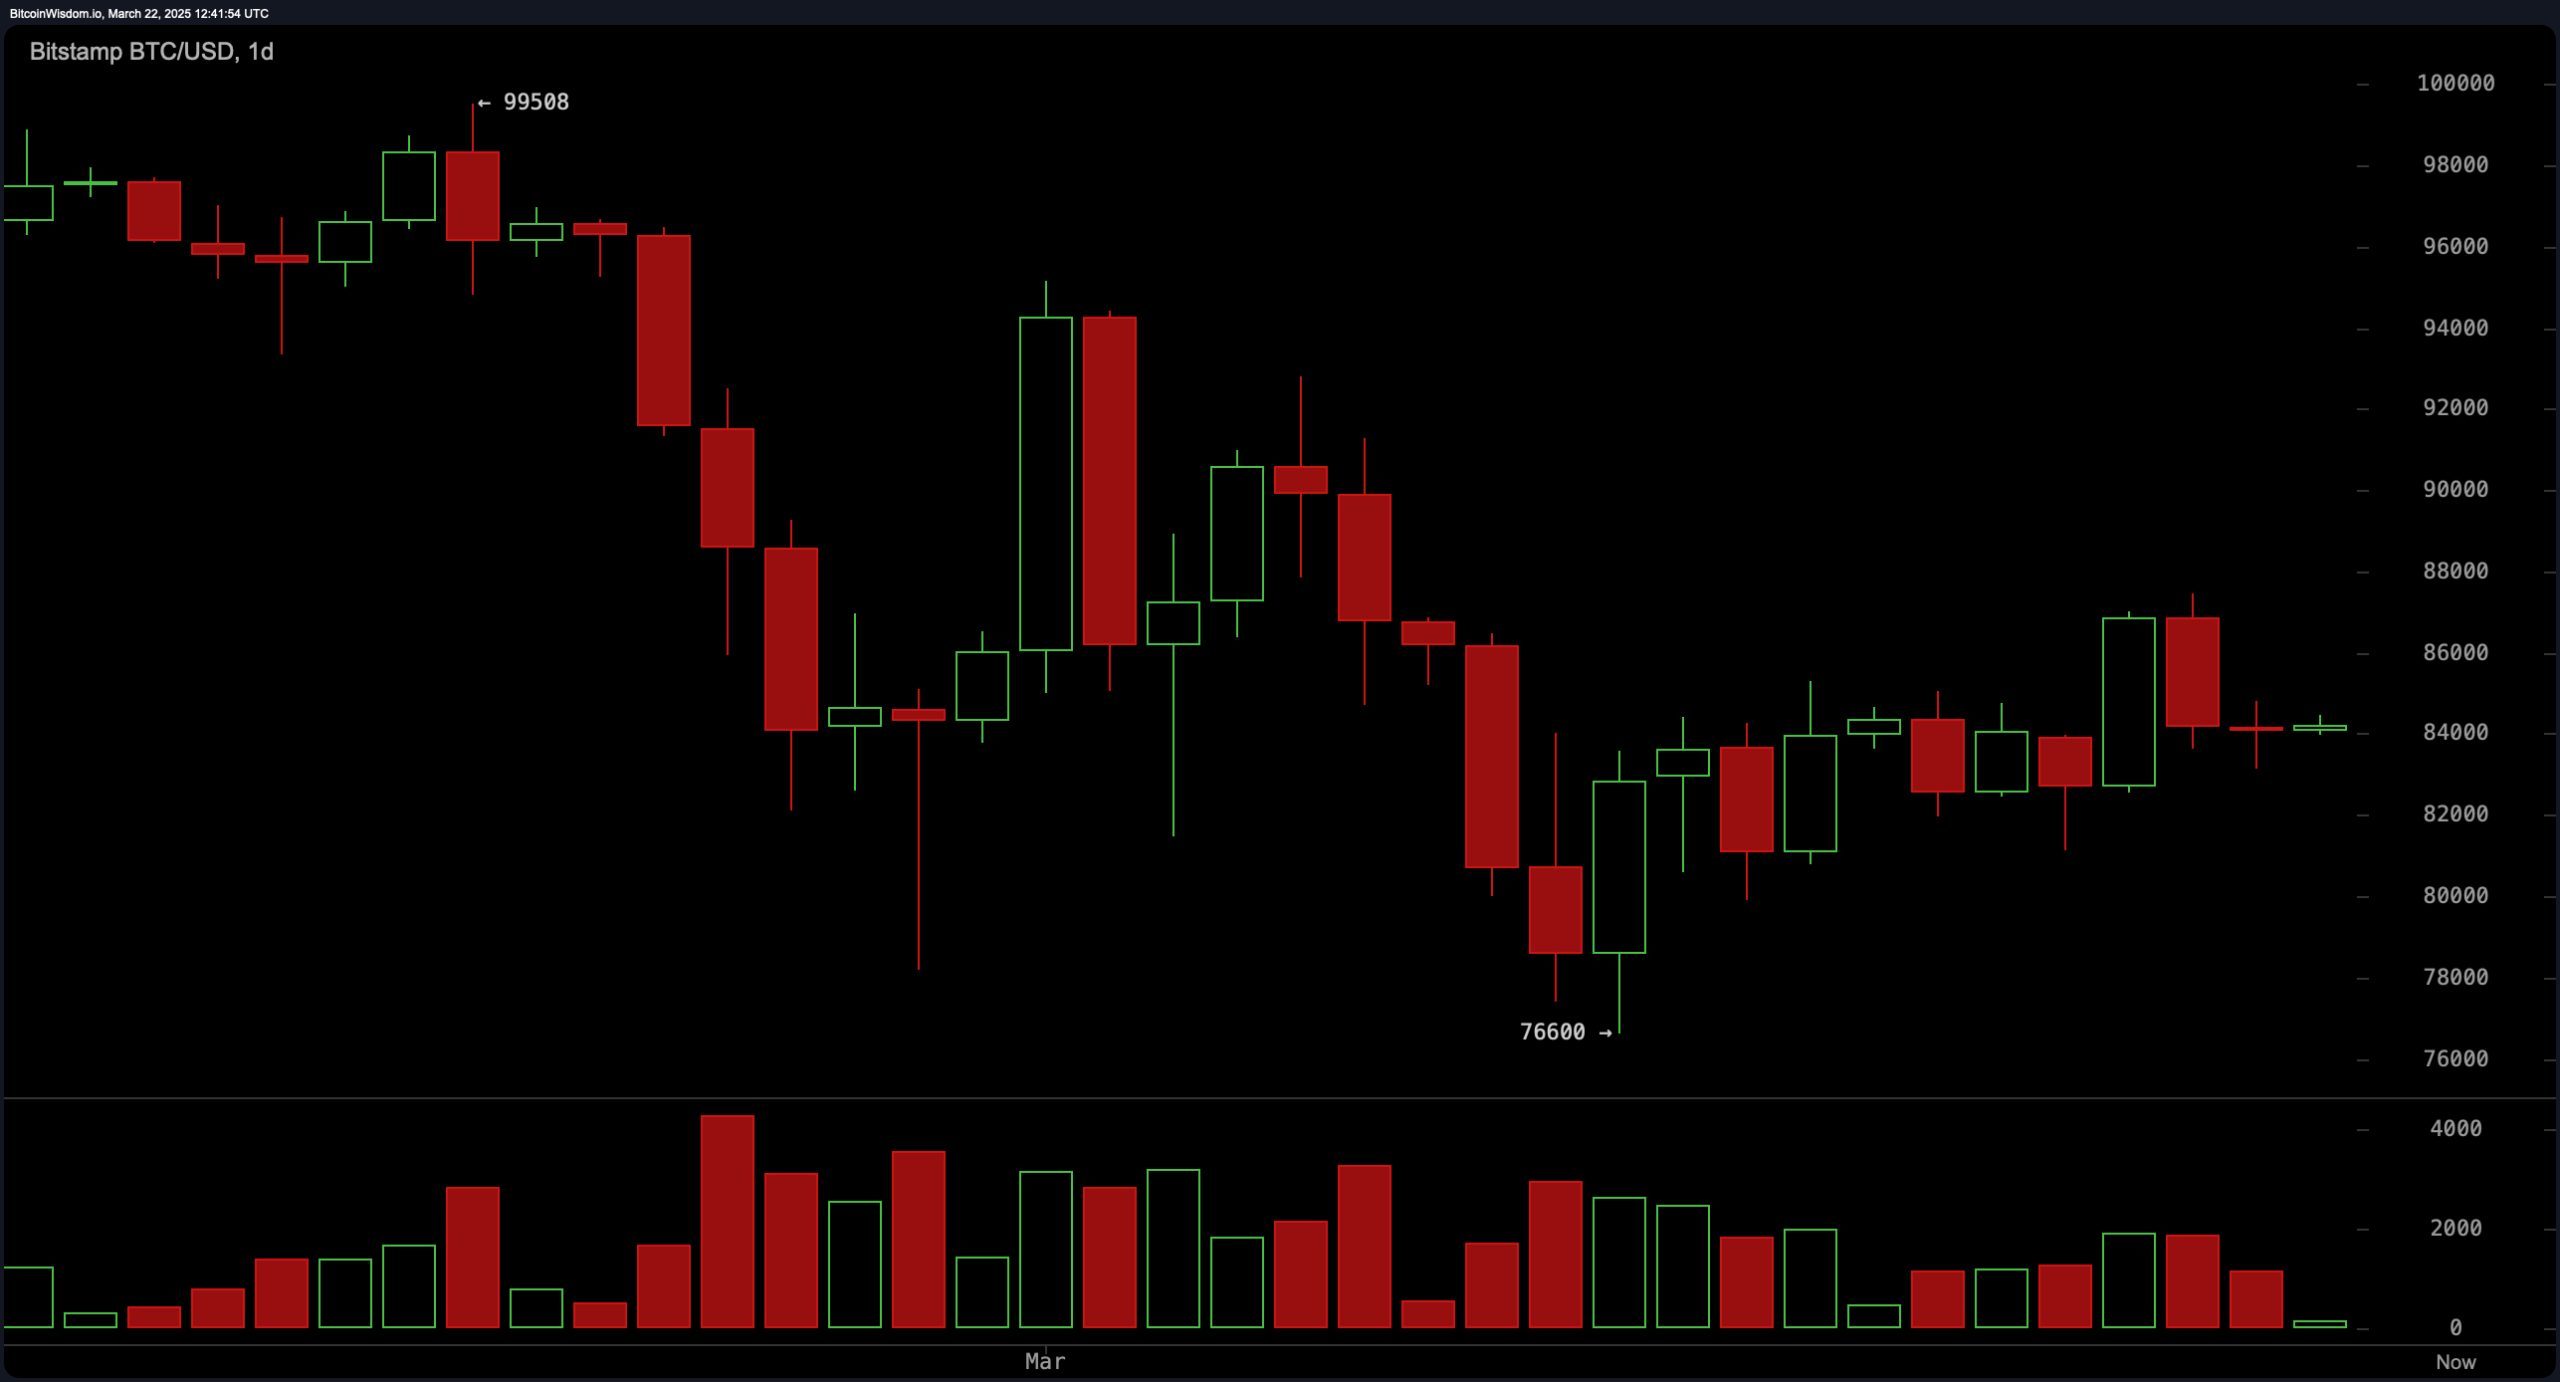
Daily chart analysis indicates a larger pattern of consolidation just below the $85,000 level following a steep decline to $76,600. While the initial selling volume was aggressive, recent candles show subdued participation and indecisiveness. Critical resistance is located at $86,500, and a successful break above this level with rising volume could validate a bullish reversal aiming for the $90,000 zone. The range between $88,000 and $90,000 represents a favorable profit-taking target, while a bullish retest of $82,000 may offer a safer long position for risk-conscious traders.
Oscillator indicators present a neutral outlook for bitcoin, with the relative strength index (RSI) at 46, the Stochastic oscillator at 63, and the commodity channel index (CCI) at −11. The average directional index (ADX) at 33 and the awesome oscillator at −3,331 also reflect indecisive market conditions. The momentum indicator at 575 suggests some selling pressure, while the moving average convergence divergence (MACD) at −1,869 points to a potential positive signal. This mixed oscillator profile implies that market direction is still consolidating, lacking a strong directional bias until a decisive breakout occurs.
Moving averages (MAs) broadly align with a bearish outlook in the mid-to-long-term, with nearly all key averages above current price levels. The exponential moving average (EMA) for 10 periods is at $84,197 (bearish), while the simple moving average (SMA) for 10 periods is at $83,800 (bullish), indicating near-term ambiguity. All higher-period exponential and simple moving averages — including the 20, 30, 50, 100, and 200 — are generating negative signals, suggesting that bitcoin remains under significant technical resistance. With the 200-period EMA and SMA at $85,487 and $84,758 respectively, bulls must reclaim these levels to shift the market structure.
Bull Verdict:
If bitcoin can break above the $84,800–$85,000 resistance range with meaningful volume, and especially if it clears the $86,500 threshold on the daily chart, a bullish reversal toward $88,000–$90,000 becomes increasingly likely. A strong close above key moving averages would further reinforce upside momentum and potentially re-establish a mid-term bullish trend.
Bear Verdict:
Failure to breach the $85,000 mark and continued rejection below major moving averages could see bitcoin slide back toward $83,000, or even retest the recent swing low of around $81,000. Weak volume and persistent sell signals across longer-term moving averages maintain pressure on the price, exposing downside risk if bullish momentum fails to materialize.