Bitcoin is trading at $84,502, commanding a market cap of $1.67 trillion, representing 60.3% dominance in the $2.78 trillion crypto economy. With a 24-hour trading volume of $26 billion and an intraday price range between $81,294 and $84,852, bitcoin remains 22.2% below its all-time high, facing key resistance and support levels across multiple timeframes.
Bitcoin
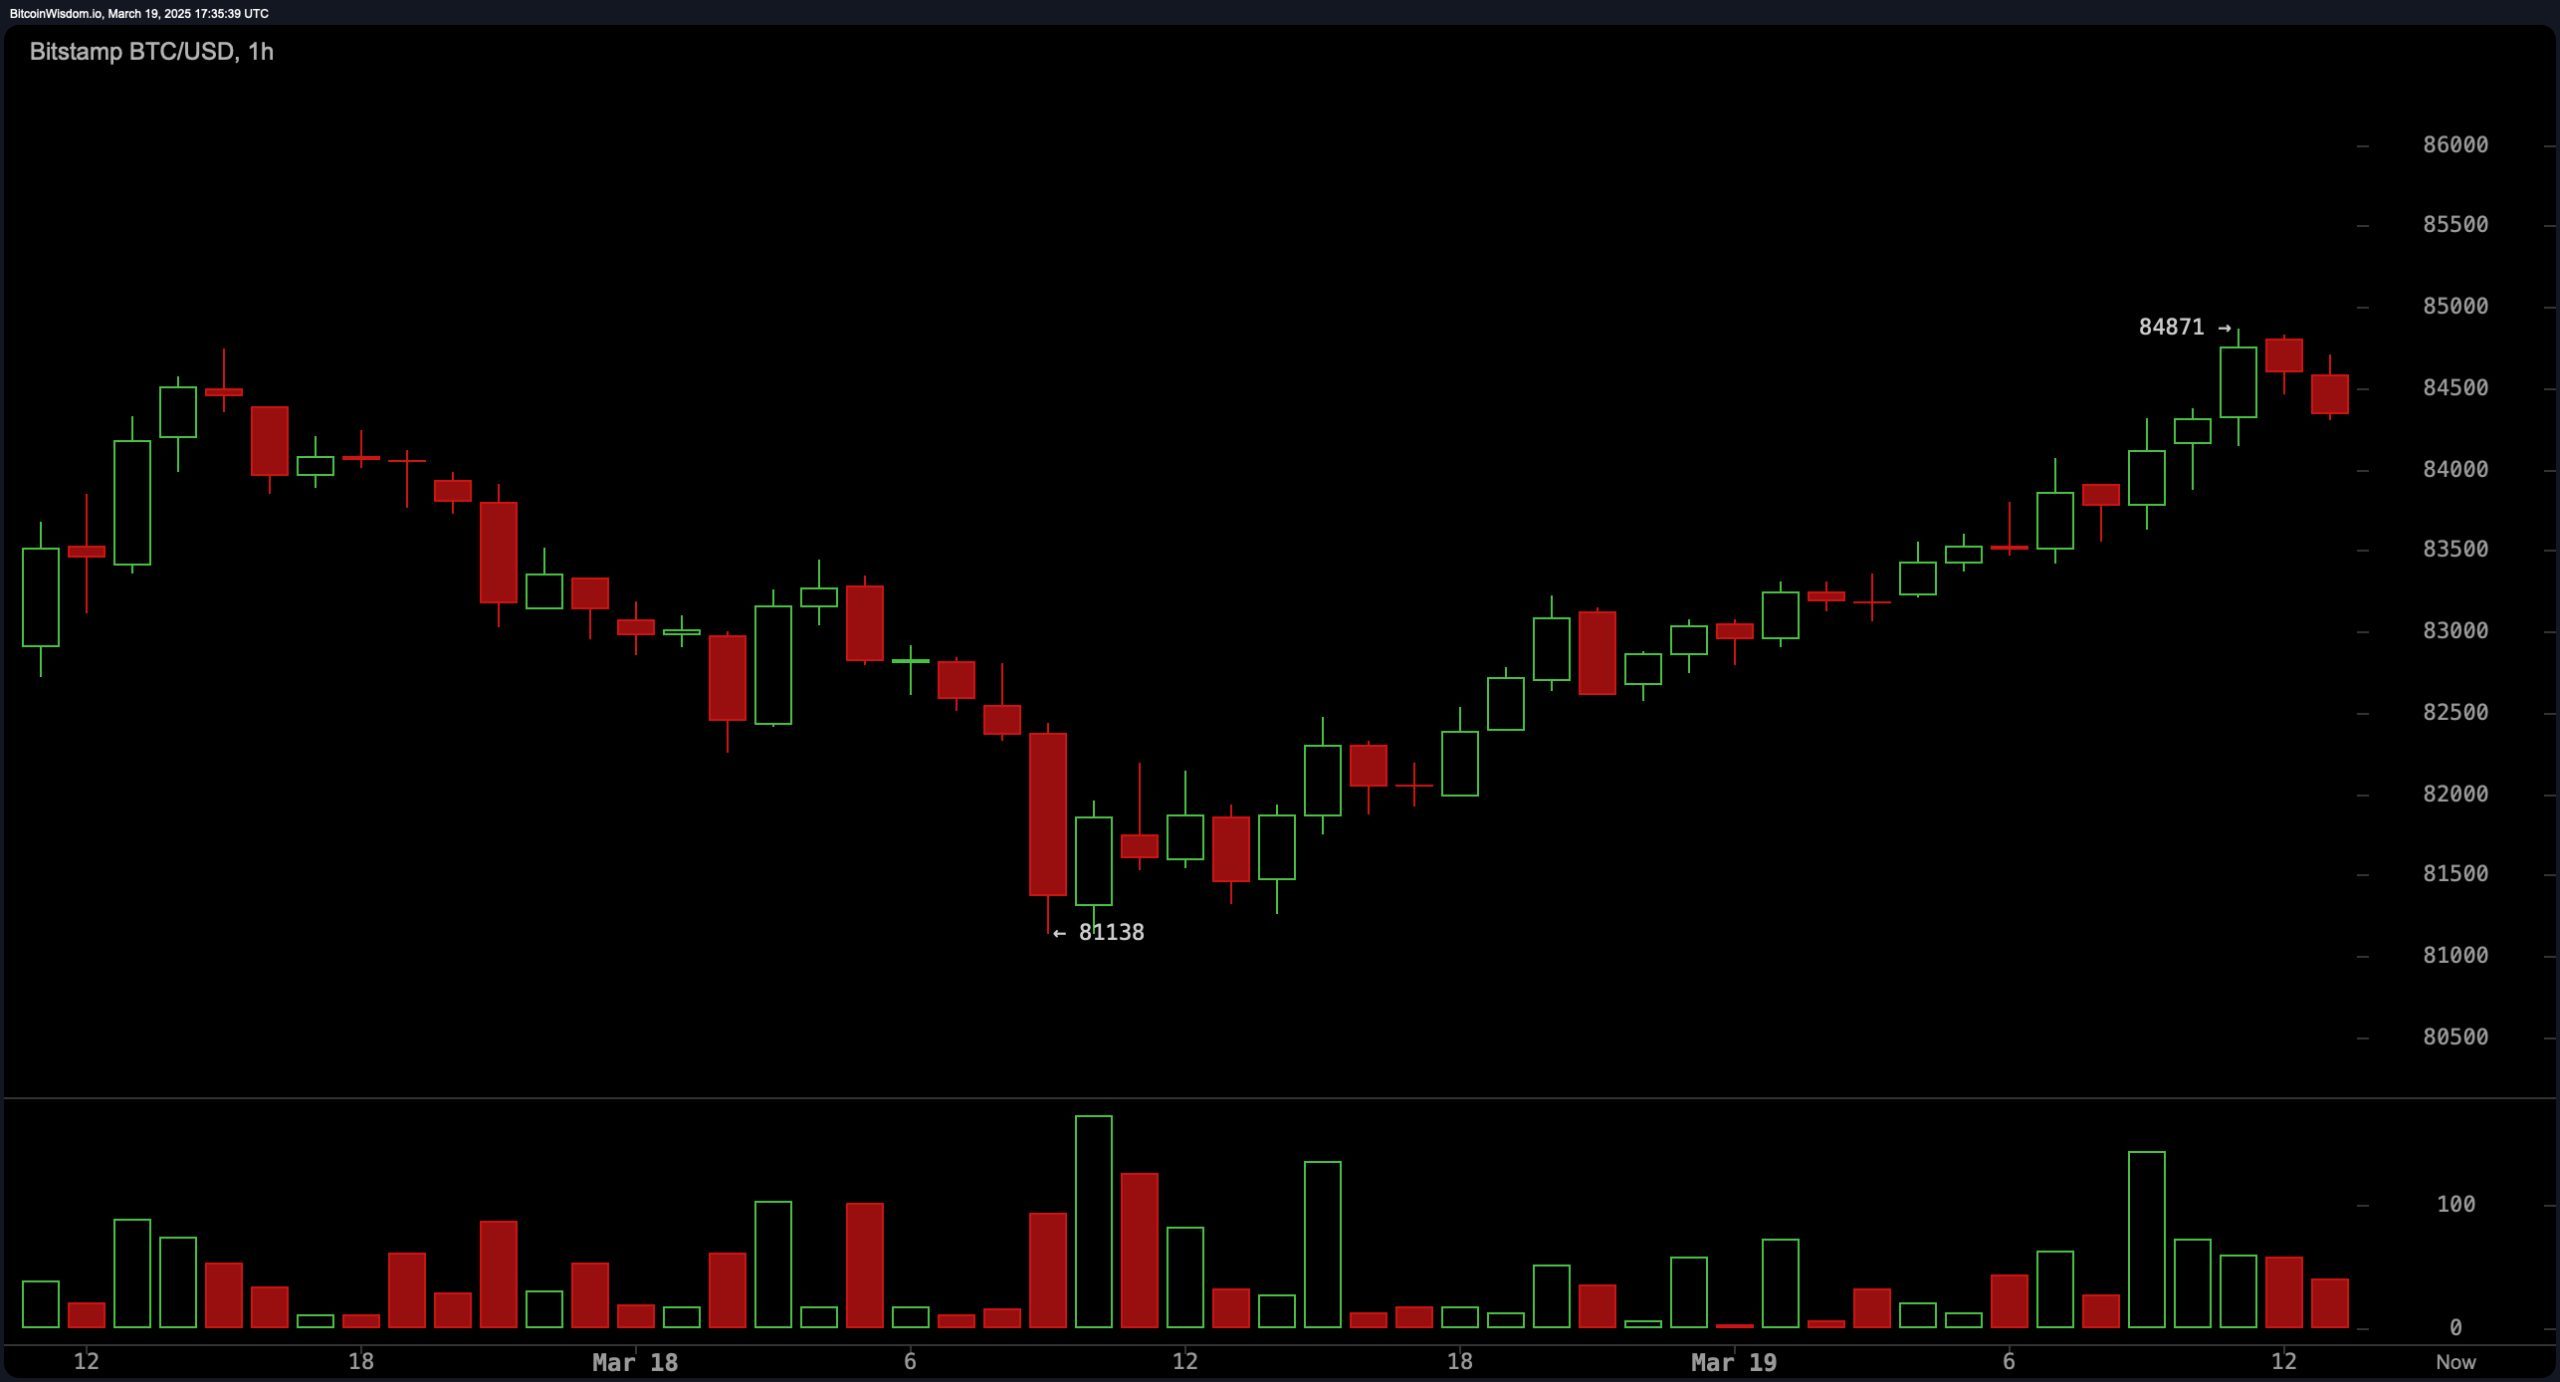
On the 1-hour chart, bitcoin is forming a short-term uptrend after rebounding from $81,138 to a high of $84,871. The market is printing higher highs and higher lows, supported by increasing volume, indicating building momentum. A pullback to the $83,000–$83,500 range could provide an optimal entry for short-term traders, while a breakout above $85,000 may push the price toward the $87,000–$88,000 range. However, if bitcoin fails to hold above $82,500, further downside toward $81,000 is possible.

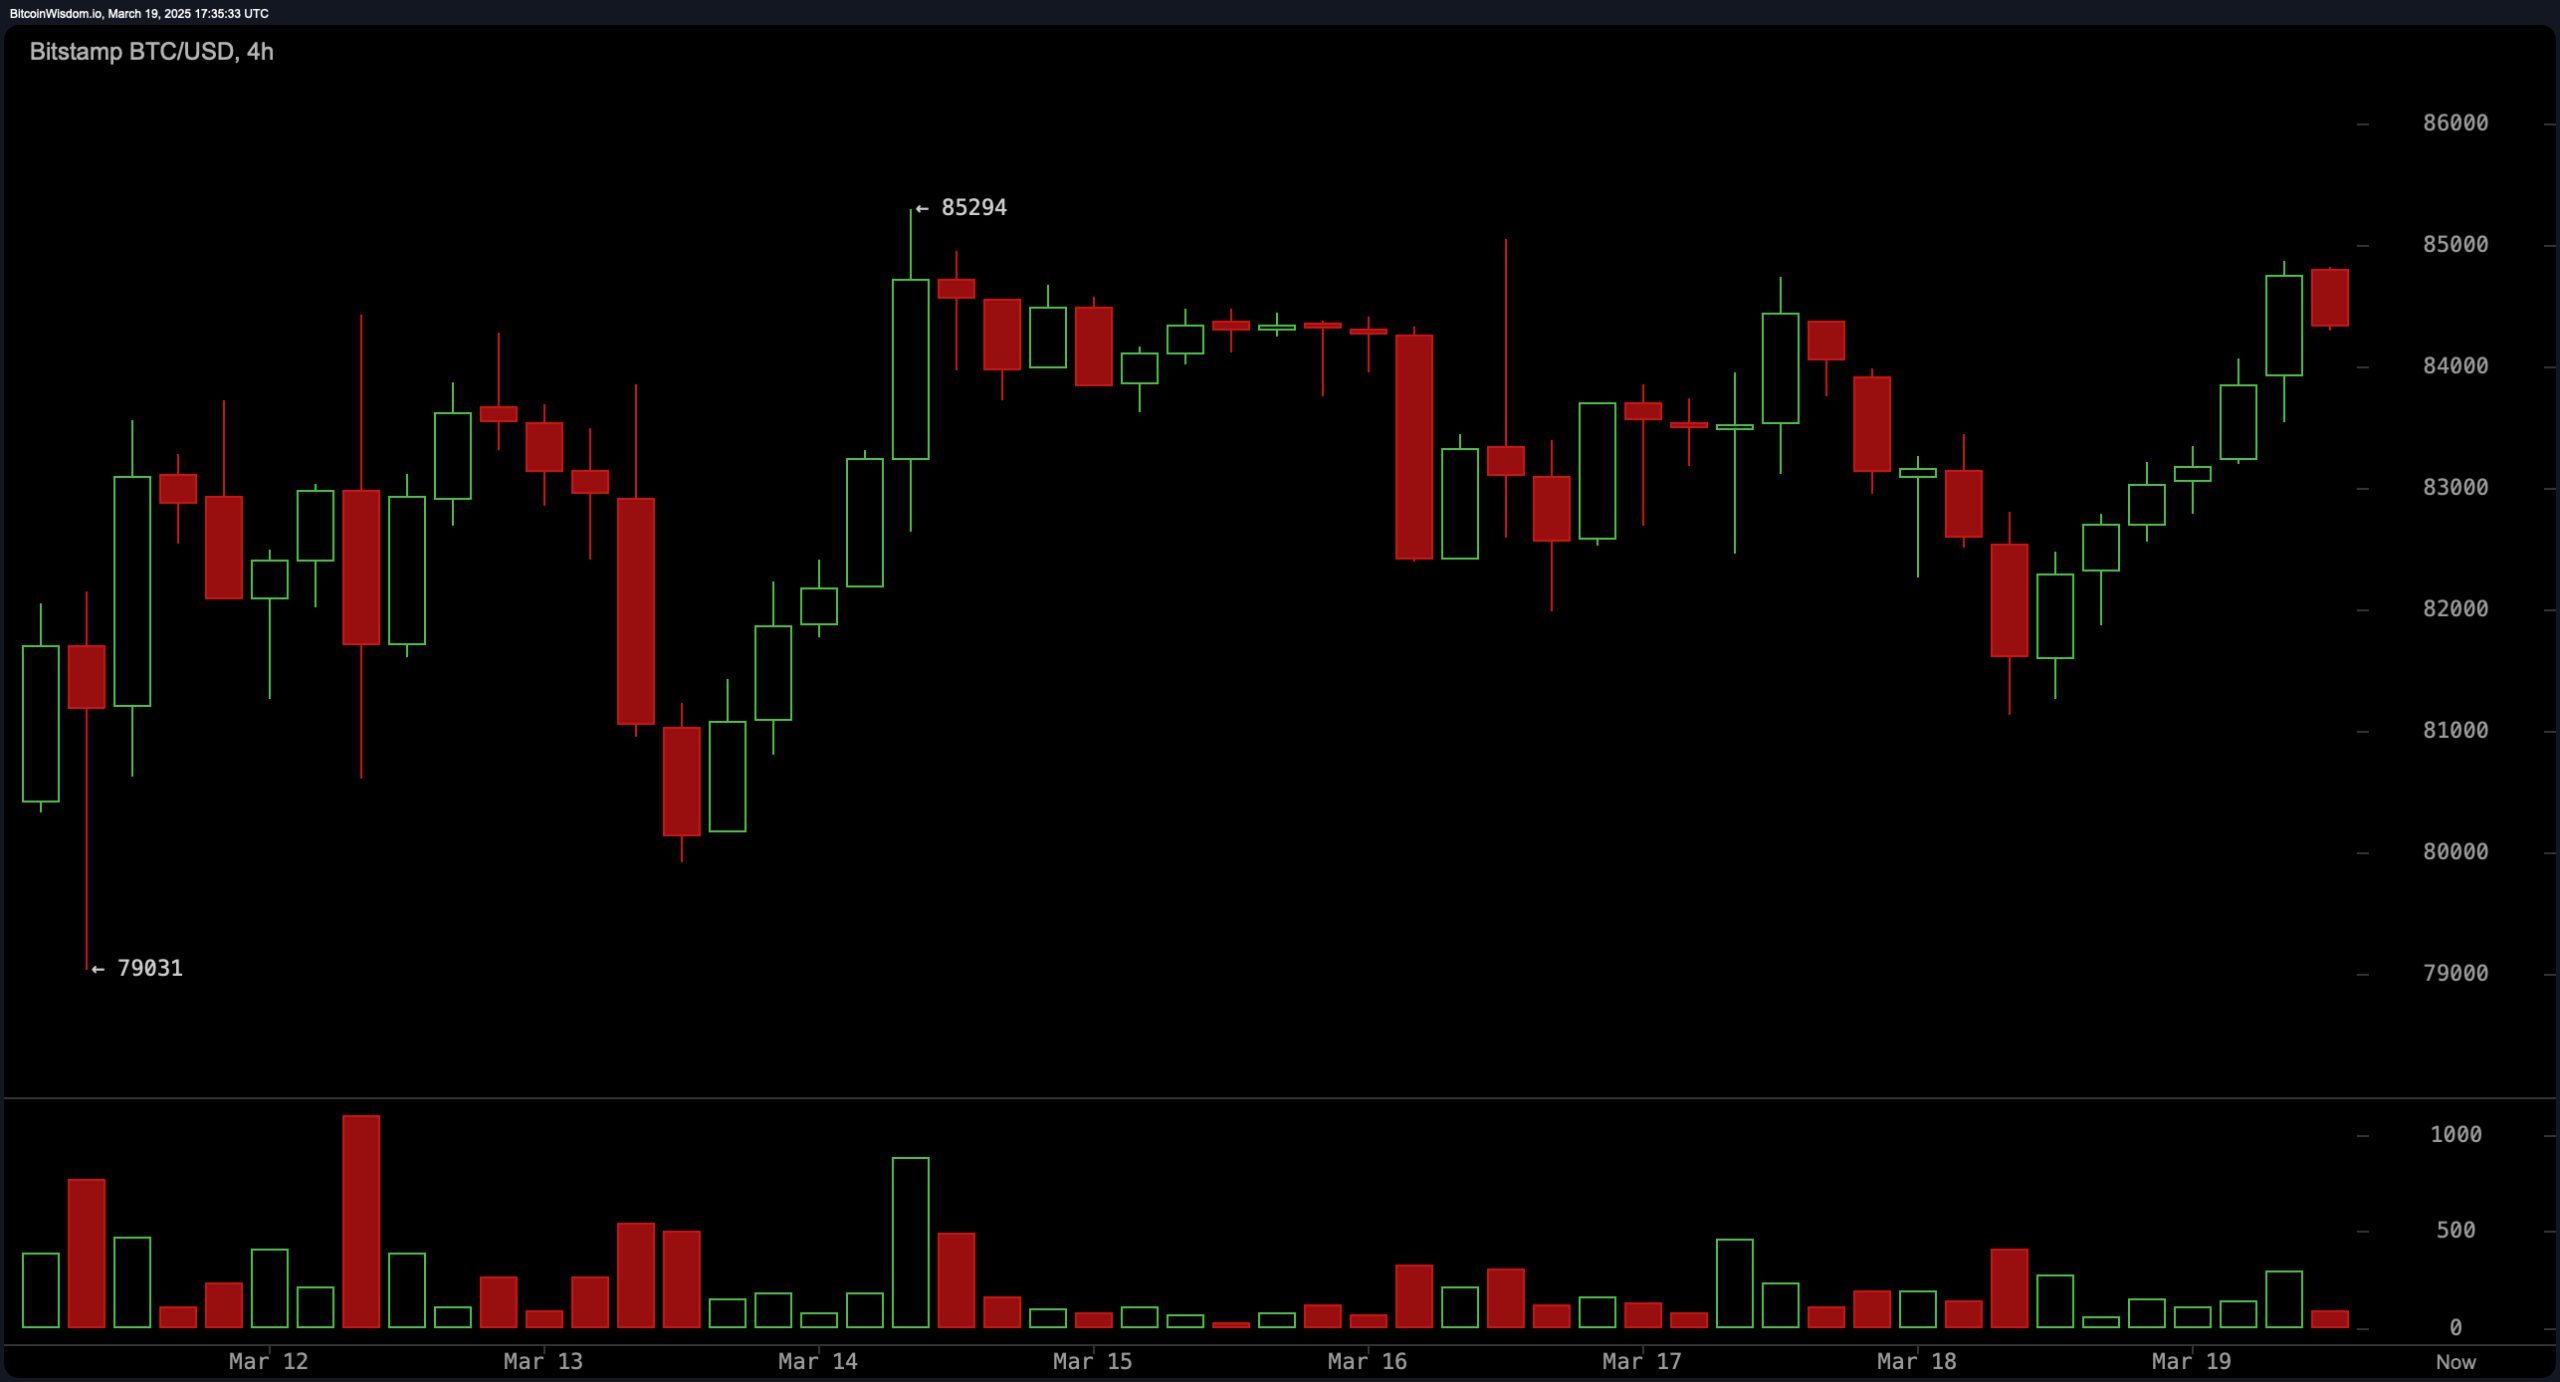
The 4-hour chart suggests a potential trend reversal following bitcoin’s rebound from $79,031 to $85,294. The market is forming a higher low structure, hinting at a bullish breakout if resistance at $85,000–$86,000 is breached. Decreasing volume implies an imminent breakout, with upward targets at $88,000–$90,000. A breakdown below $80,000 could trigger a decline to key support at $76,600, reinforcing a short opportunity for traders.

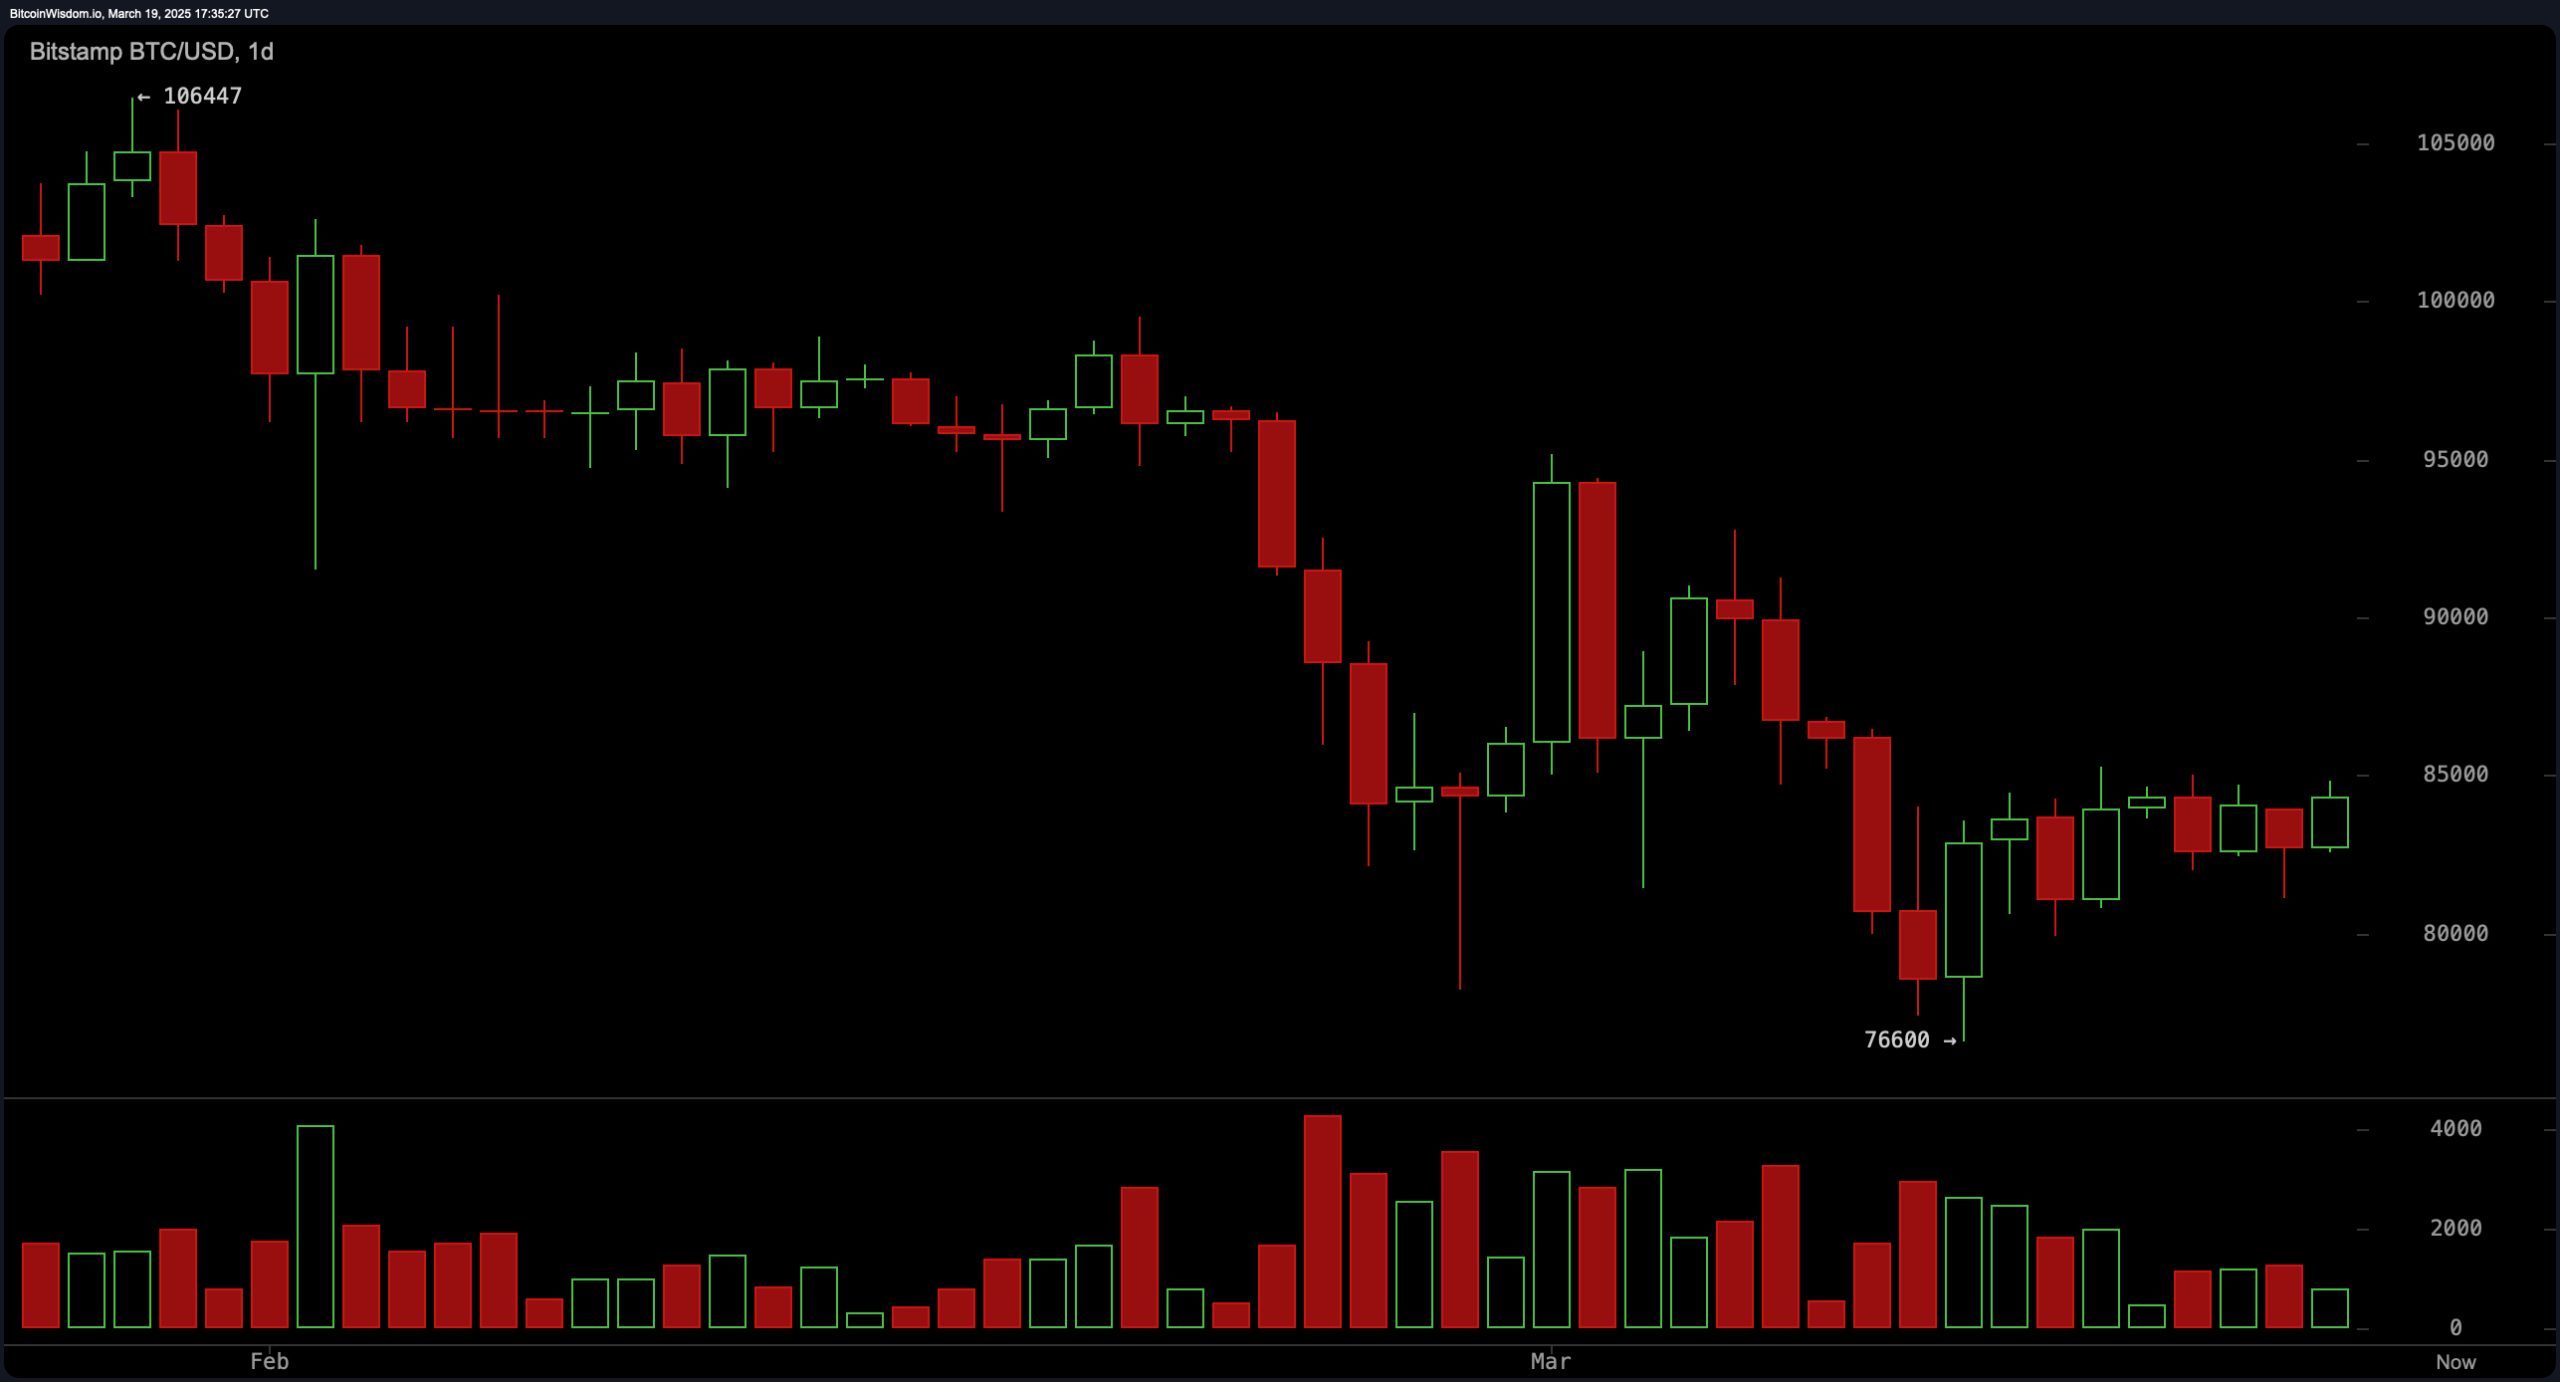
Daily chart analysis highlights a prolonged downtrend since bitcoin’s high at $106,447 on Jan. 29, 2025, with a local bottom near $76,600 on March 10. Current resistance at $85,000–$86,000 must be broken for a meaningful recovery. The 10-day exponential moving average (EMA) at $83,783 and the 10-day simple moving average (SMA) at $82,810 both signal bullish territory, while longer-term moving averages indicate bearish pressure. If bitcoin holds above $80,000–$82,000, a push toward $90,000 becomes more likely; failure to do so could lead to a retest of the $76,600 level.

The BTC/USD daily chart’s oscillator readings remain neutral, with the relative strength index (RSI) at 46 and the average directional index (ADX) at 36, suggesting a lack of strong directional momentum. However, the momentum oscillator at 3,610 and the moving average convergence divergence (MACD) at -2,490 both signal positive reinforcement, indicating growing bullish sentiment. The commodity channel index (CCI) and Stochastic confirm a balanced market, requiring confirmation from price action before committing to a trend.
Overall, bitcoin’s technical setup presents a mixed outlook, with short-term bullish momentum conflicting with broader bearish signals from longer-term moving averages. A decisive breakout above $85,000 could shift sentiment toward the upside, while failure to sustain above key support levels may trigger further downside. Traders should monitor volume closely and adjust positions accordingly as bitcoin approaches critical resistance and support zones.
Bull Verdict:
Bitcoin’s short-term momentum suggests a potential breakout above $85,000, with strong bullish signals from the 10-day moving averages and the MACD. If resistance at $85,000–$86,000 is cleared, upside targets of $88,000–$90,000 become likely. Holding above $80,000–$82,000 would reinforce bullish sentiment, making a recovery toward $90,000 and beyond a realistic scenario.
Bear Verdict:
Despite short-term bullish signals, bitcoin remains below key long-term resistance levels, with most moving averages indicating continued bearish pressure. A failure to hold above $82,500 could trigger a retest of $81,000, with a potential drop to the $76,600 support level. If selling pressure increases and bitcoin fails to reclaim $85,000, further downside could emerge, reinforcing the broader downtrend.
 news.bitcoin.com