
The MACD just had a bearish crossover on the weekly chart, a signal that has historically preceded significant corrections in Bitcoin ($BTC) price.
Historically, bearish MACD crossovers on the weekly timeframe signaled downturns. Previous corrections of -49.78% (-$28,683.57), -44.21% (-$26,173.18), and -63.93% (-$27,459.95) followed such signals.
A similar pattern could emerge. Bitcoin is currently at $97,588.70, recovering from previous downturns.
However, if history repeats, a short-term pullback may occur.
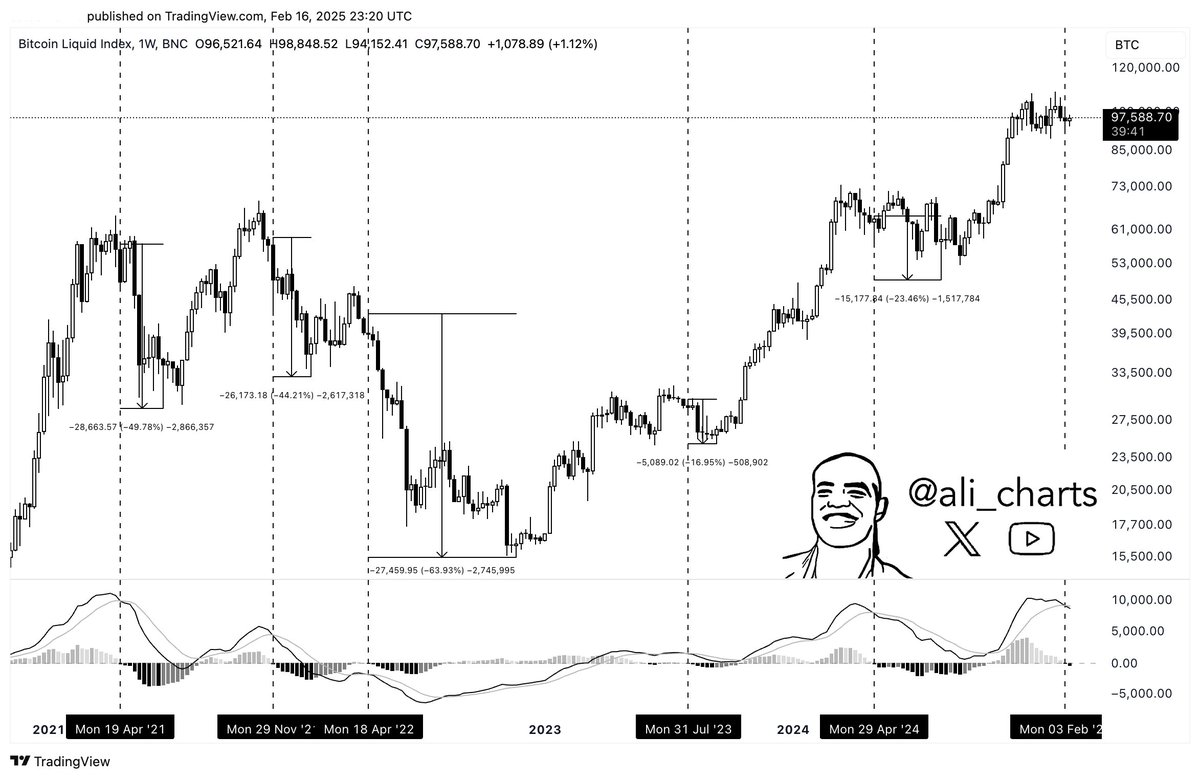
A potential drop of 16.95% to 23.46% could be plausible. $BTC price could consolidate before resuming upward momentum.
The recent rally suggests a bullish macro trend despite short-term risks. Investors should remain cautious but expect volatility.
$BTC Exchange Inflow/Outflow Ratio
Furthermore, the $BTC exchange inflow and outflow ratio 30DMA entered the high demand zone, historically triggering Bitcoin ($BTC) price increases.
In 2017, 2020, and 2023, $BTC surged after the ratio dipped below 0.95. The current ratio sits at 0.975, signaling accumulation.
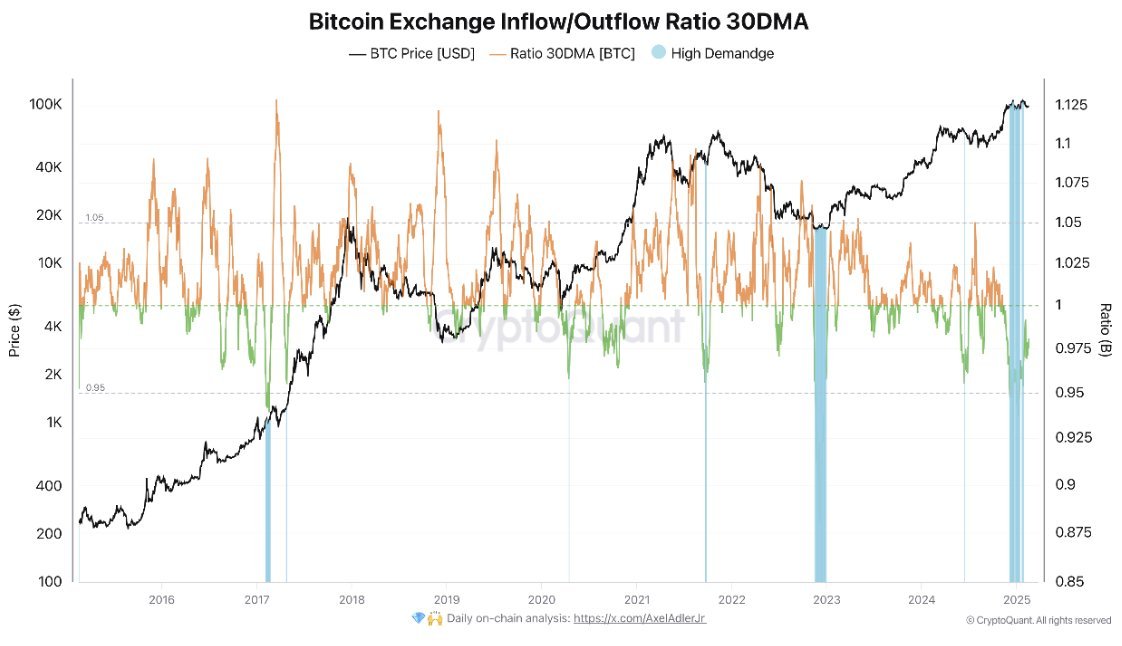
Bitcoin’s price is $97,588.70, recovering from corrections. If demand sustains, $BTC could surpass $100K short-term.
Long-term, repeated demand zone entries aligned with bull runs. The 2020 dip led to $BTC breaking $20K, and 2021 pushed it over $60K.
Failure to sustain demand may lead to stagnation.
$BTC Liquidity Resting Above the Consolidation Zone
$BTC liquidity is currently piled up above the consolidation zone, indicating potential resistance near $100,000 while Bitcoin stabilizes within a narrow range.
The heatmap revealed strong liquidity around $100,000, creating resistance. As of press time, $BTC price traded between $95,000 and $100,000, struggling to break higher.
High liquidity zones historically acted as magnets for price movements. A breakout above $100,000 could trigger increased volatility and upward momentum.
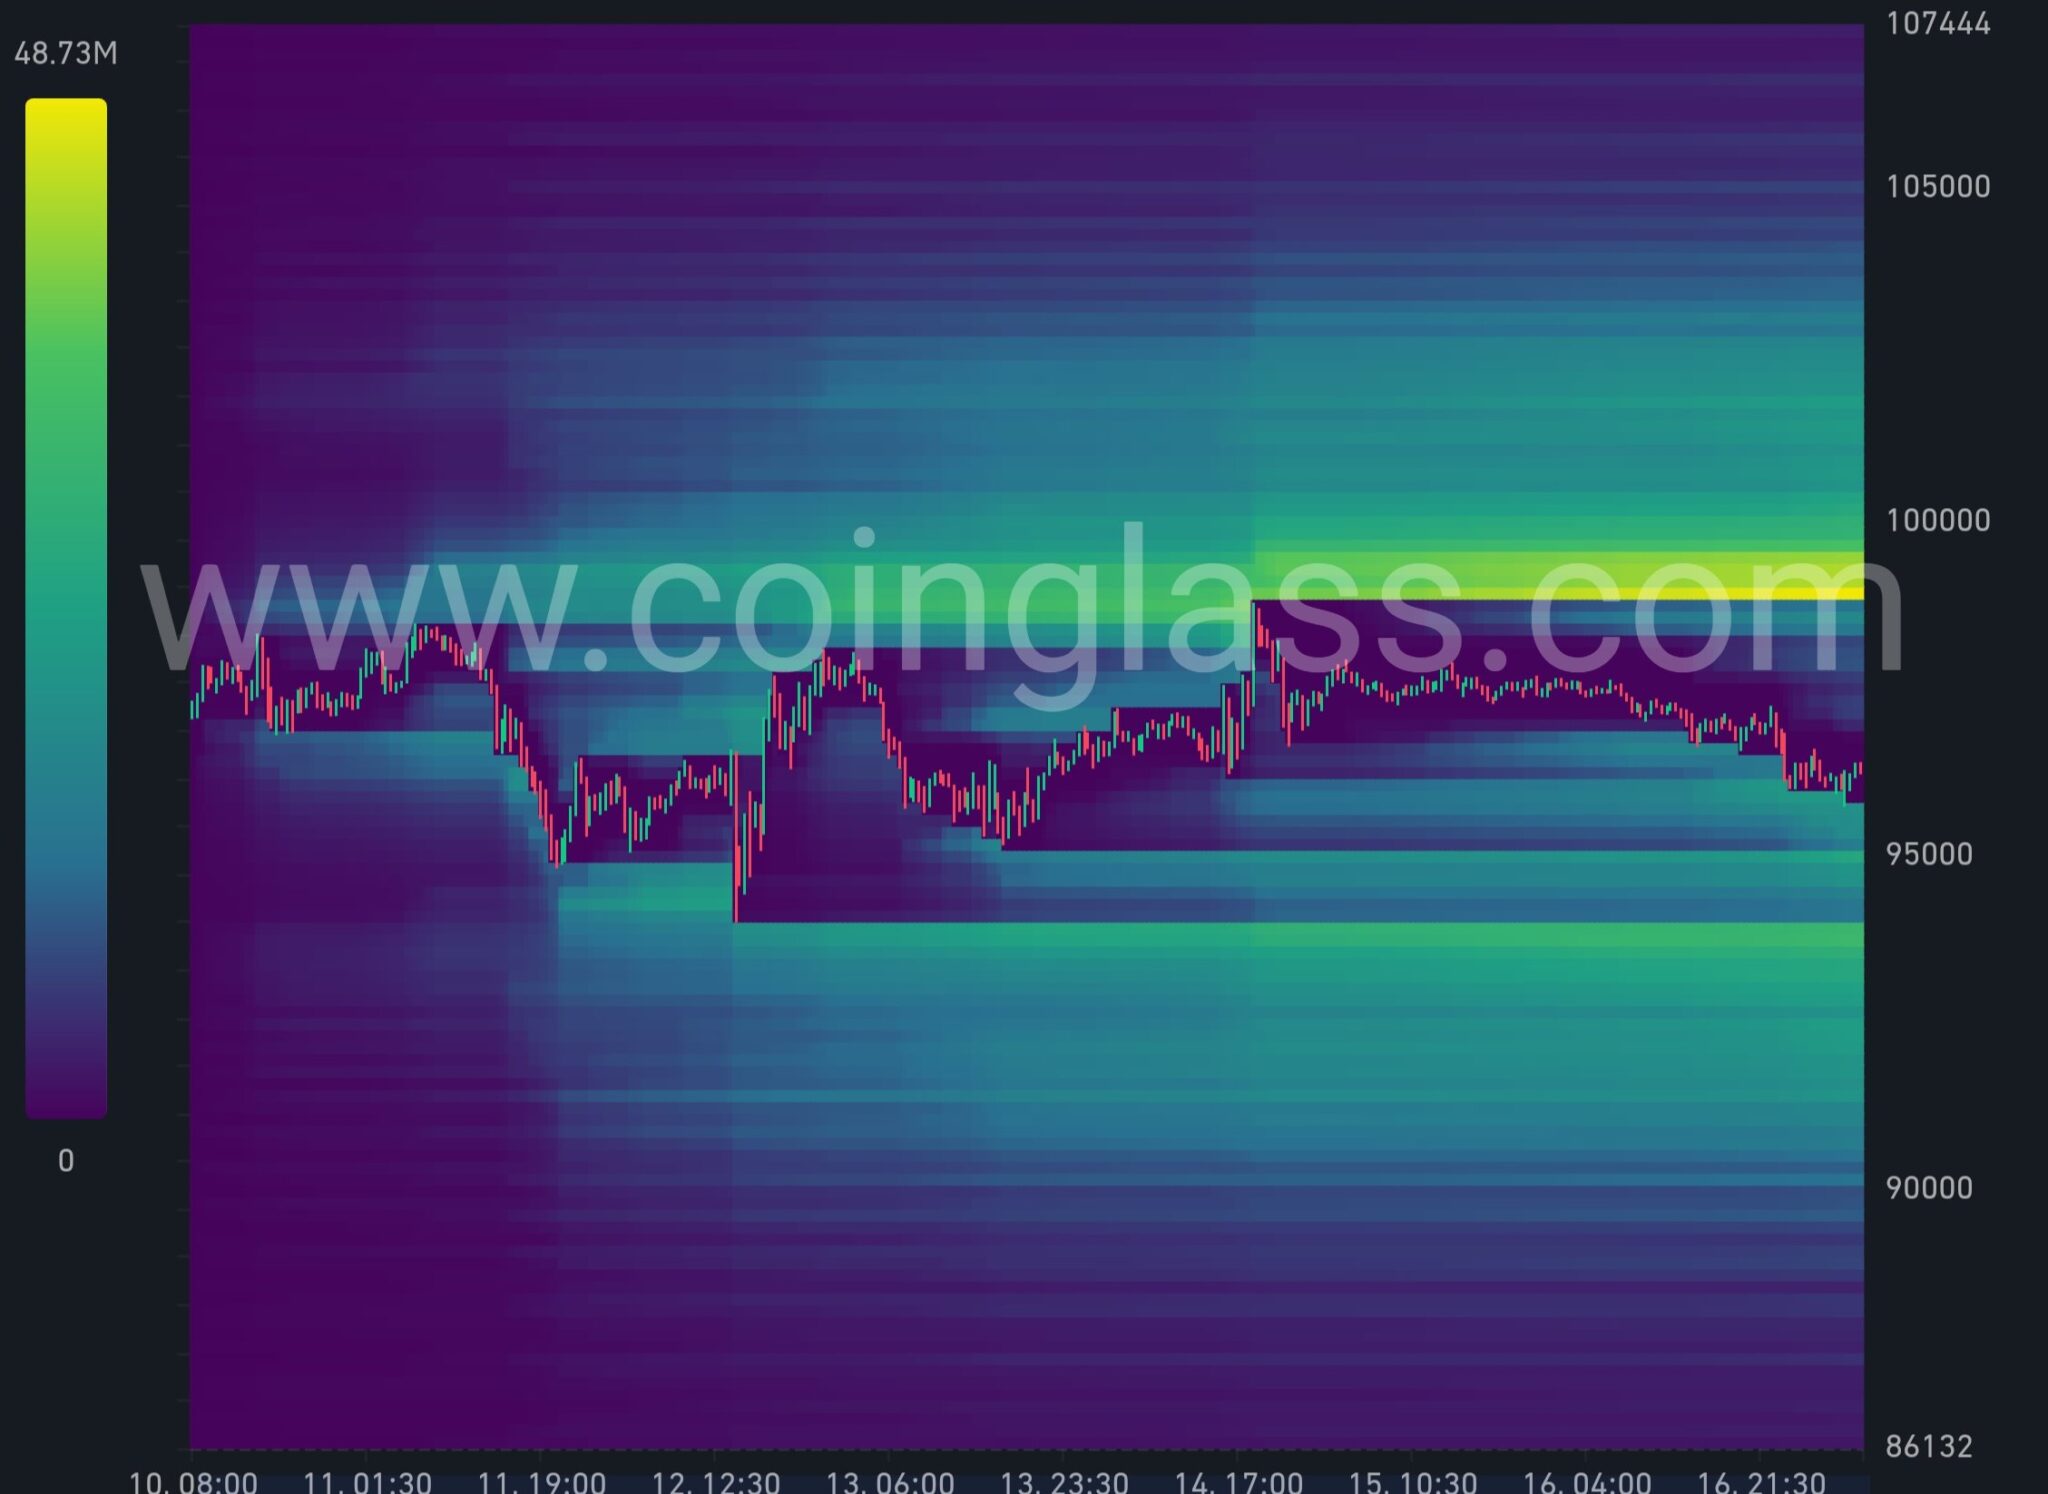
Short-term, $BTC price could retest $100,000 if buying pressure intensifies. Failure to break this level could lead to a drop toward $95,000 or lower.
Long-term, sustained accumulation near $100,000 may signal strong demand before the next leg up. A breakout beyond $105,000 could confirm bullish continuation.
Traders should monitor liquidity shifts and order book changes for breakout confirmations or potential reversals.
$BTC Price and Weekly Returns
The 7th week posted a positive return of +0.33% in 2025, marking only the second time since 2013 this has occurred.
Historically, $BTC saw an average 7th-week gain of +6.45%, with notable spikes like +18.06% in 2021 and +11.43% in 2023.
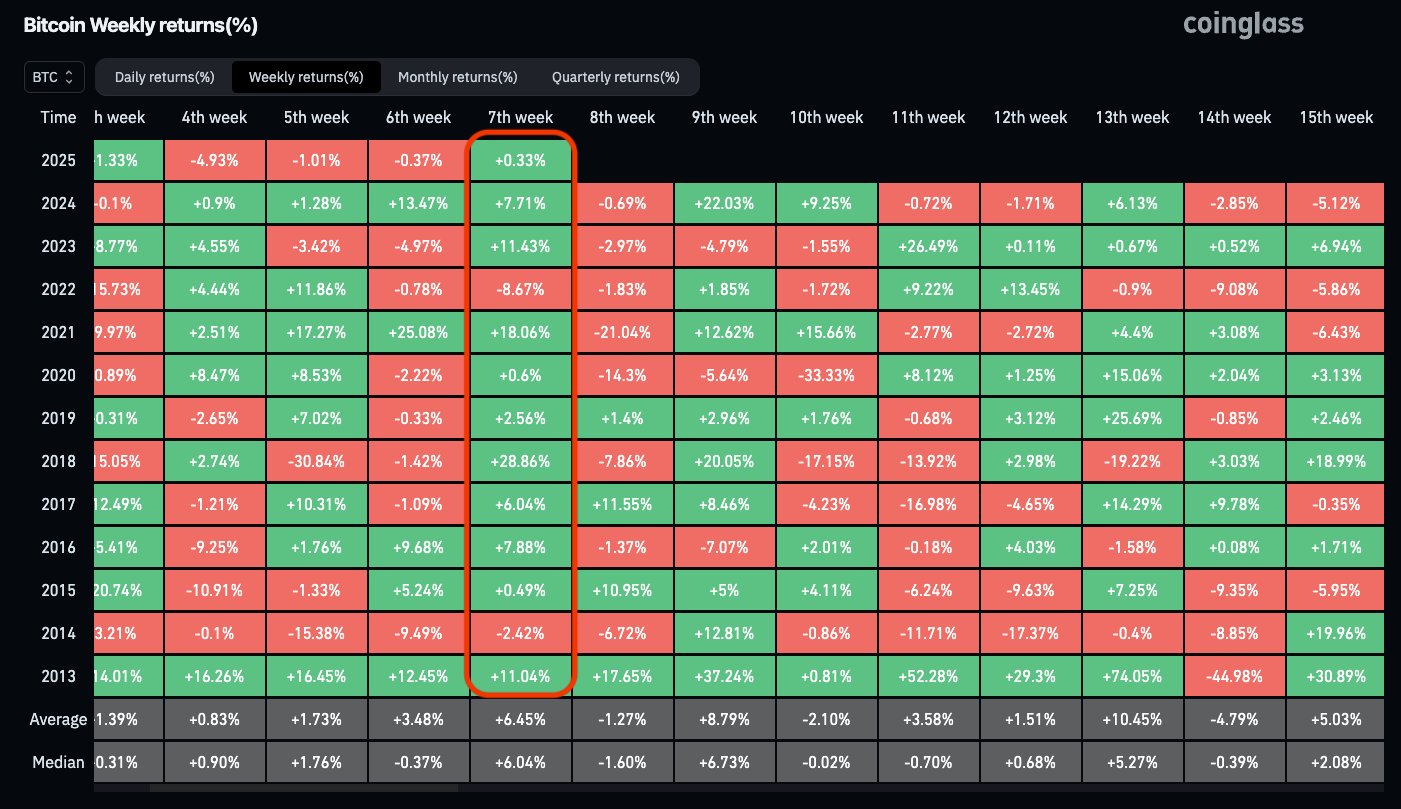
Currently, Bitcoin ($BTC) is consolidating near $97,588.70, showing resilience. If history repeats, this could lead to a strong breakout.
Then, a potential push above $100K in the short term is possible for $BTC price. Long-term, strong 7th-week performances have preceded bullish trends.
In 2013, $BTC gained +11.04%, leading to a 52.28% surge in subsequent weeks. A similar move could set $BTC up for an extended rally.
Failure to sustain momentum could lead to prolonged consolidation. Traders should watch for volume spikes and macroeconomic signals to confirm the breakout.