
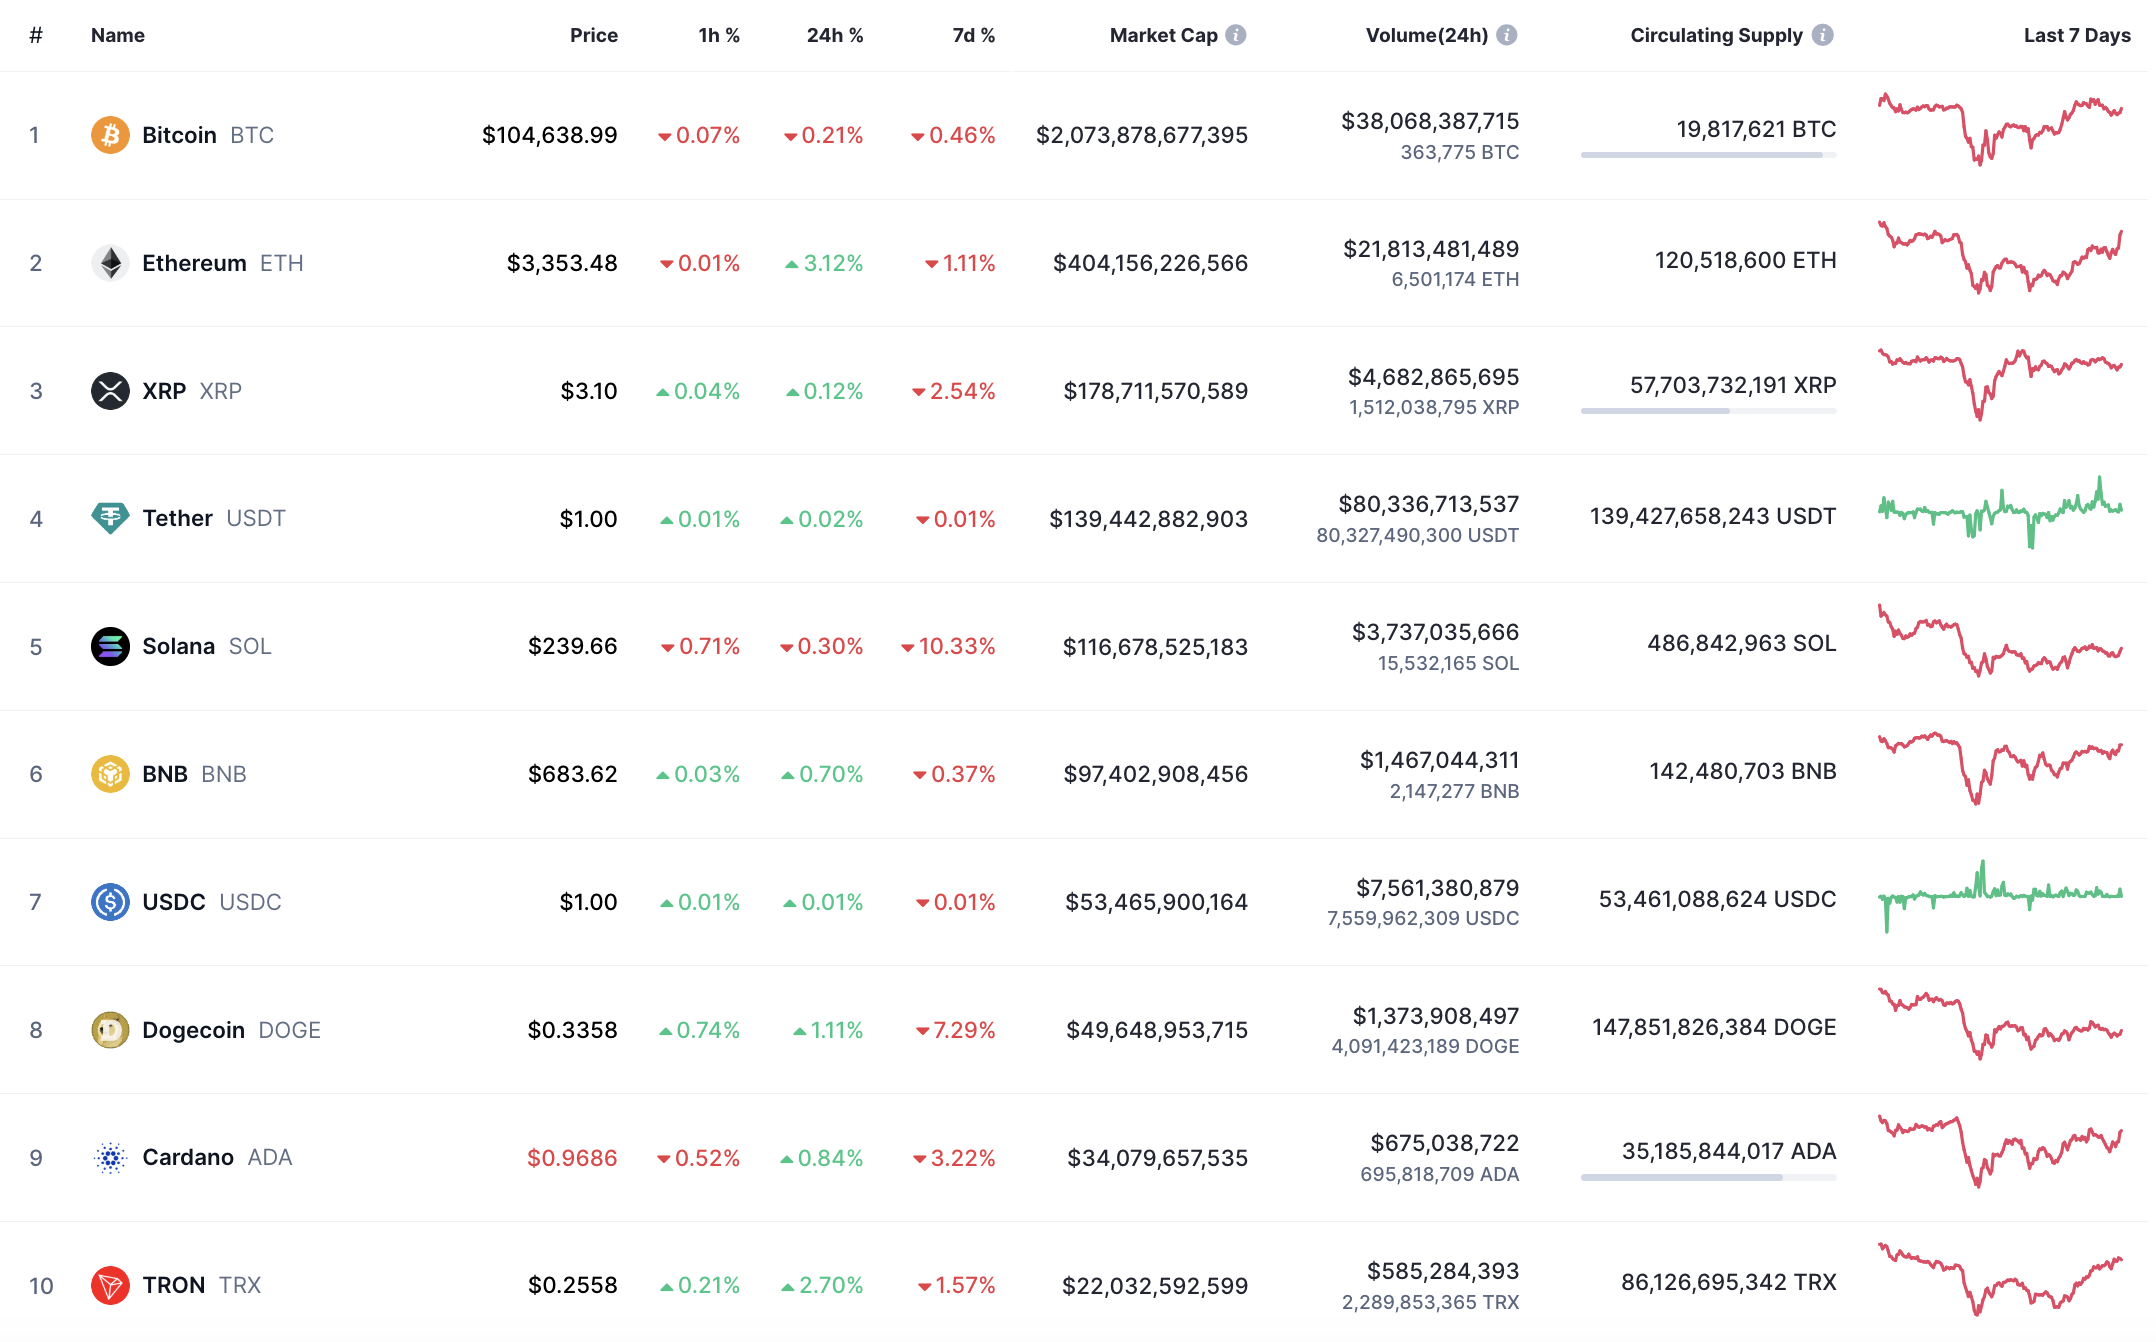
The crypto market remains mainly in the green zone, according to CoinMarketCap.
BTC/USD
The rate of Bitcoin (BTC) has fallen by 0.21% over the last 24 hours.
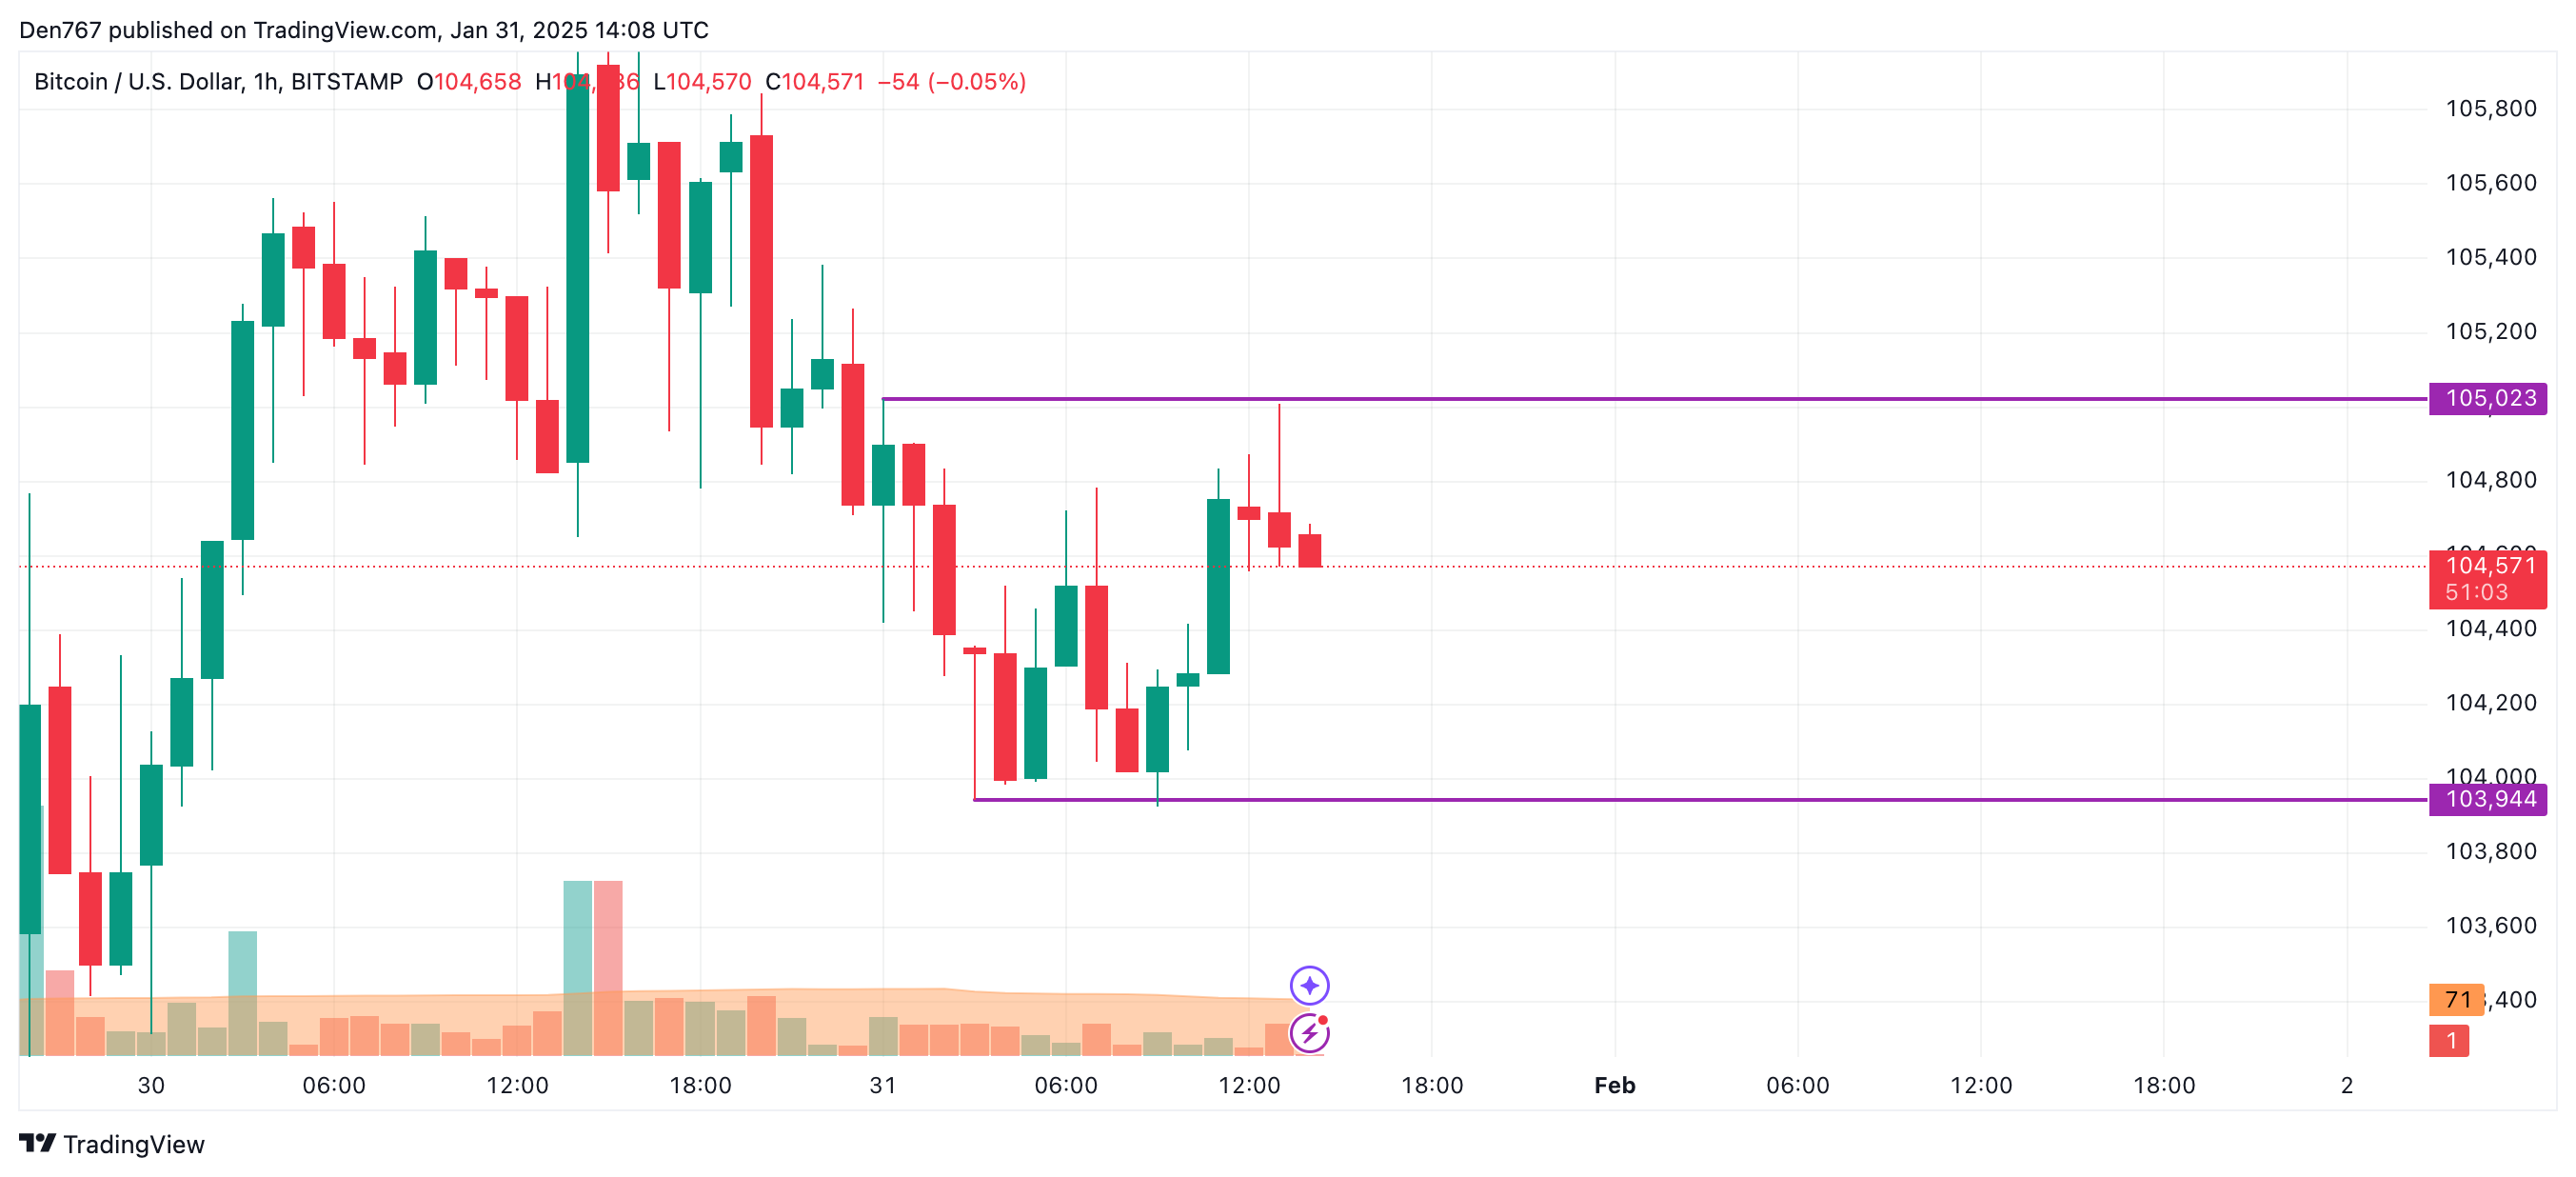
On the hourly chart, the price of BTC is going down after setting a local resistance level of $105,023. If the sellers' pressure continues, one can expect a test of the $104,000 area soon.
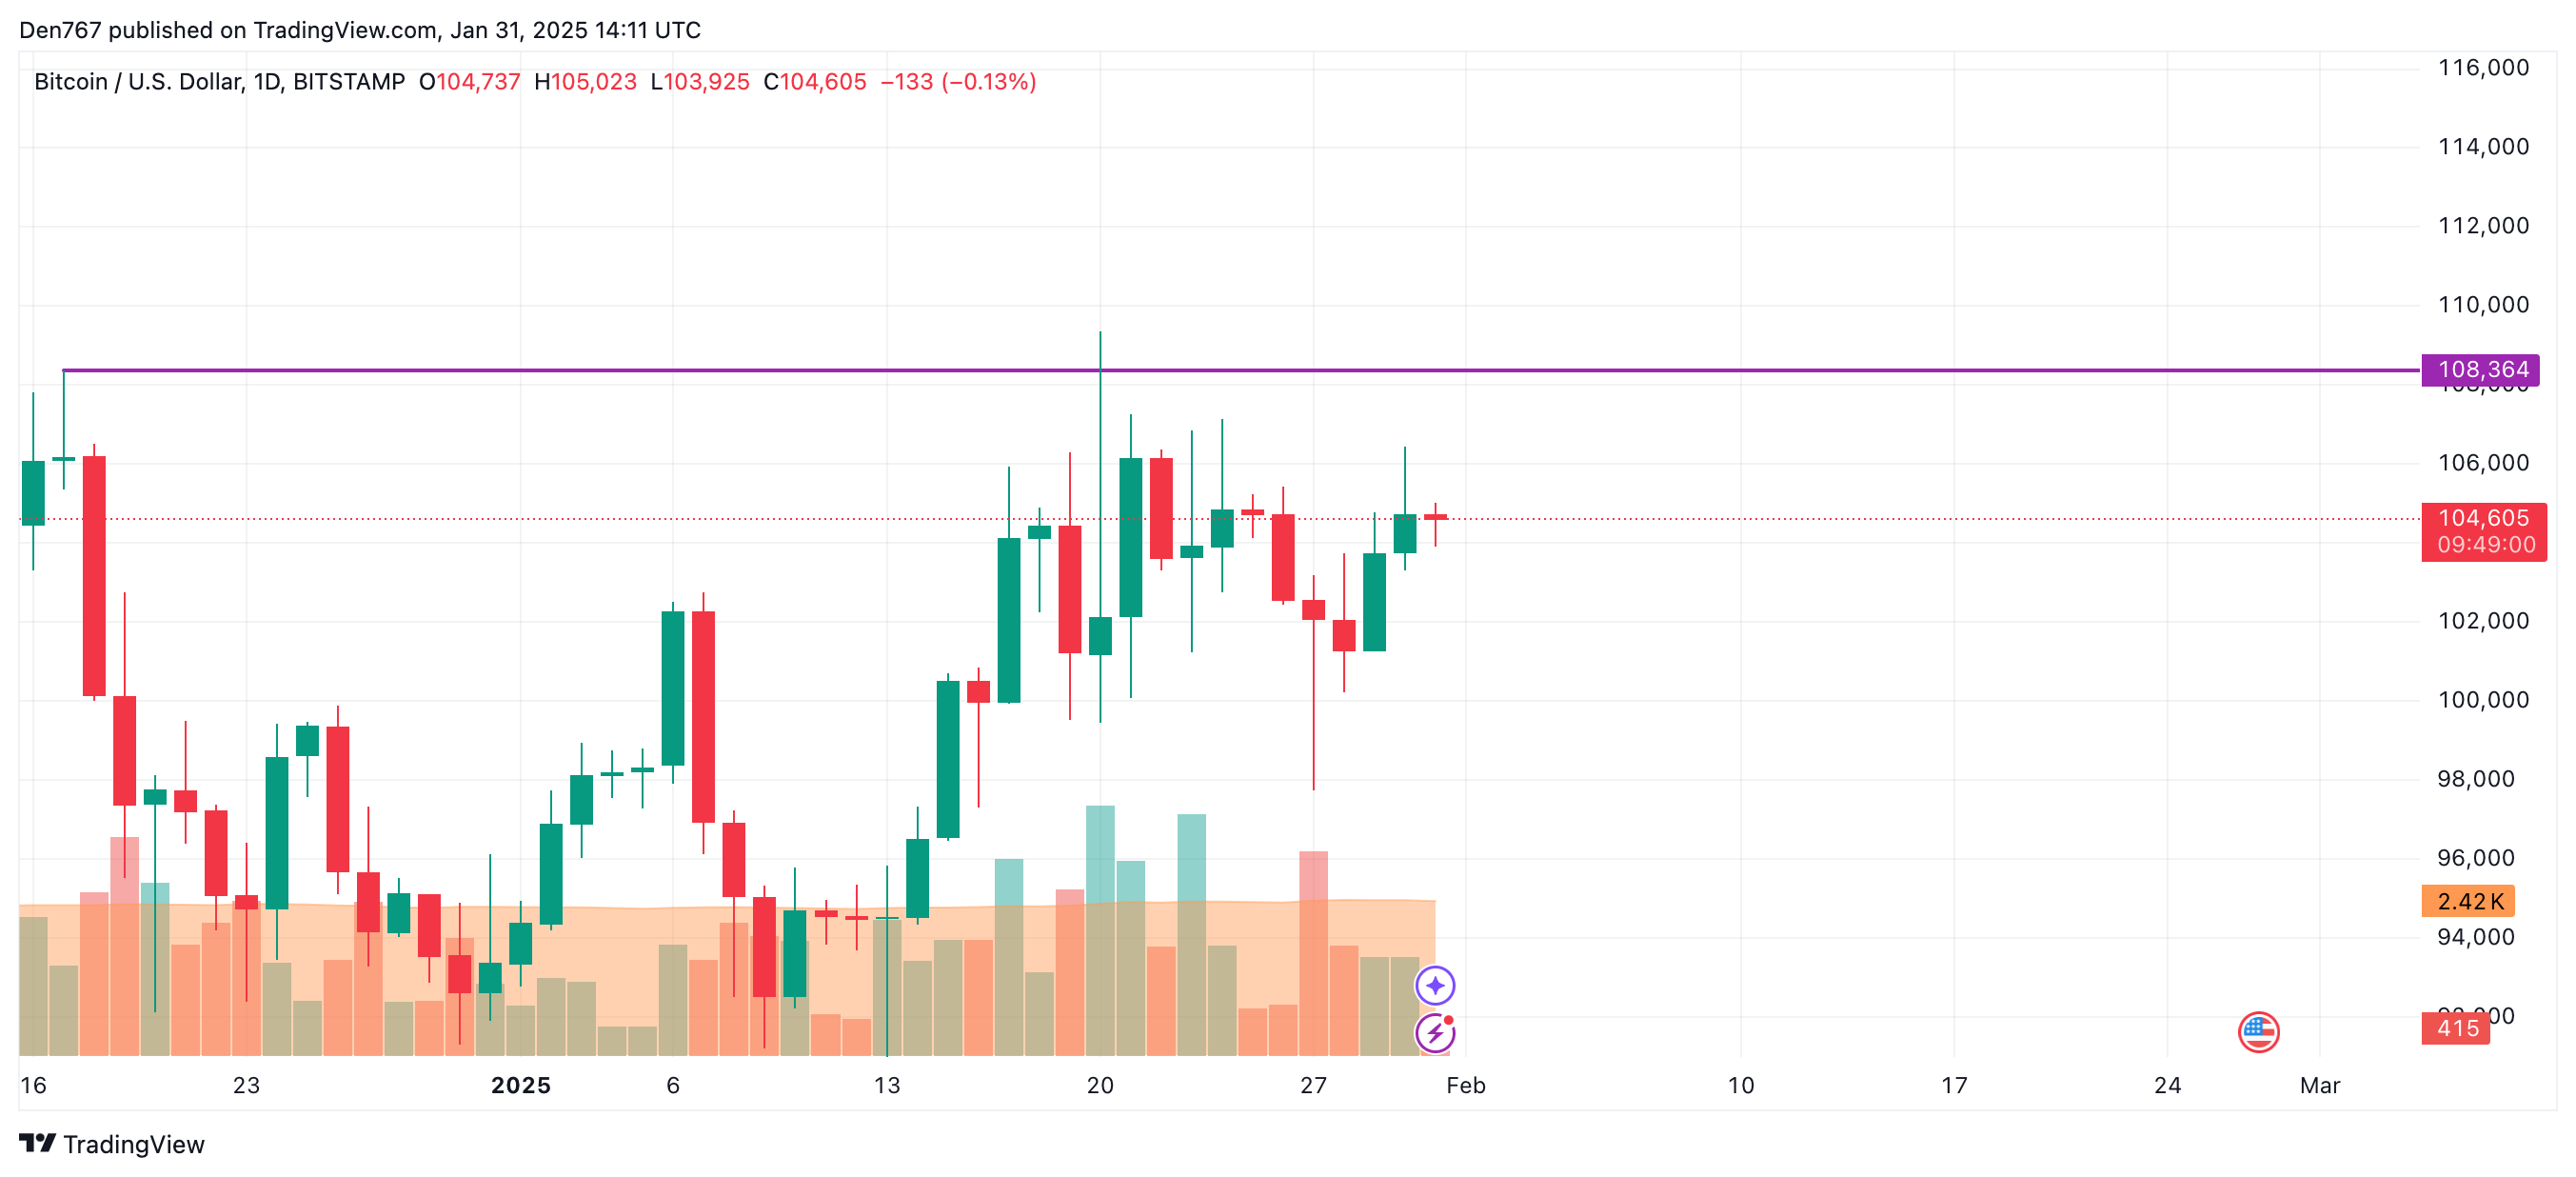
On the larger time frame, neither bulls nor bears are dominating. The volume remains low, which means none of the sides is ready for a sharp move.
All in all, ongoing sideways trading in the narrow range of $104,000-$107,000 is the more likely scenario.
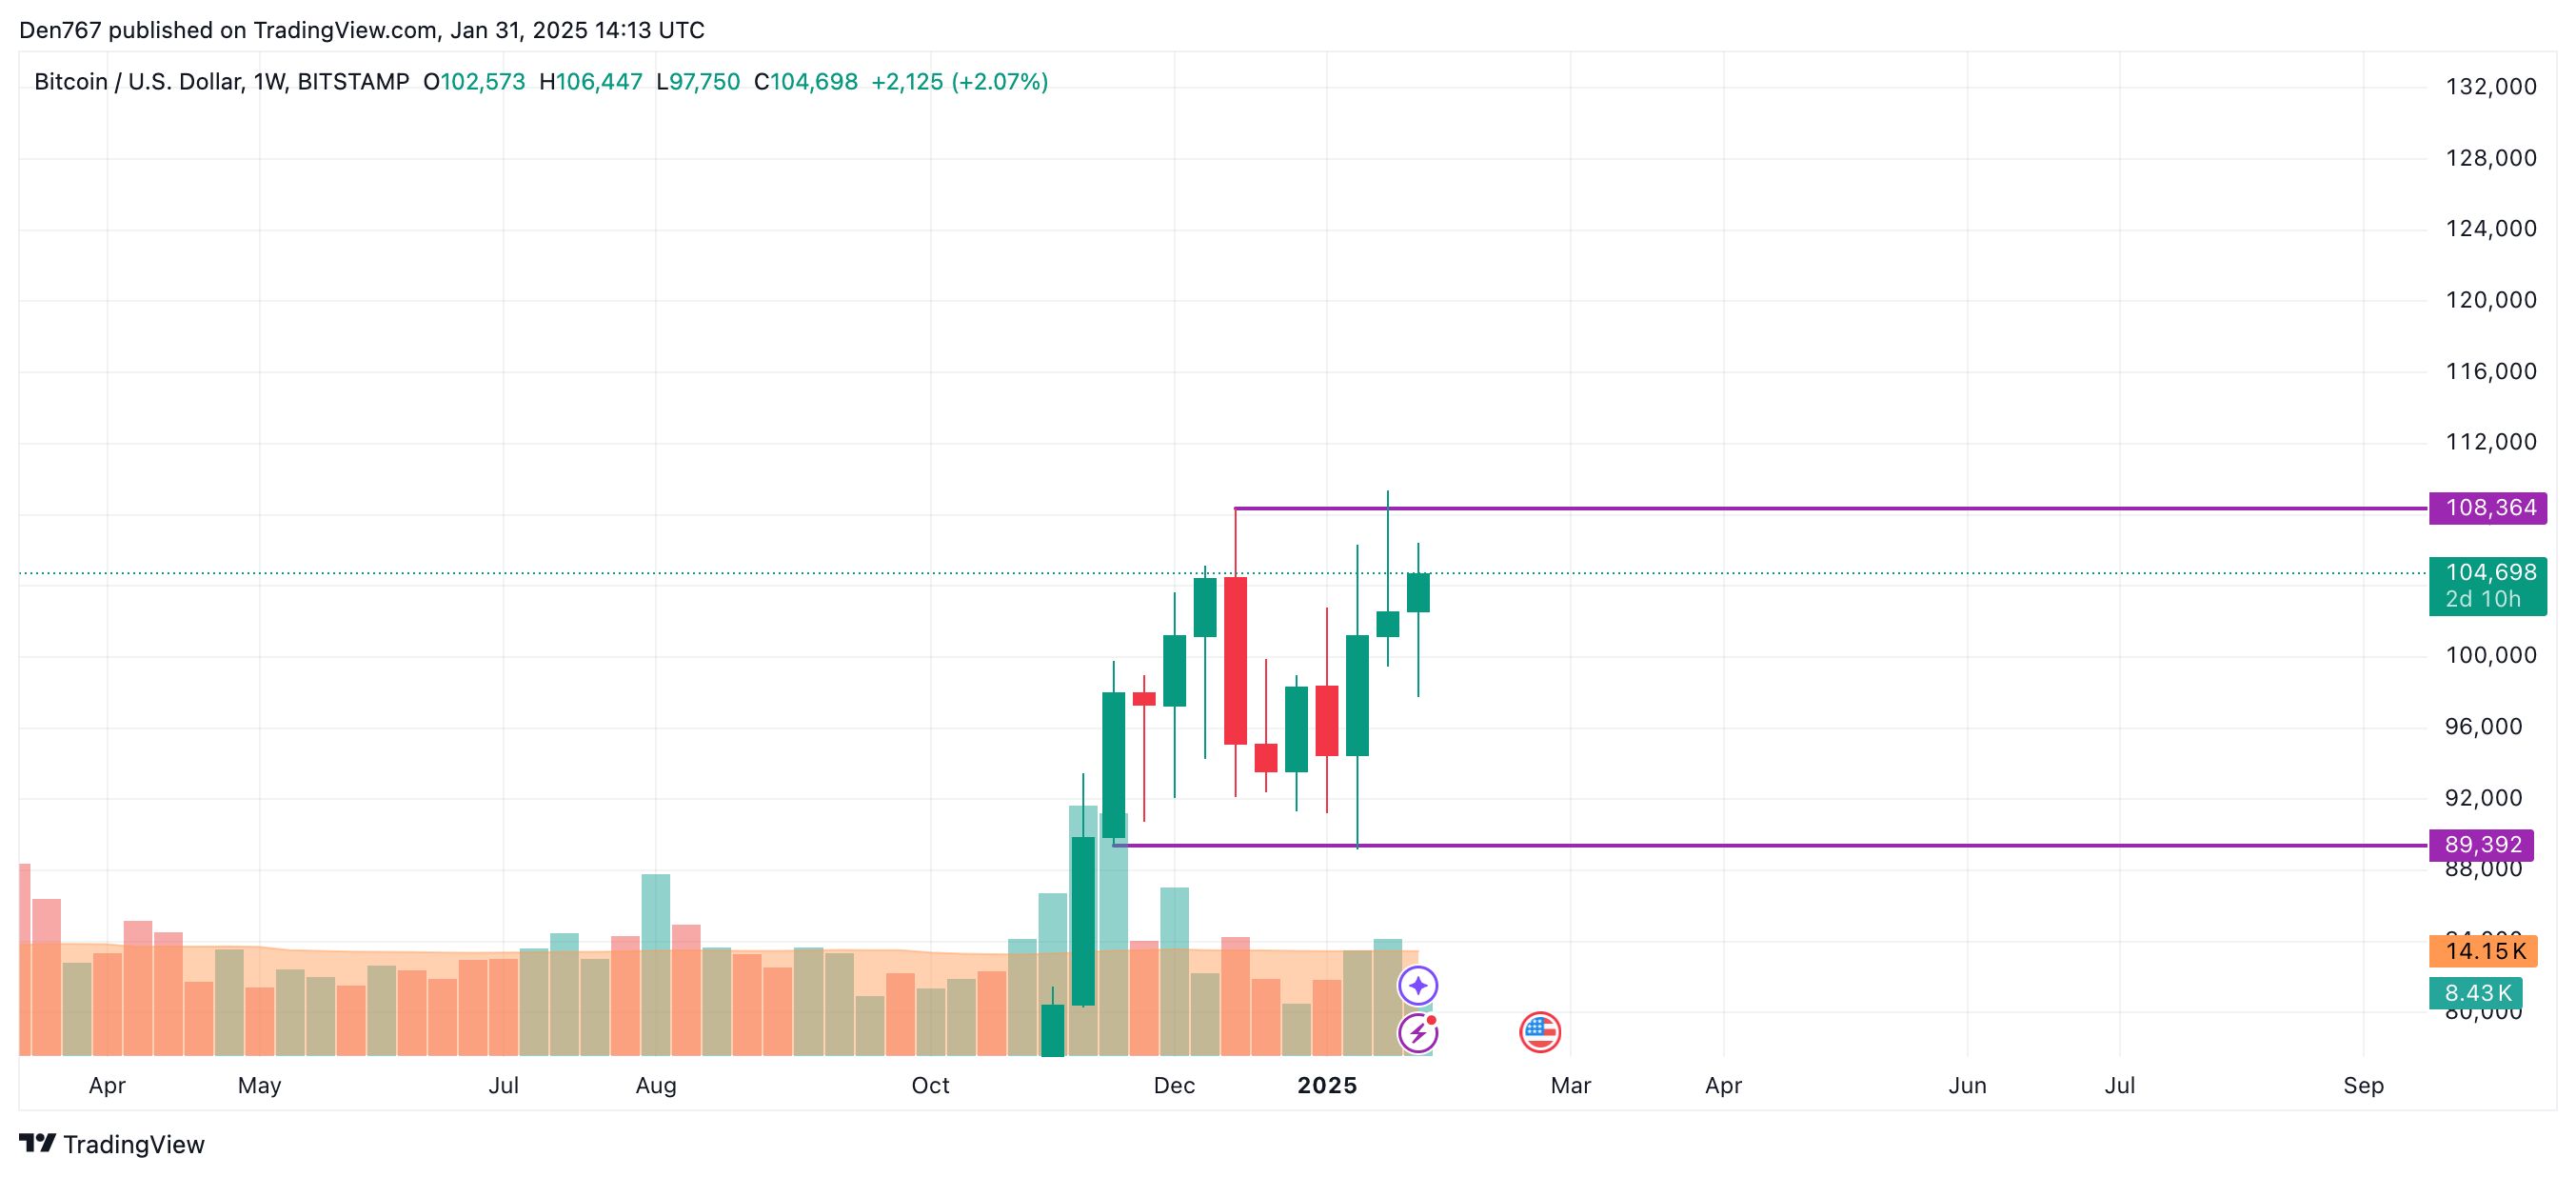
From the midterm point of view, traders should focus on the weekly bar's closure in terms of the $108,364 level. If it closes around that level, the accumulated energy might be enough to set new all-time highs.
Bitcoin is trading at $104,607 at press time.