Bitcoin and most altcoins continued their recent recovery after the U.S. published mixed consumer inflation data.
Bitcoin ($BTC) rose to $99,000 for the first time since January 7, gaining 10% from its monthly low. This rebound triggered more gains across altcoins, with Virtuals Protocol (VIRTUAL), ai16z (AI16Z), and Algorand (ALGO), which soared by over 13%.
The rally extended beyond cryptocurrencies to other asset classes. Futures tied to the Dow Jones Industrial Average rose by 700 points, while those linked to the S&P 500 index gained nearly 100 points. At the same time, bond yields fell, with the 10-year, 30-year, and 5-year yields dropping to 4.66%, 4.90%, and 4.48%, respectively.
A report from the U.S. Bureau of Labor Statistics showed that the core Consumer Price Index dropped from 0.3% in November to 0.2% in December. On an annual basis, core inflation decreased from 3.3% to 3.2%.
However, the headline CPI rose from 0.3% to 0.4% in December, translating to an annual increase of 2.9%.
US CPI inflation is out with the number that matters most in my opinion — the monthly core measure — being softer than expected. Specifically,
— Mohamed A. El-Erian (@elerianm) January 15, 2025
Core CPI rose 0.2% in December, below the 0.3% consensus forecast and bringing the annual measure to 3.3%; and
Headline rose 0.4%,…
Bitcoin and other altcoins rose in response to the encouraging core inflation data. Core inflation, which excludes volatile food and energy prices, is closely watched by the Federal Reserve. The decline in core CPI has fueled market expectations that the Fed may deliver more than two rate cuts this year.
While the inflation report provided some optimism, risks remain. Inflation is still above the Fed’s 2.0% target, and there are indications that it may stay elevated for longer. The ongoing fires in Los Angeles could contribute to rising costs for services such as insurance and rent.
Additionally, some of Donald Trump’s policies, such as mass deportations and tariffs, could lead to higher inflation pressures this year.
Bitcoin price analysis

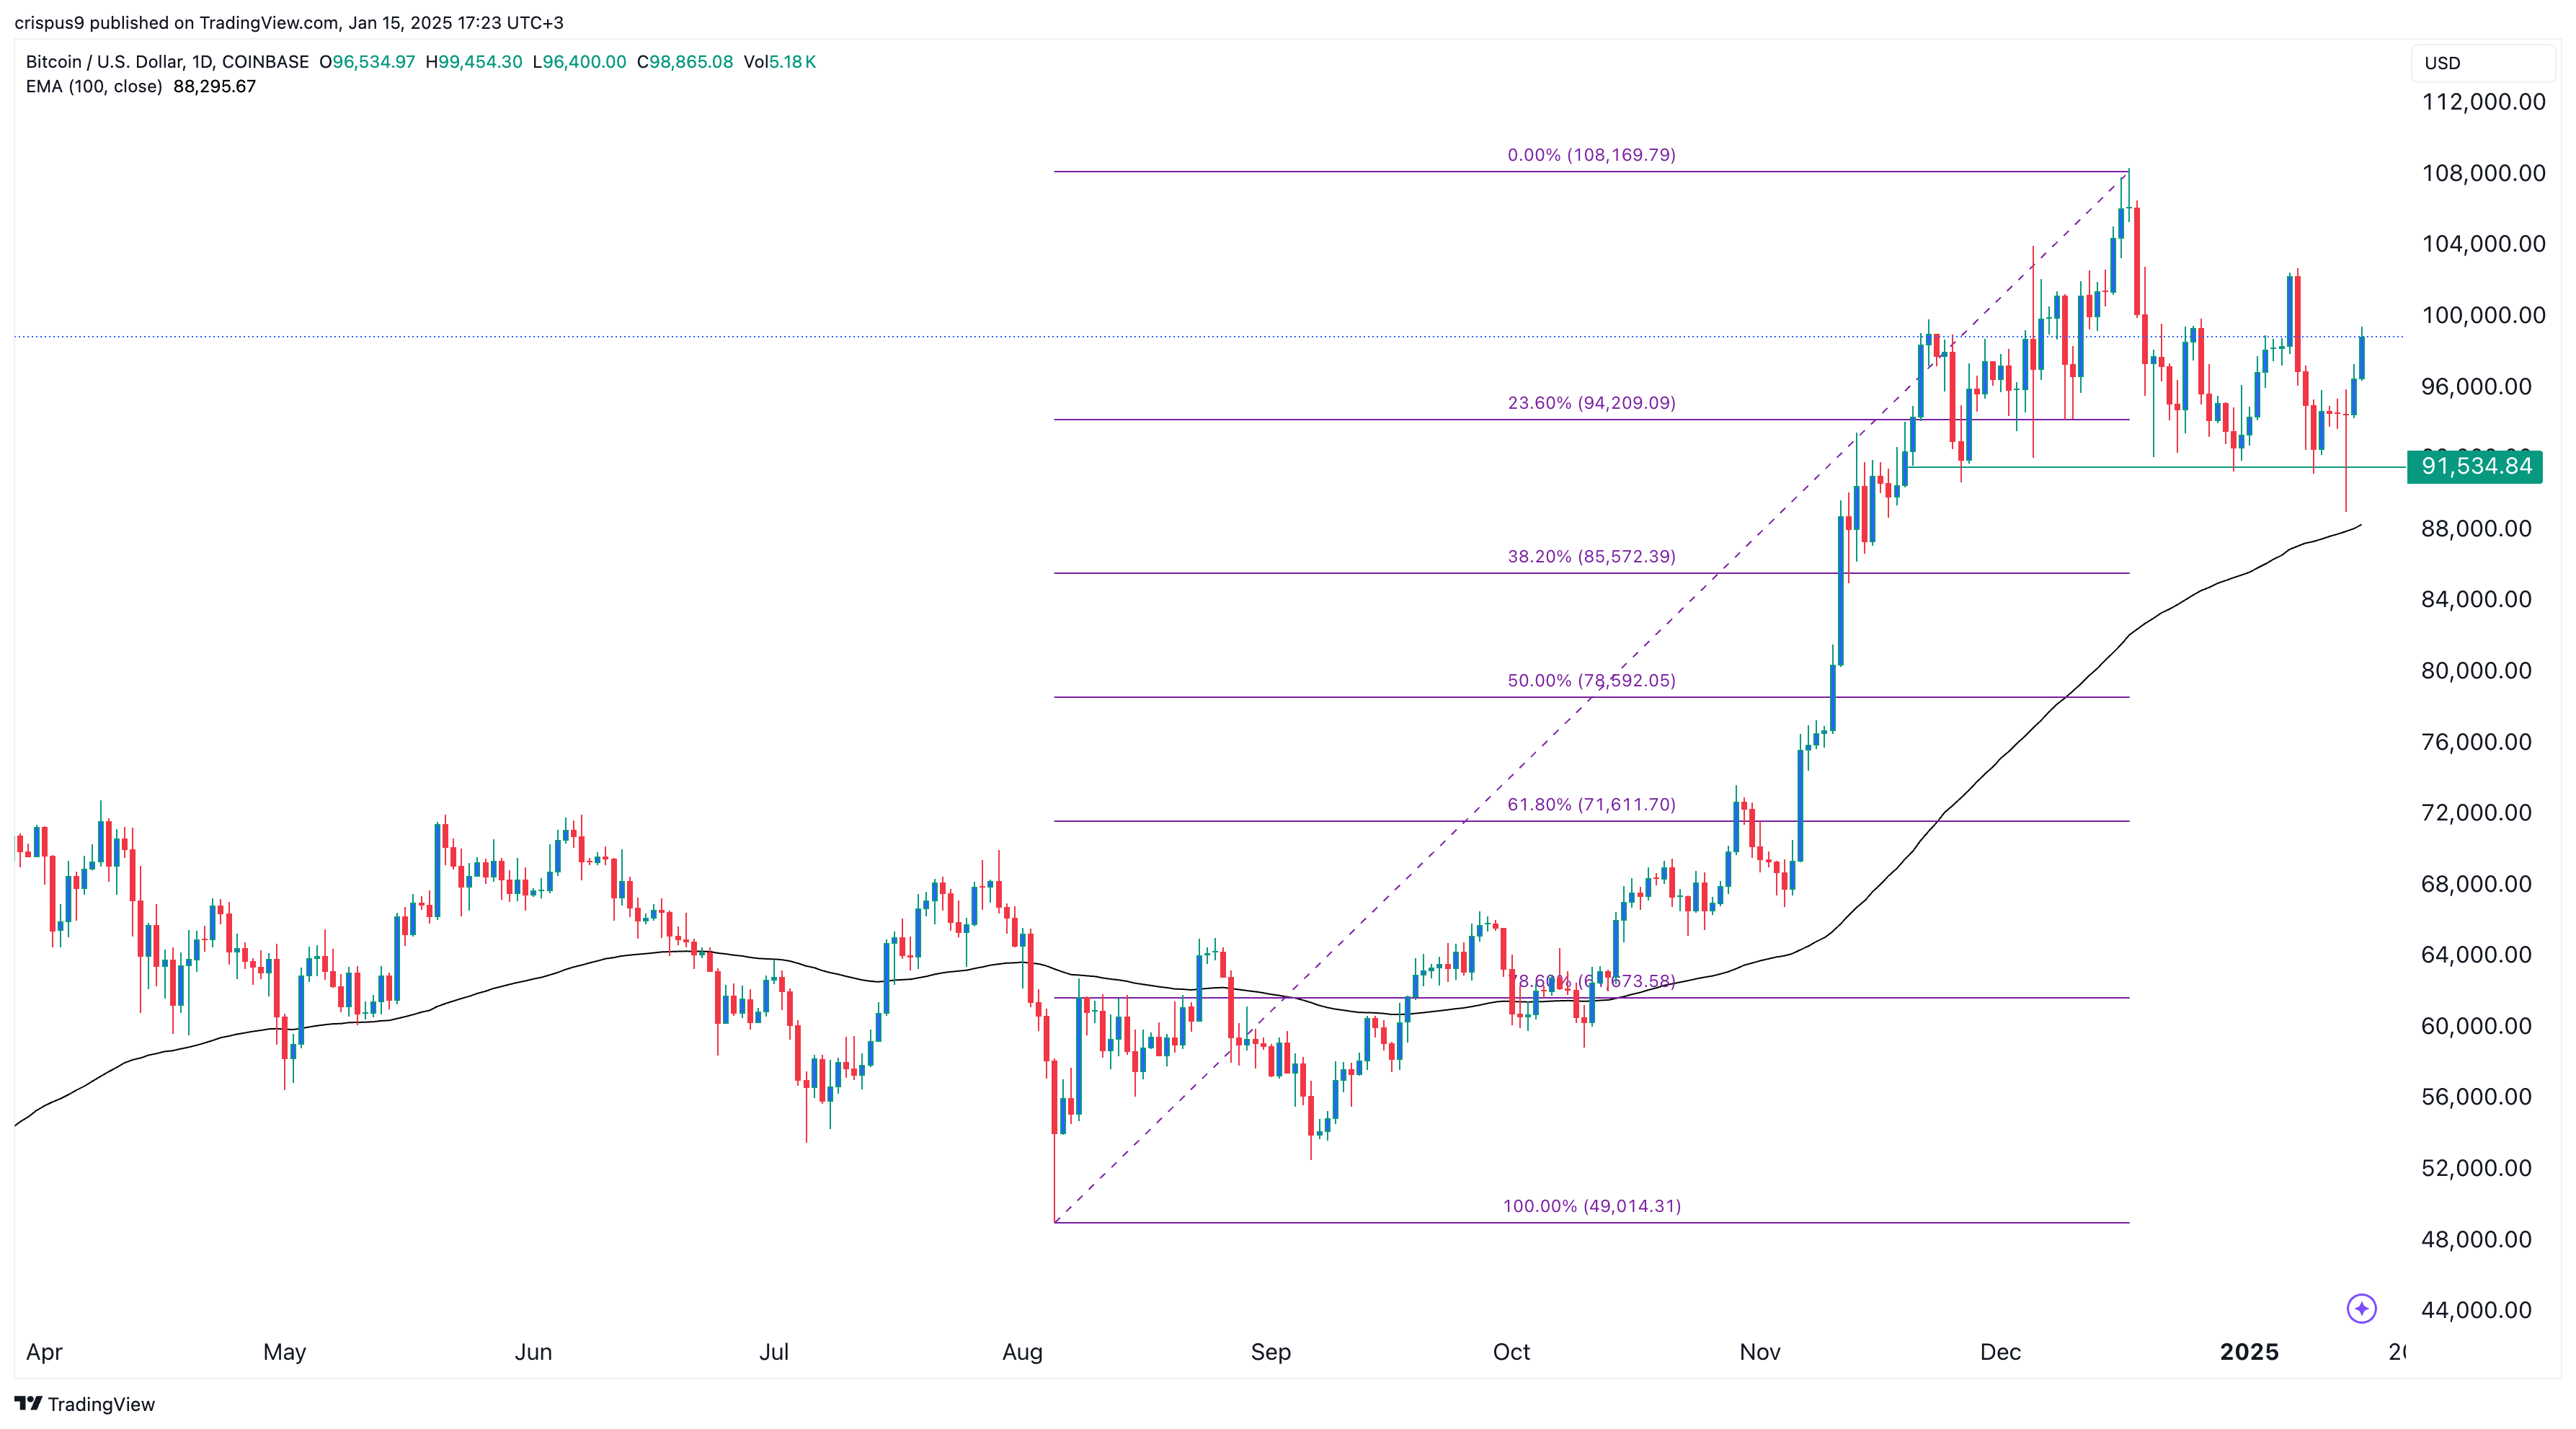
The daily chart shows that Bitcoin has been in a steady rebound over the past few days. This recovery began after the formation of a long-legged doji candlestick pattern on Monday, which is often seen as a bullish reversal signal.
Bitcoin has broken above the 23.6% Fibonacci Retracement level at $94,210 and surpassed the 100-day Exponential Moving Average. It has also moved above $91,535, a key support level it has held since November.
Looking ahead, Bitcoin may continue to rise in the coming days as investors anticipate Donald Trump’s inauguration next week. If bullish momentum continues, the cryptocurrency could retest its all-time high of $108,000. However, a drop below this week’s low of $89,000 would invalidate the bullish outlook.
