Bitcoin is trading at $96,156 with a market cap of $1.90 trillion, a 24-hour trade volume of $64 billion, and an intraday range of $89,164 to $97,328, reflecting mixed signals across technical indicators and timeframes.
Bitcoin
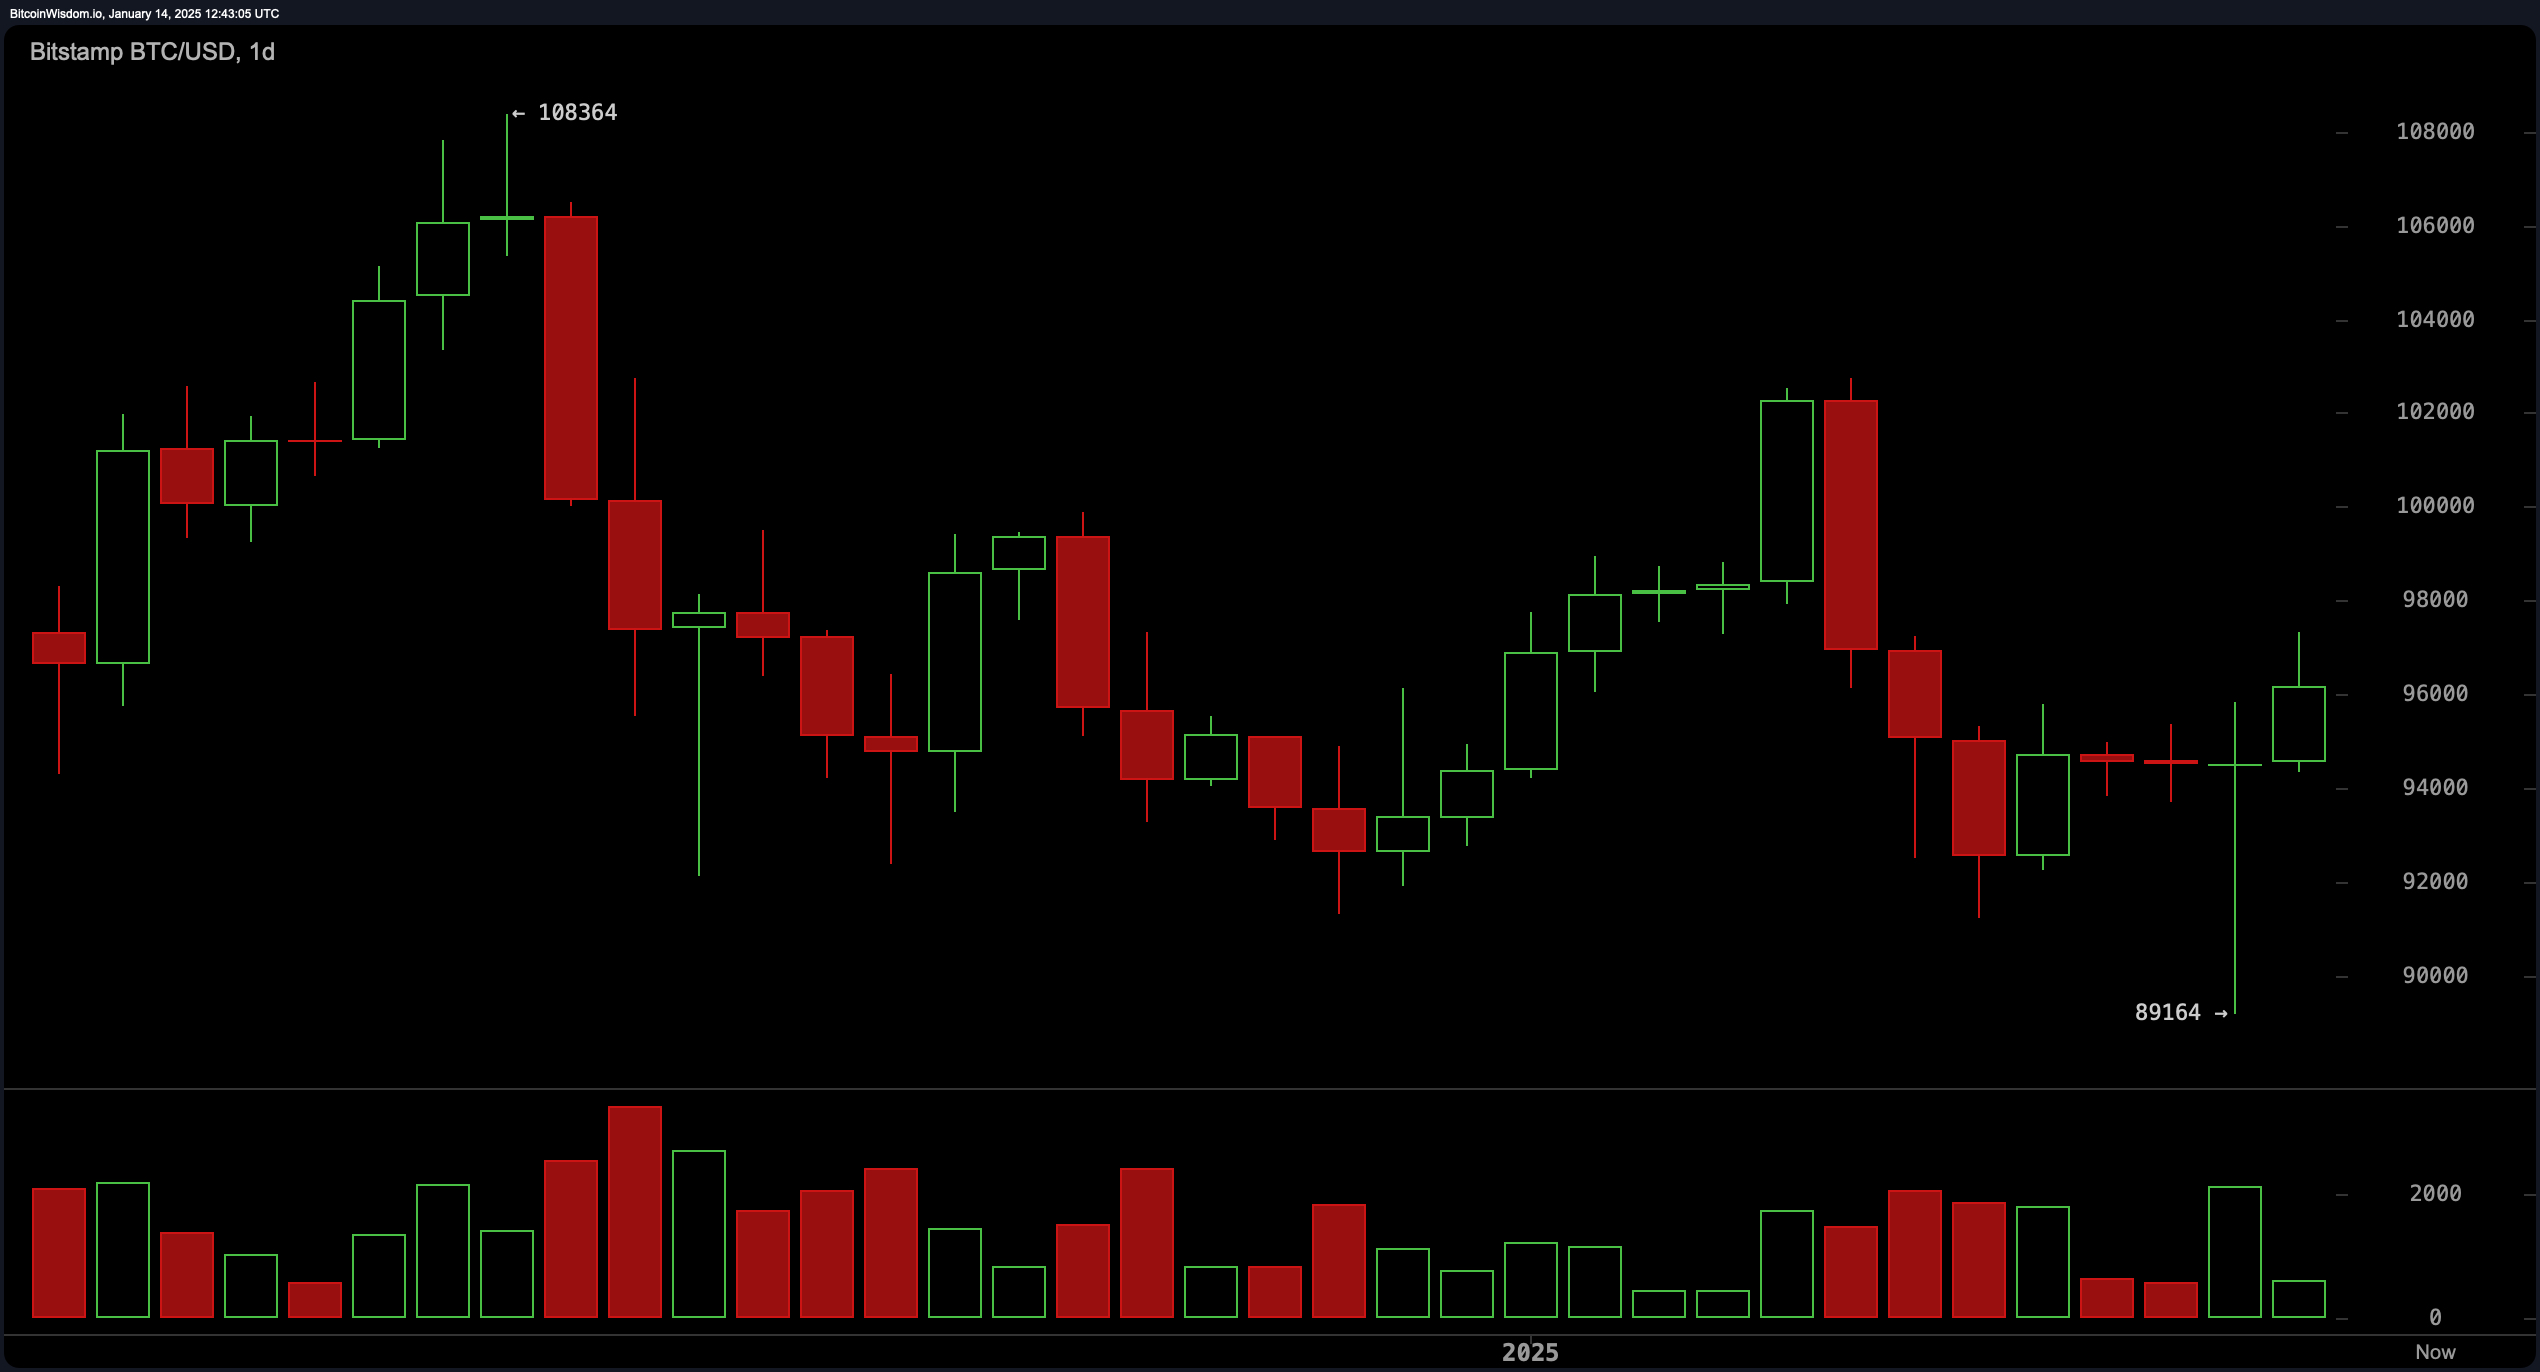
The daily chart shows bitcoin in a downtrend, with the price declining from a peak of $108,364 to a low of $89,164. Recent bullish attempts are weak, as evidenced by moderate buying volumes compared to high selling volumes during the decline. Entry above $98,000 may be considered if stronger buying momentum emerges, but cautious positioning remains essential given the broader trend.

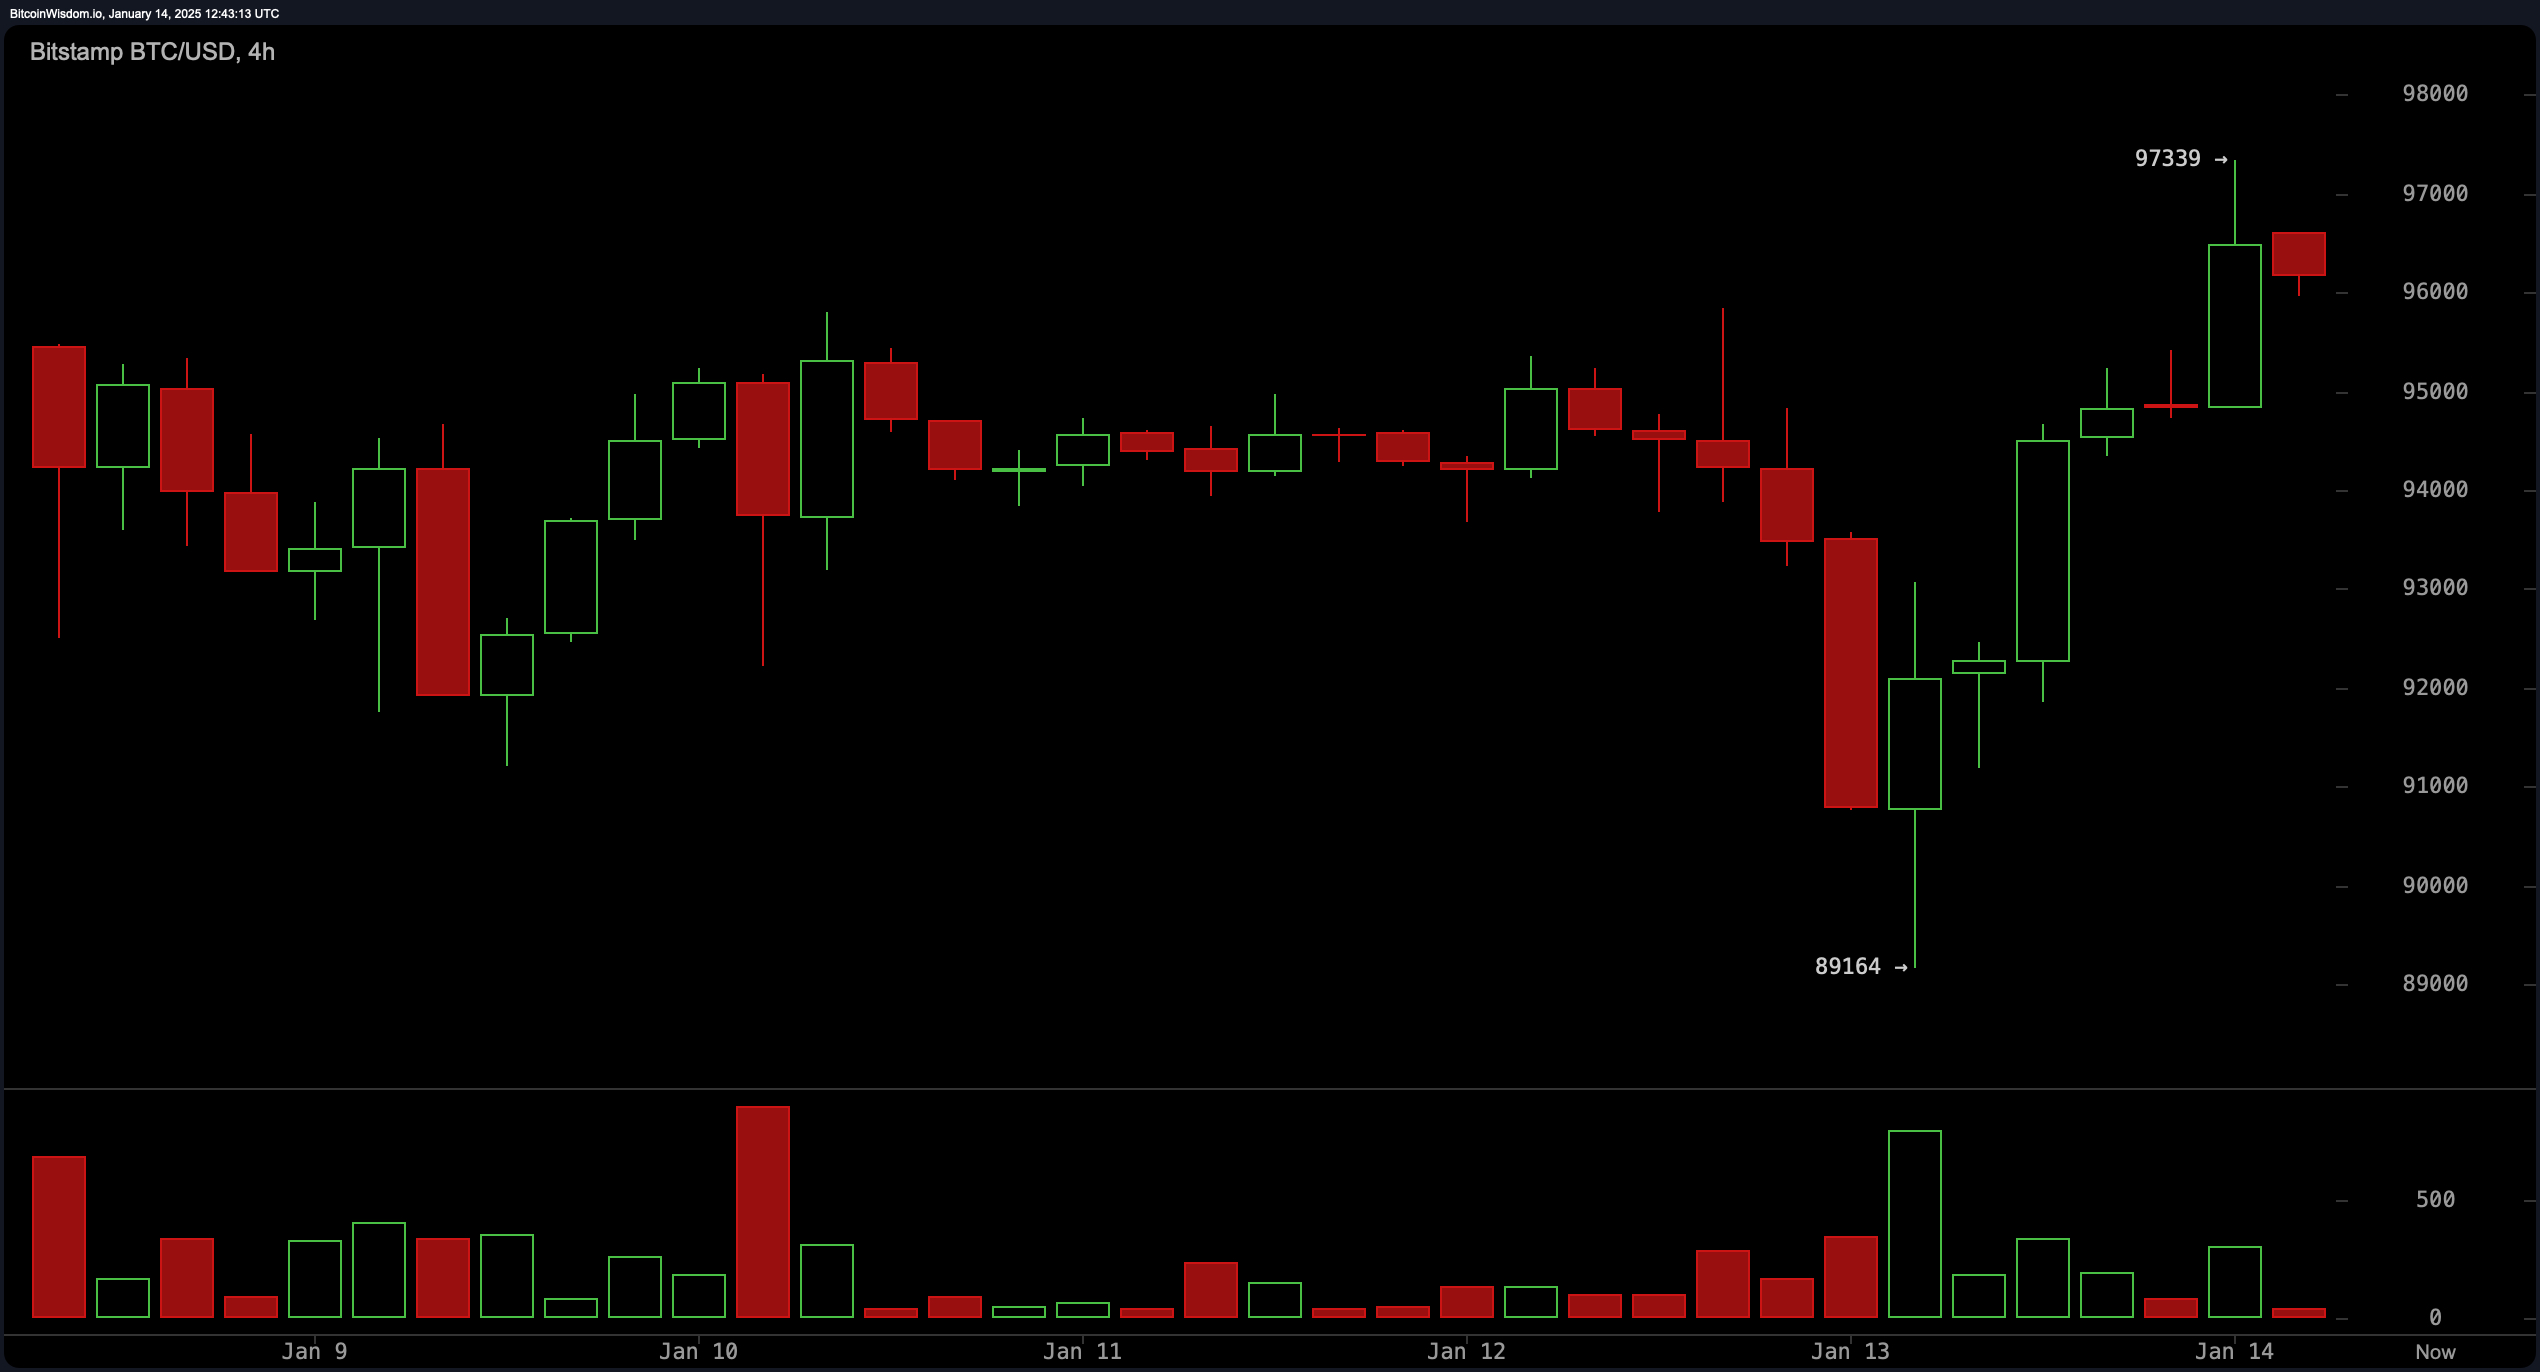
On the four-hour chart, bitcoin has experienced consolidation around $91,000, followed by a minor upward movement supported by a bullish engulfing pattern. Large selling volumes during the drop confirm bearish dominance, while lower buying volumes in recovery indicate a potential bear trap. Short-term entries could target a break above $97,000, with stop-losses near $94,000.

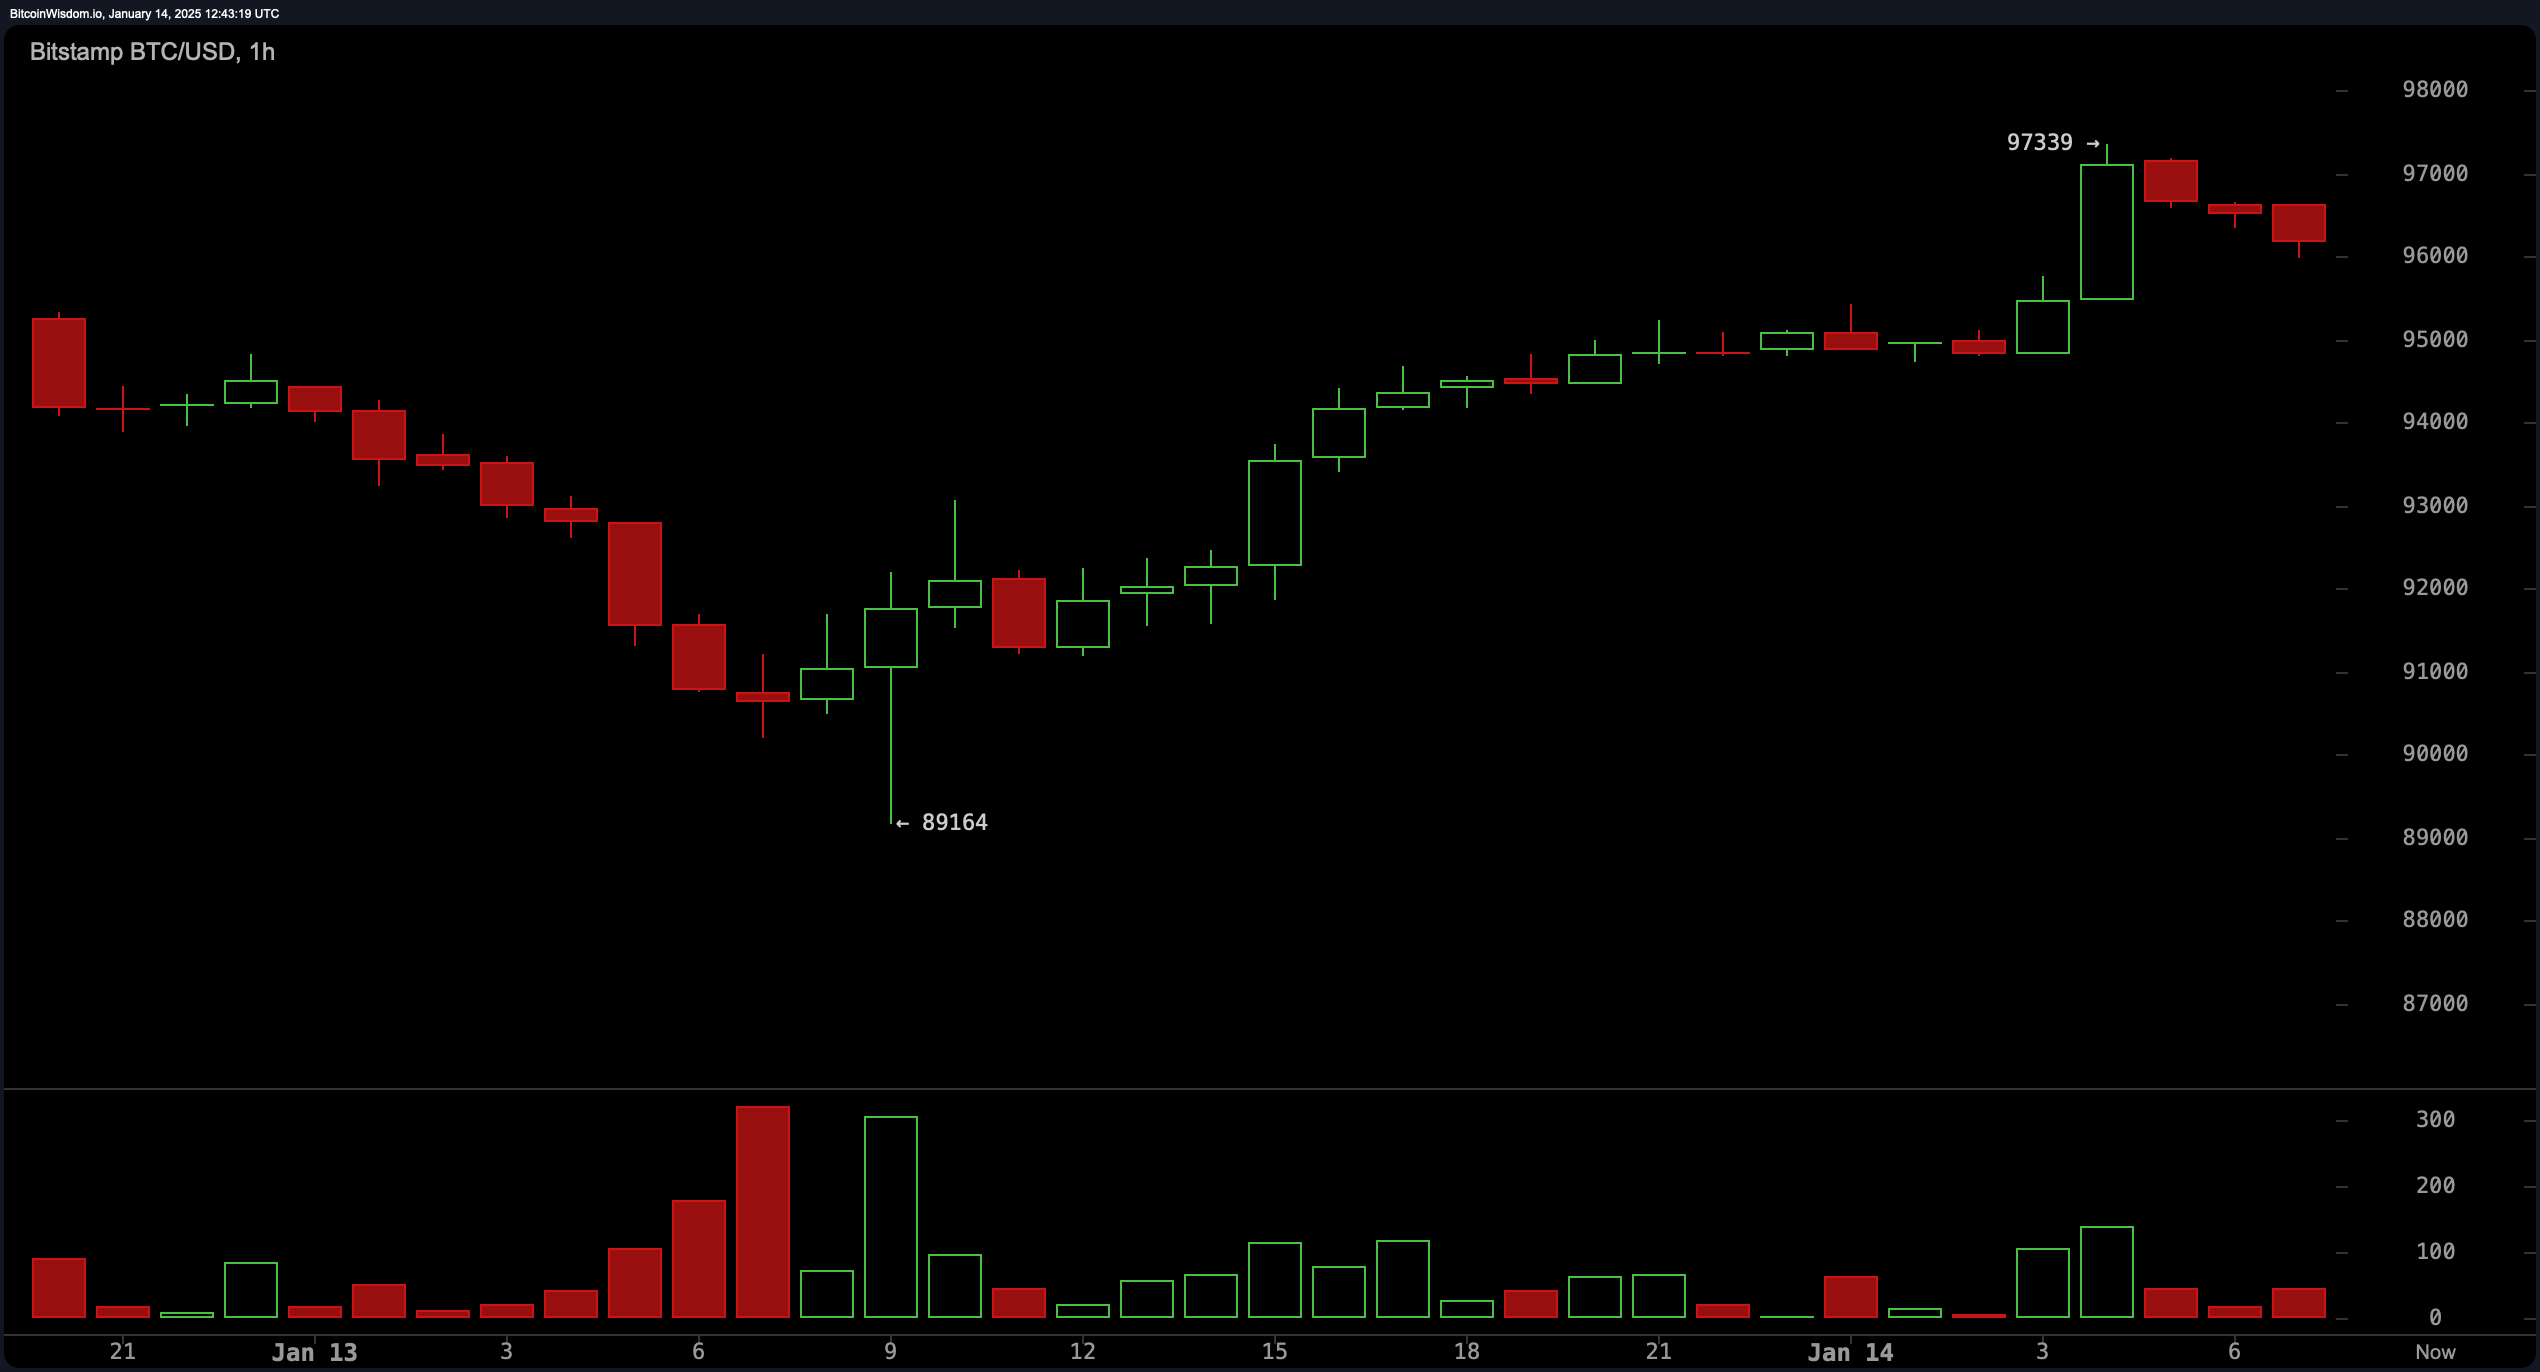
The hourly chart highlights a sharp rebound from $89,164 but reveals reduced momentum as the price approaches $97,000. High buying volumes at lower levels suggest accumulation, yet declining volume during consolidation implies reduced market interest. Scalpers may find opportunities above $97,300, aiming for resistance near $98,500 with tight stops.

Oscillators are largely neutral, with the relative strength index (RSI) at 50 and the stochastic indicator at 40. The momentum indicator suggests a buy signal, while the moving average convergence divergence (MACD) points to selling pressure. Moving averages (MAs) favor bullish sentiment, as exponential moving averages (EMAs) and simple moving averages (SMAs) for most timeframes indicate buying opportunities, apart from the 30-period SMA and 50-period SMA, which signal a sell.
Bull Verdict:
If bitcoin breaks above $98,000 with sustained buying momentum and improved volume, it could target further upside, supported by positive signals from most moving averages and underlying accumulation.
Bear Verdict:
Without a clear breakout above resistance at $97,328, continued bearish sentiment may prevail, with the risk of a retest of lower support levels around $89,164 driven by weak follow-through on bullish attempts.
 news.bitcoin.com
