Bitcoin, currently priced at $98,309, commands a market capitalization of $1.94 trillion with a 24-hour trading volume of $19.92 billion. It has fluctuated within an intraday range of $97,292 to $98,626, presenting a pivotal moment for its trajectory.
Bitcoin
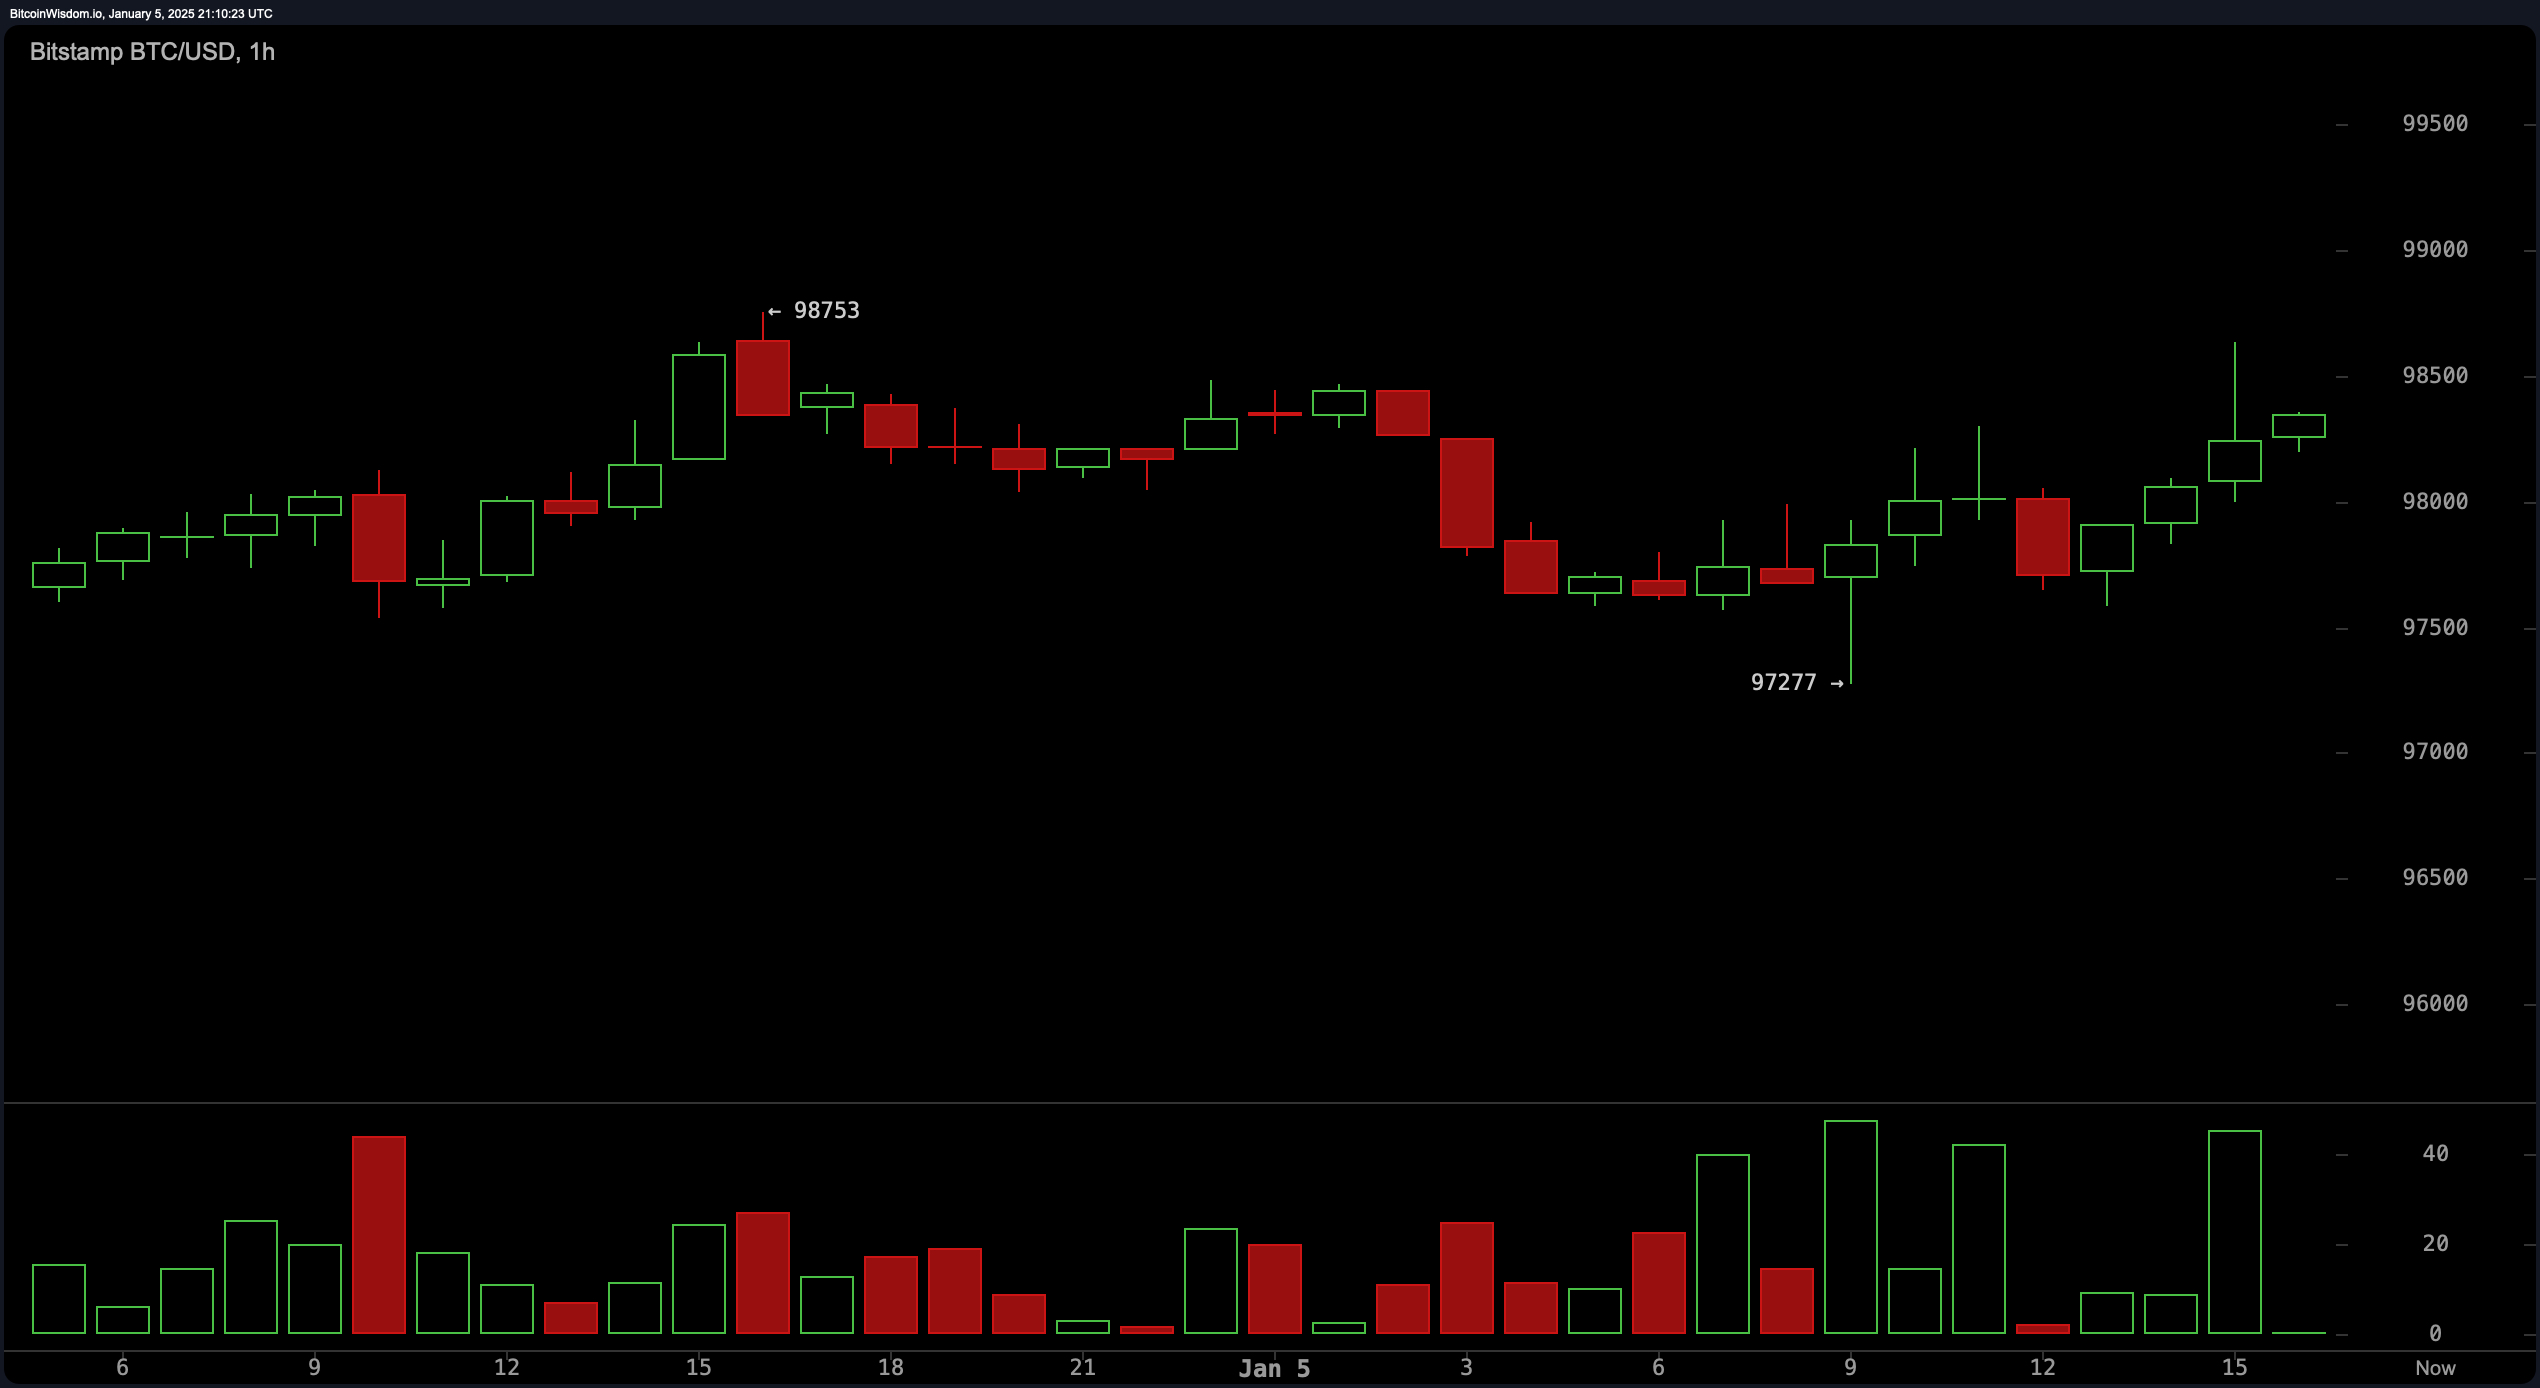
On the 1-hour chart, bitcoin probes the $98,000 resistance level after rebounding from $97,277. Bullish candles hint at upward momentum, but diminished volume tempers expectations of a decisive breakout. Traders are left to watch whether this resistance will hold firm or give way, potentially settling near $97,000. The immediate trend leans positive, though a palpable hesitancy surrounds the approach to these critical thresholds.

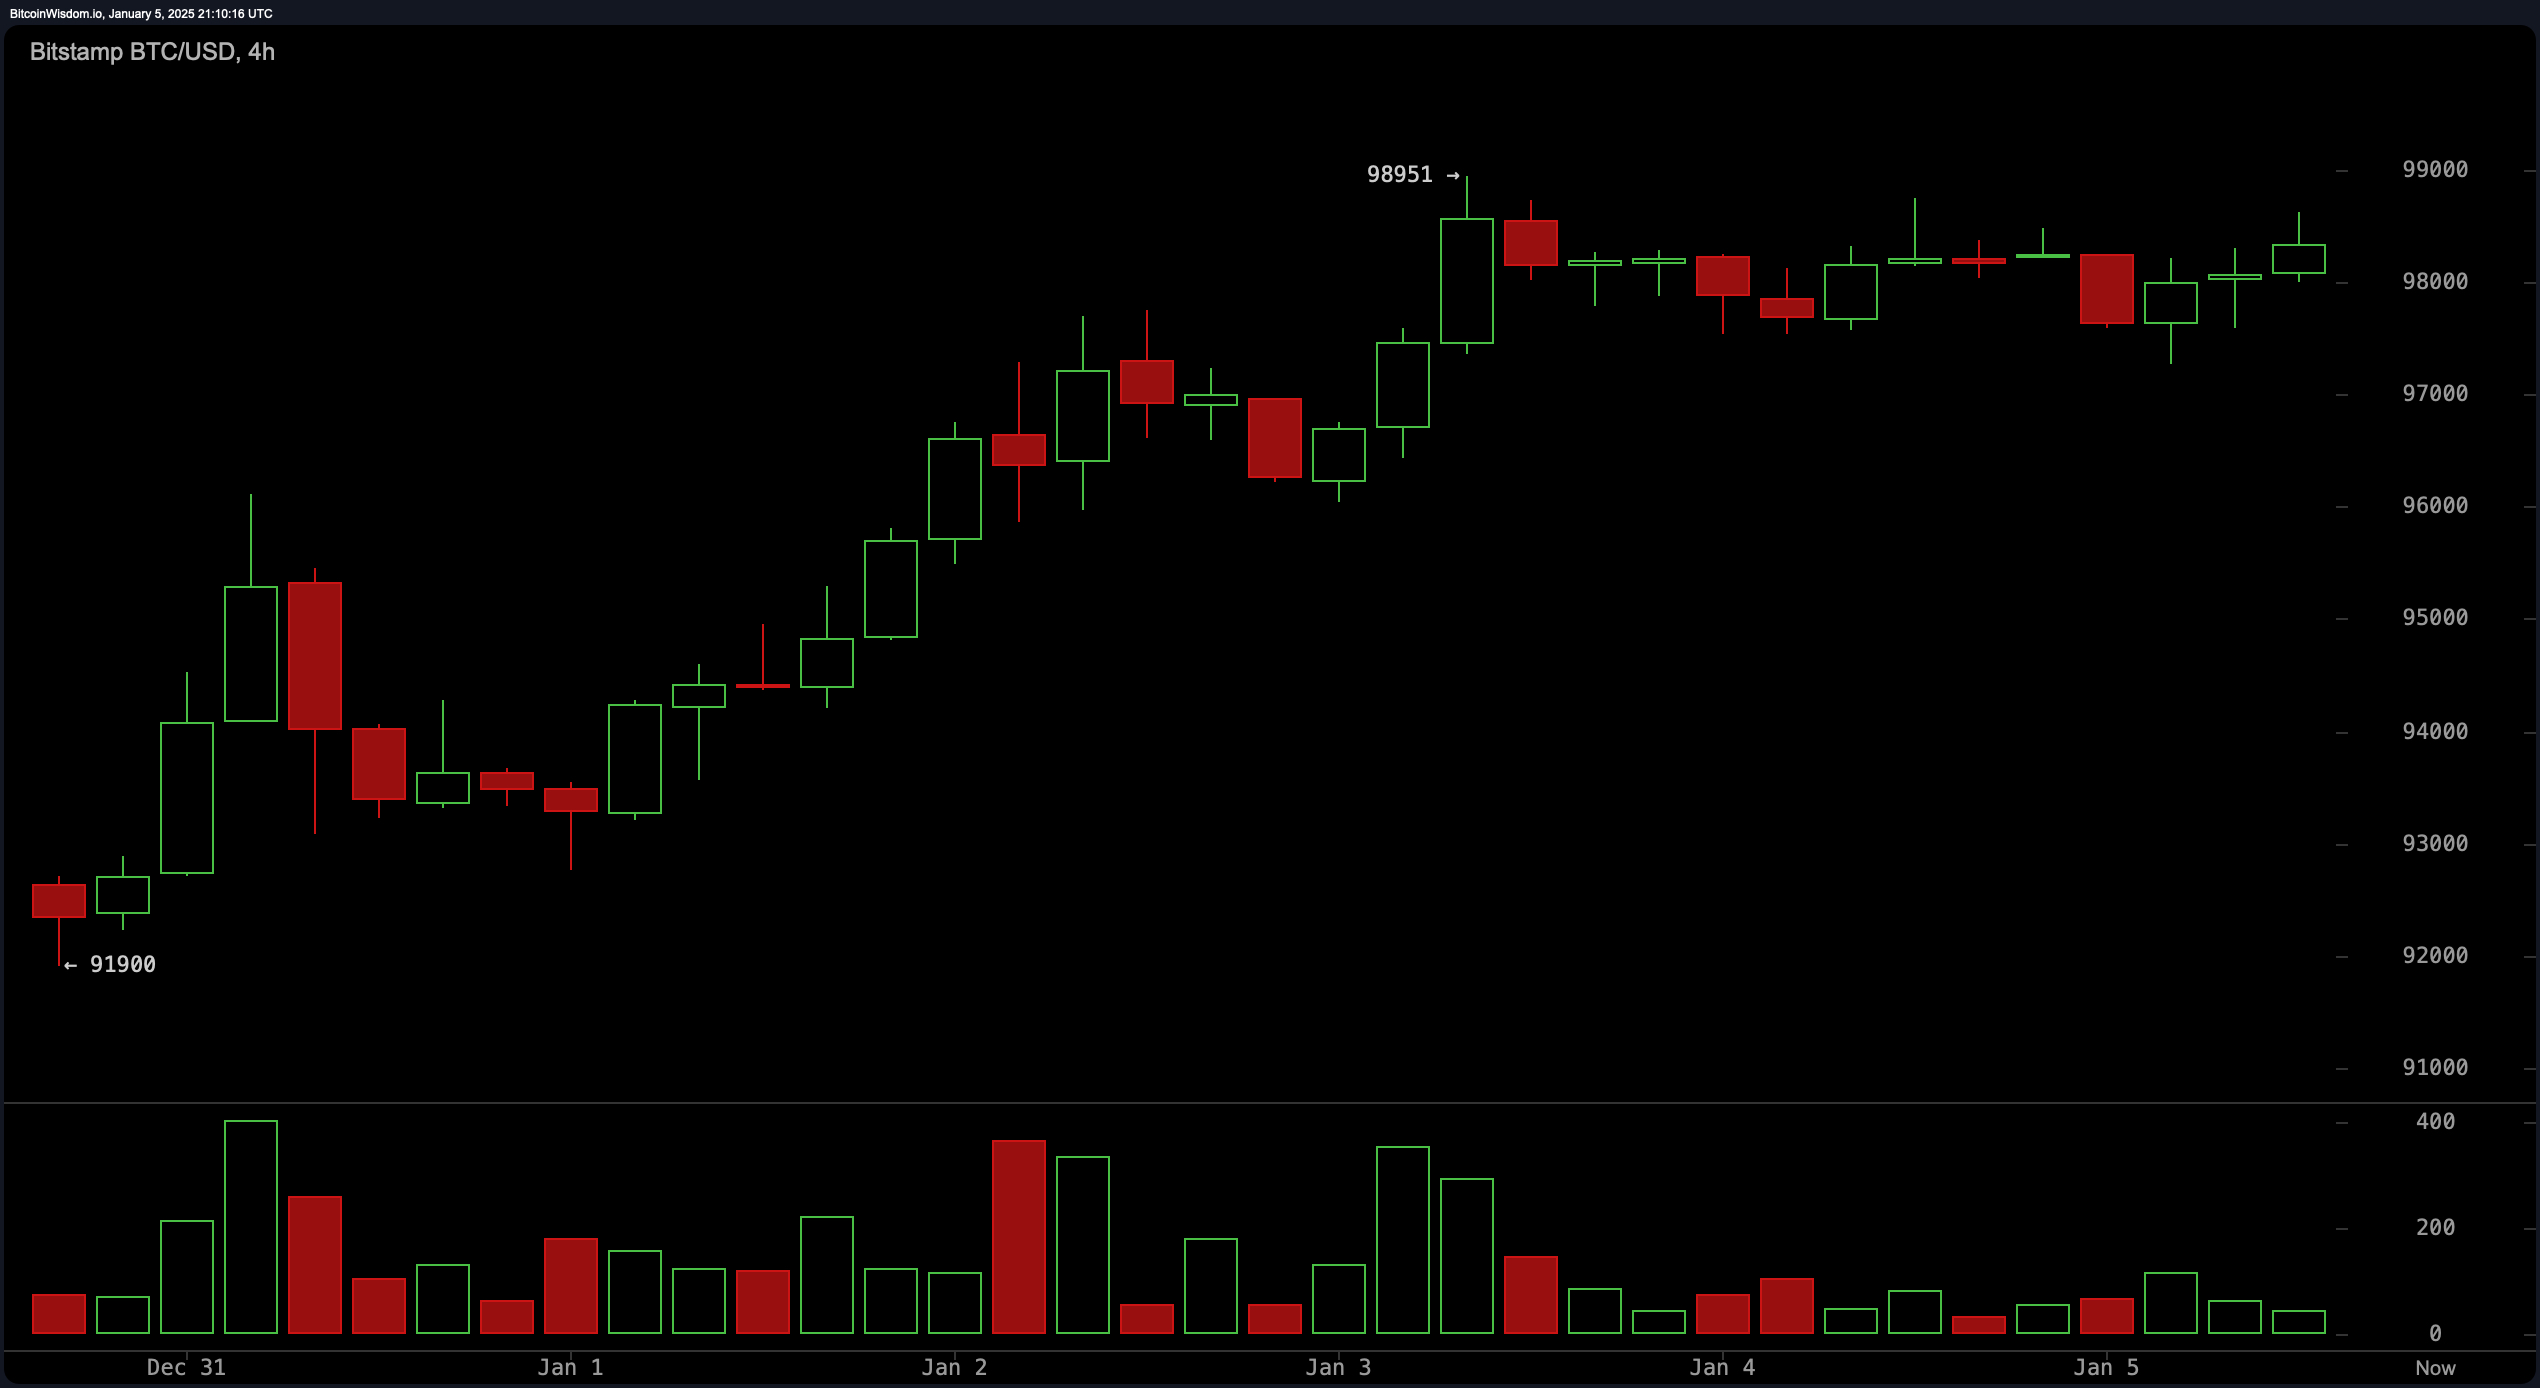
Zooming out to the 4-hour timeframe, bitcoin exhibits a consistent pattern of higher lows, reinforcing a short-term bullish sentiment. A significant resistance hovers at $98,951, repeatedly thwarting attempts to surpass it. Variability in trading volume complicates the outlook, as a sustained move above $98,951 might propel the price toward $100,000. Conversely, if this resistance remains intact, a fallback to the $96,000–$95,000 support zone is still plausible.

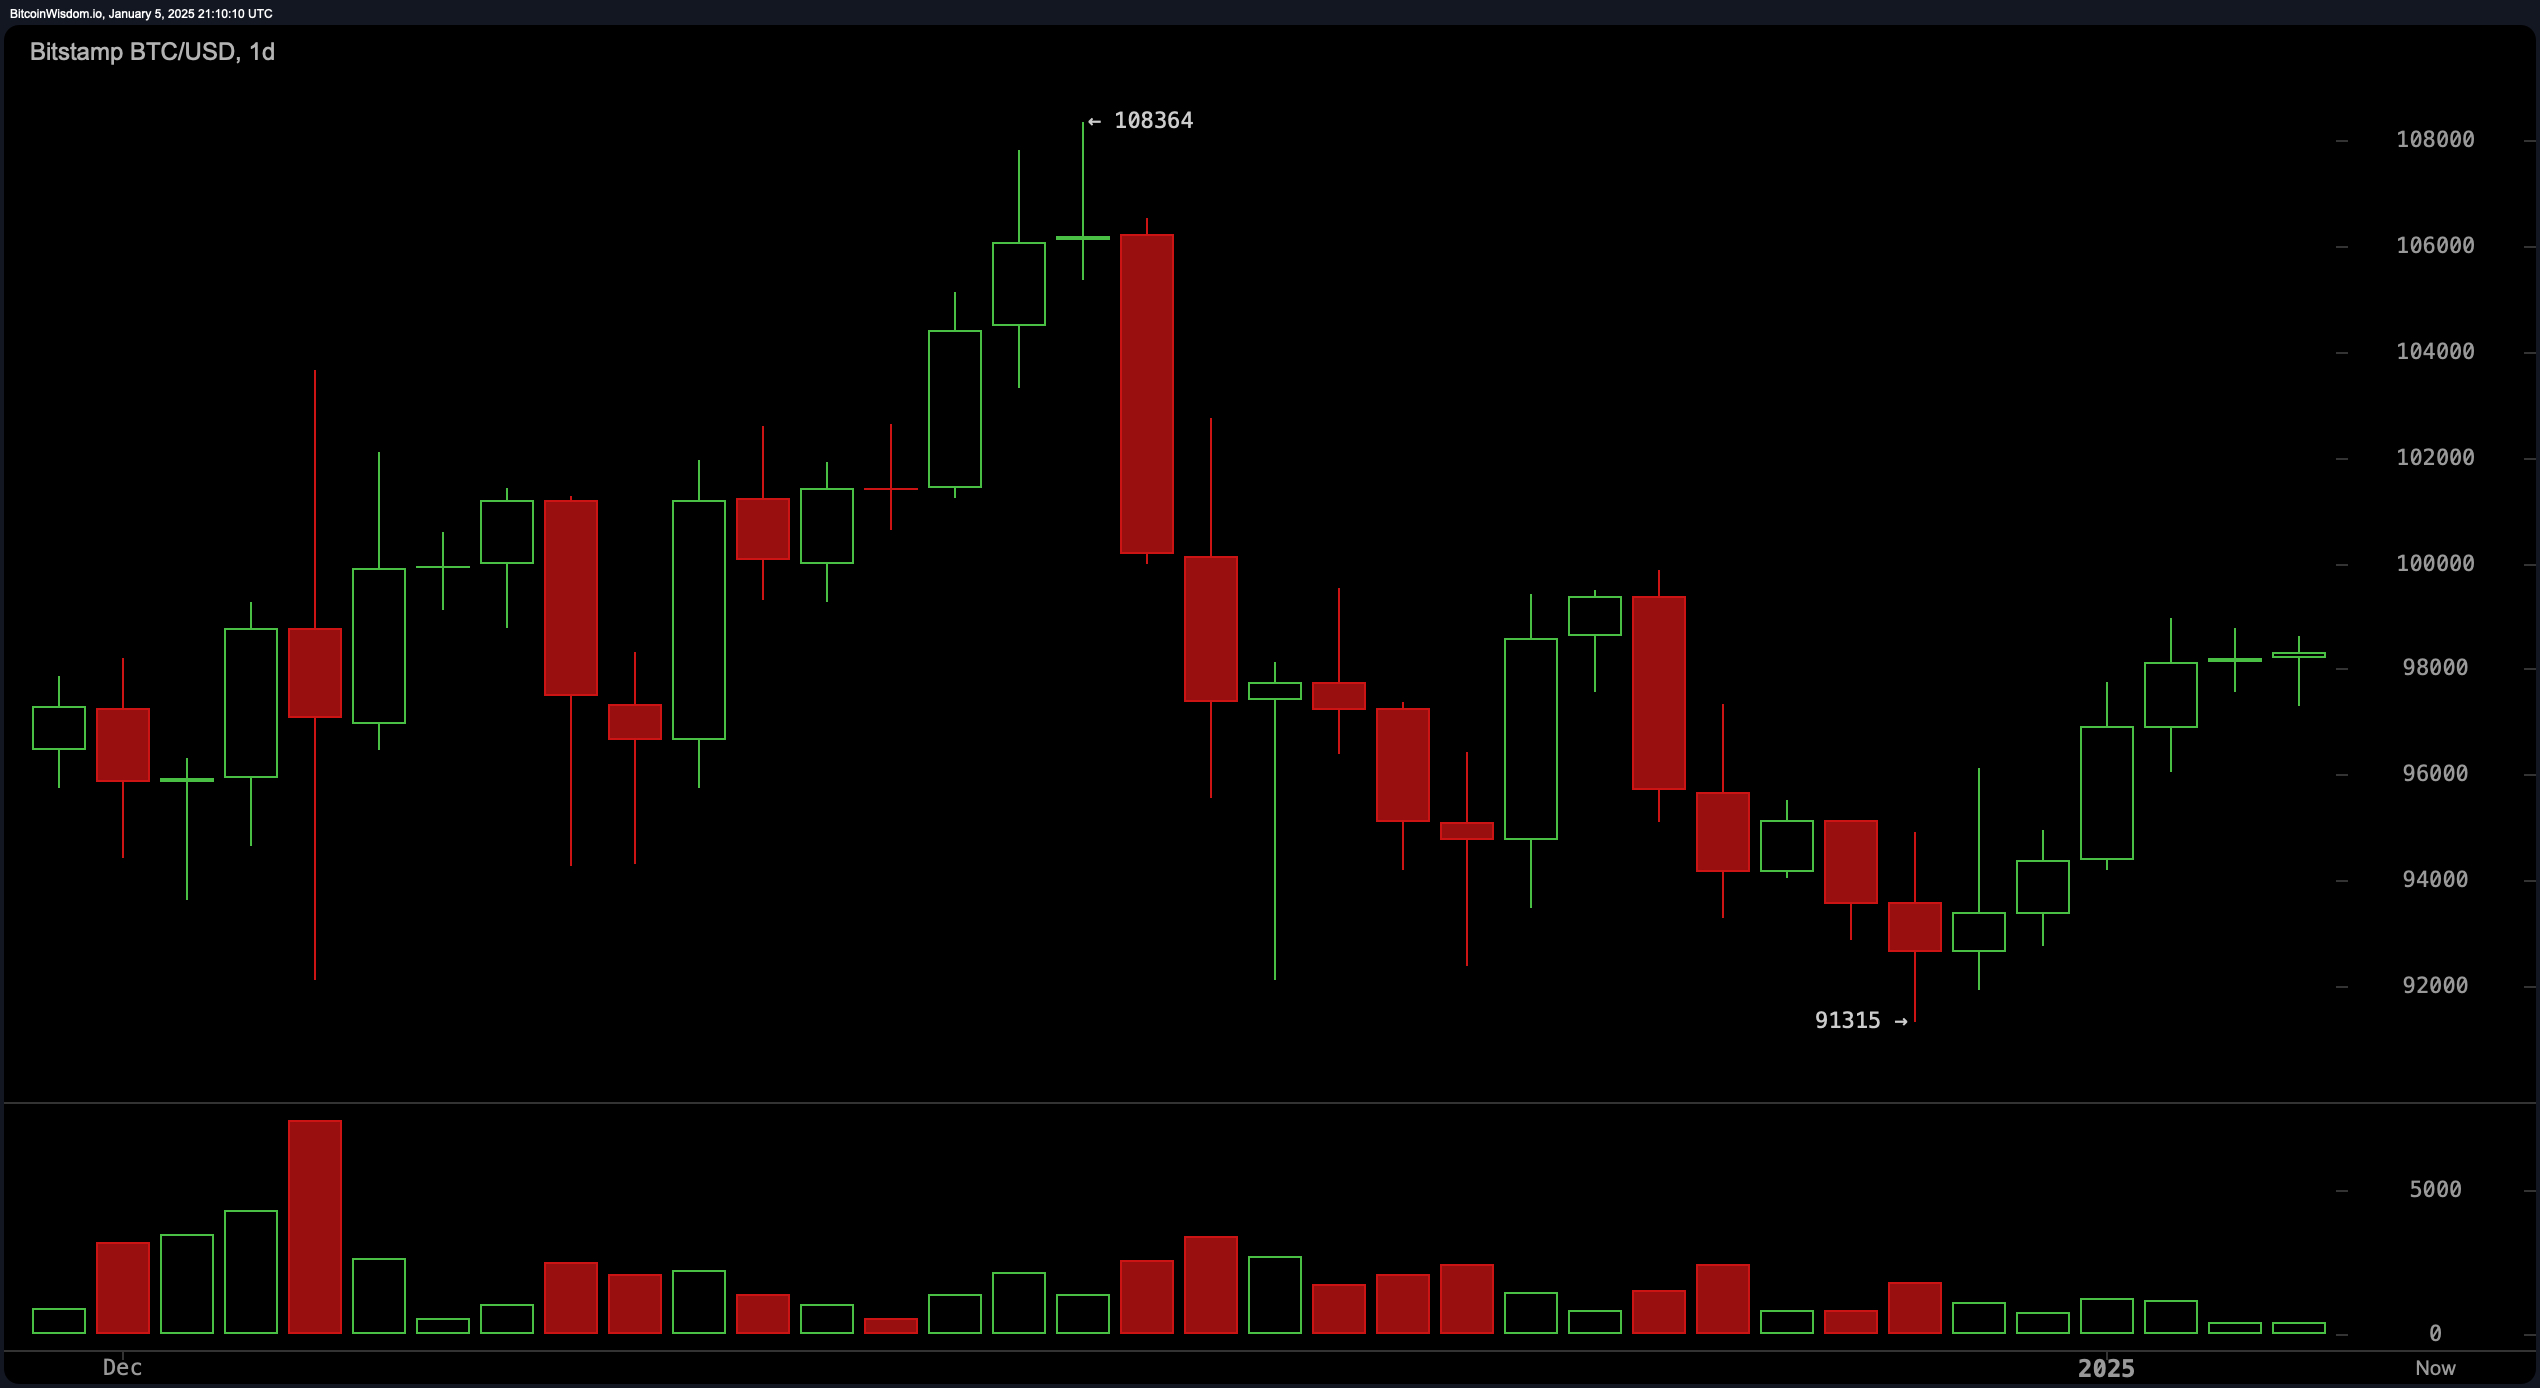
A daily analysis reveals a broader bullish framework, with bitcoin recovering from a recent low of $91,315. Price movements indicate an active effort to break through the $98,000–$100,000 resistance corridor. Such a breakthrough could ignite notable upward momentum, provided trading volumes increase. However, current waning activity suggests a potential period of consolidation. Should resistance persist, a retreat to the $95,000–$92,000 range remains possible.

Technical indicators reflect a largely neutral stance. The relative strength index (RSI) is at 55, while the Stochastic oscillator reads 81, and the commodity channel index (CCI) sits at 34. The average directional index (ADX), at 20, suggests no prevailing trend direction at the moment. Nevertheless, the momentum oscillator and the moving average convergence divergence (MACD) both signal an inclination toward upward movement.
Moving averages (MAs) lend credence to a bullish outlook. Both exponential moving averages (EMAs) and simple moving averages (SMAs) across multiple periods suggest buying opportunities. The 10-period EMA at $96,688 and SMA at $95,485 provide immediate support, while the 30-period SMA at $98,229 aligns with short-term resistance. This configuration exemplifies the current consolidation zone where bitcoin navigates its next move. By 5 p.m. Eastern Time (ET) on Sunday evening, bitcoin was exchanging hands for $98,398 per coin.
Bull Verdict:
Bitcoin’s short-term bullish trend continues to show promise, with consistent higher lows and potential for a breakout above the $98,951 resistance level. If volume strengthens and buyers hold momentum, a move toward the psychological $100,000 milestone could soon materialize. Support from moving averages further bolsters the case for an optimistic outlook.
Bear Verdict:
Despite attempts to breach critical resistance, bitcoin’s lackluster trading volume raises concerns about sustainability. If the $98,951 barrier persists, a retracement toward the $96,000–$95,000 zone becomes increasingly likely. In a bearish scenario, waning buyer interest could even see prices test deeper support near $92,000. Caution remains key as uncertainty looms.
 news.bitcoin.com
