The rationale behind this claim is Bitcoin’s action around the 50-day moving average (50MA) on the daily price chart. The 50-day MA is a common technical indicator used to track the medium-term trend of an asset’s price (Bitcoin, in this scenario).
In Bitcoin’s case — from the highlighted charts, the 50-day moving average has served as significant support and resistance points in the past. It appears that the Bitcoin price successfully broke underneath the 50-day MA and has climbed back to retest the breached support.
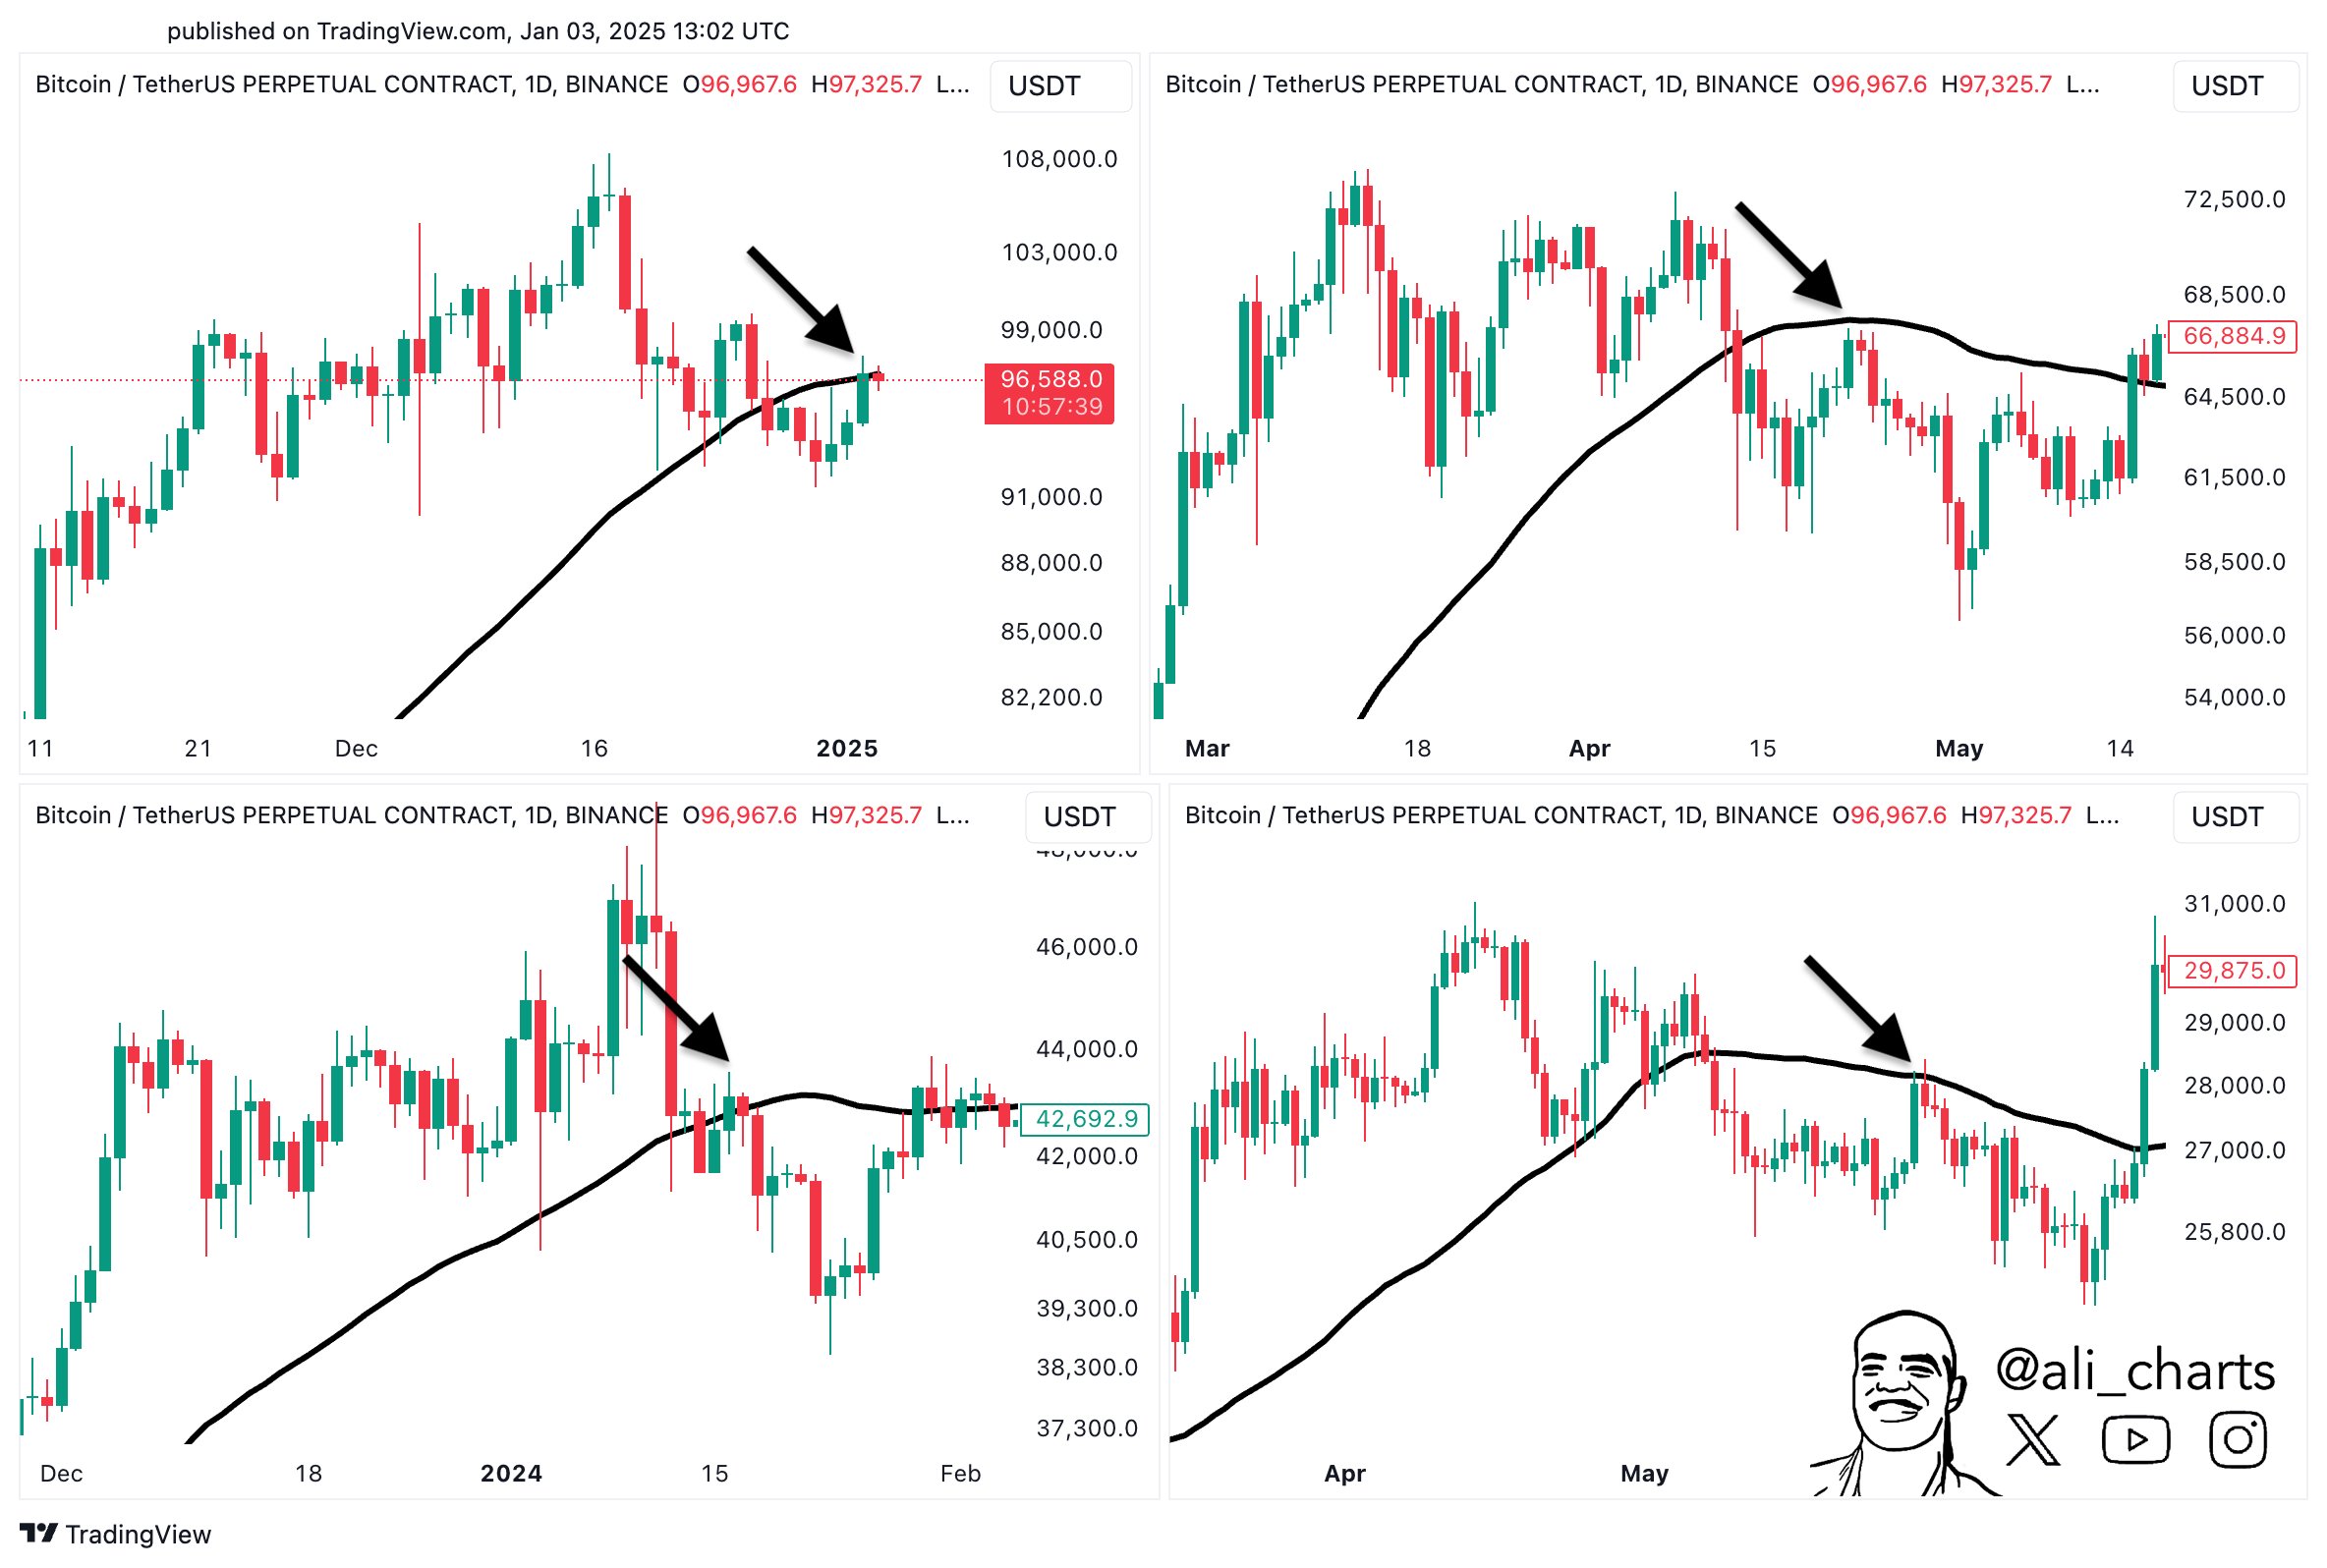
According to Martinez, the price of the premier cryptocurrency is at risk of moving to the downside once the retest is complete. However, the analyst noted that a sustained close above the 50-day moving average could invalidate the bearish projection for Bitcoin and perhaps signal the end of the ongoing price correction.
As of this writing, the price of Bitcoin stands at around $98,358, reflecting a 1% increase in the past day. According to data from CoinGecko, the flagship cryptocurrency is up by nearly 5% in the last seven days.
Can Growing Exchange Outflows Trigger Fresh Bullish Momentum?
In another post on X, Martinez revealed that significant amounts of Bitcoin have been flowing out of exchanges in the past week. Data from CryptoQuant shows that over 48,000 $BTC (worth more than $4.5 billion) have been withdrawn from exchanges in the past seven days.
This funds’ movement signals a shift in sentiment, as investors are moving their coins to non-custodial wallets possibly for long-term storage. This could suggest that investors are becoming increasingly confident in the future promise of the market leader.
The increased flow of coins from centralized exchanges could also indicate fresh buying activity, with investors choosing to store their newly acquired assets off the trading platforms. Ultimately, this exchange outflow could be a bullish signal for the Bitcoin price.
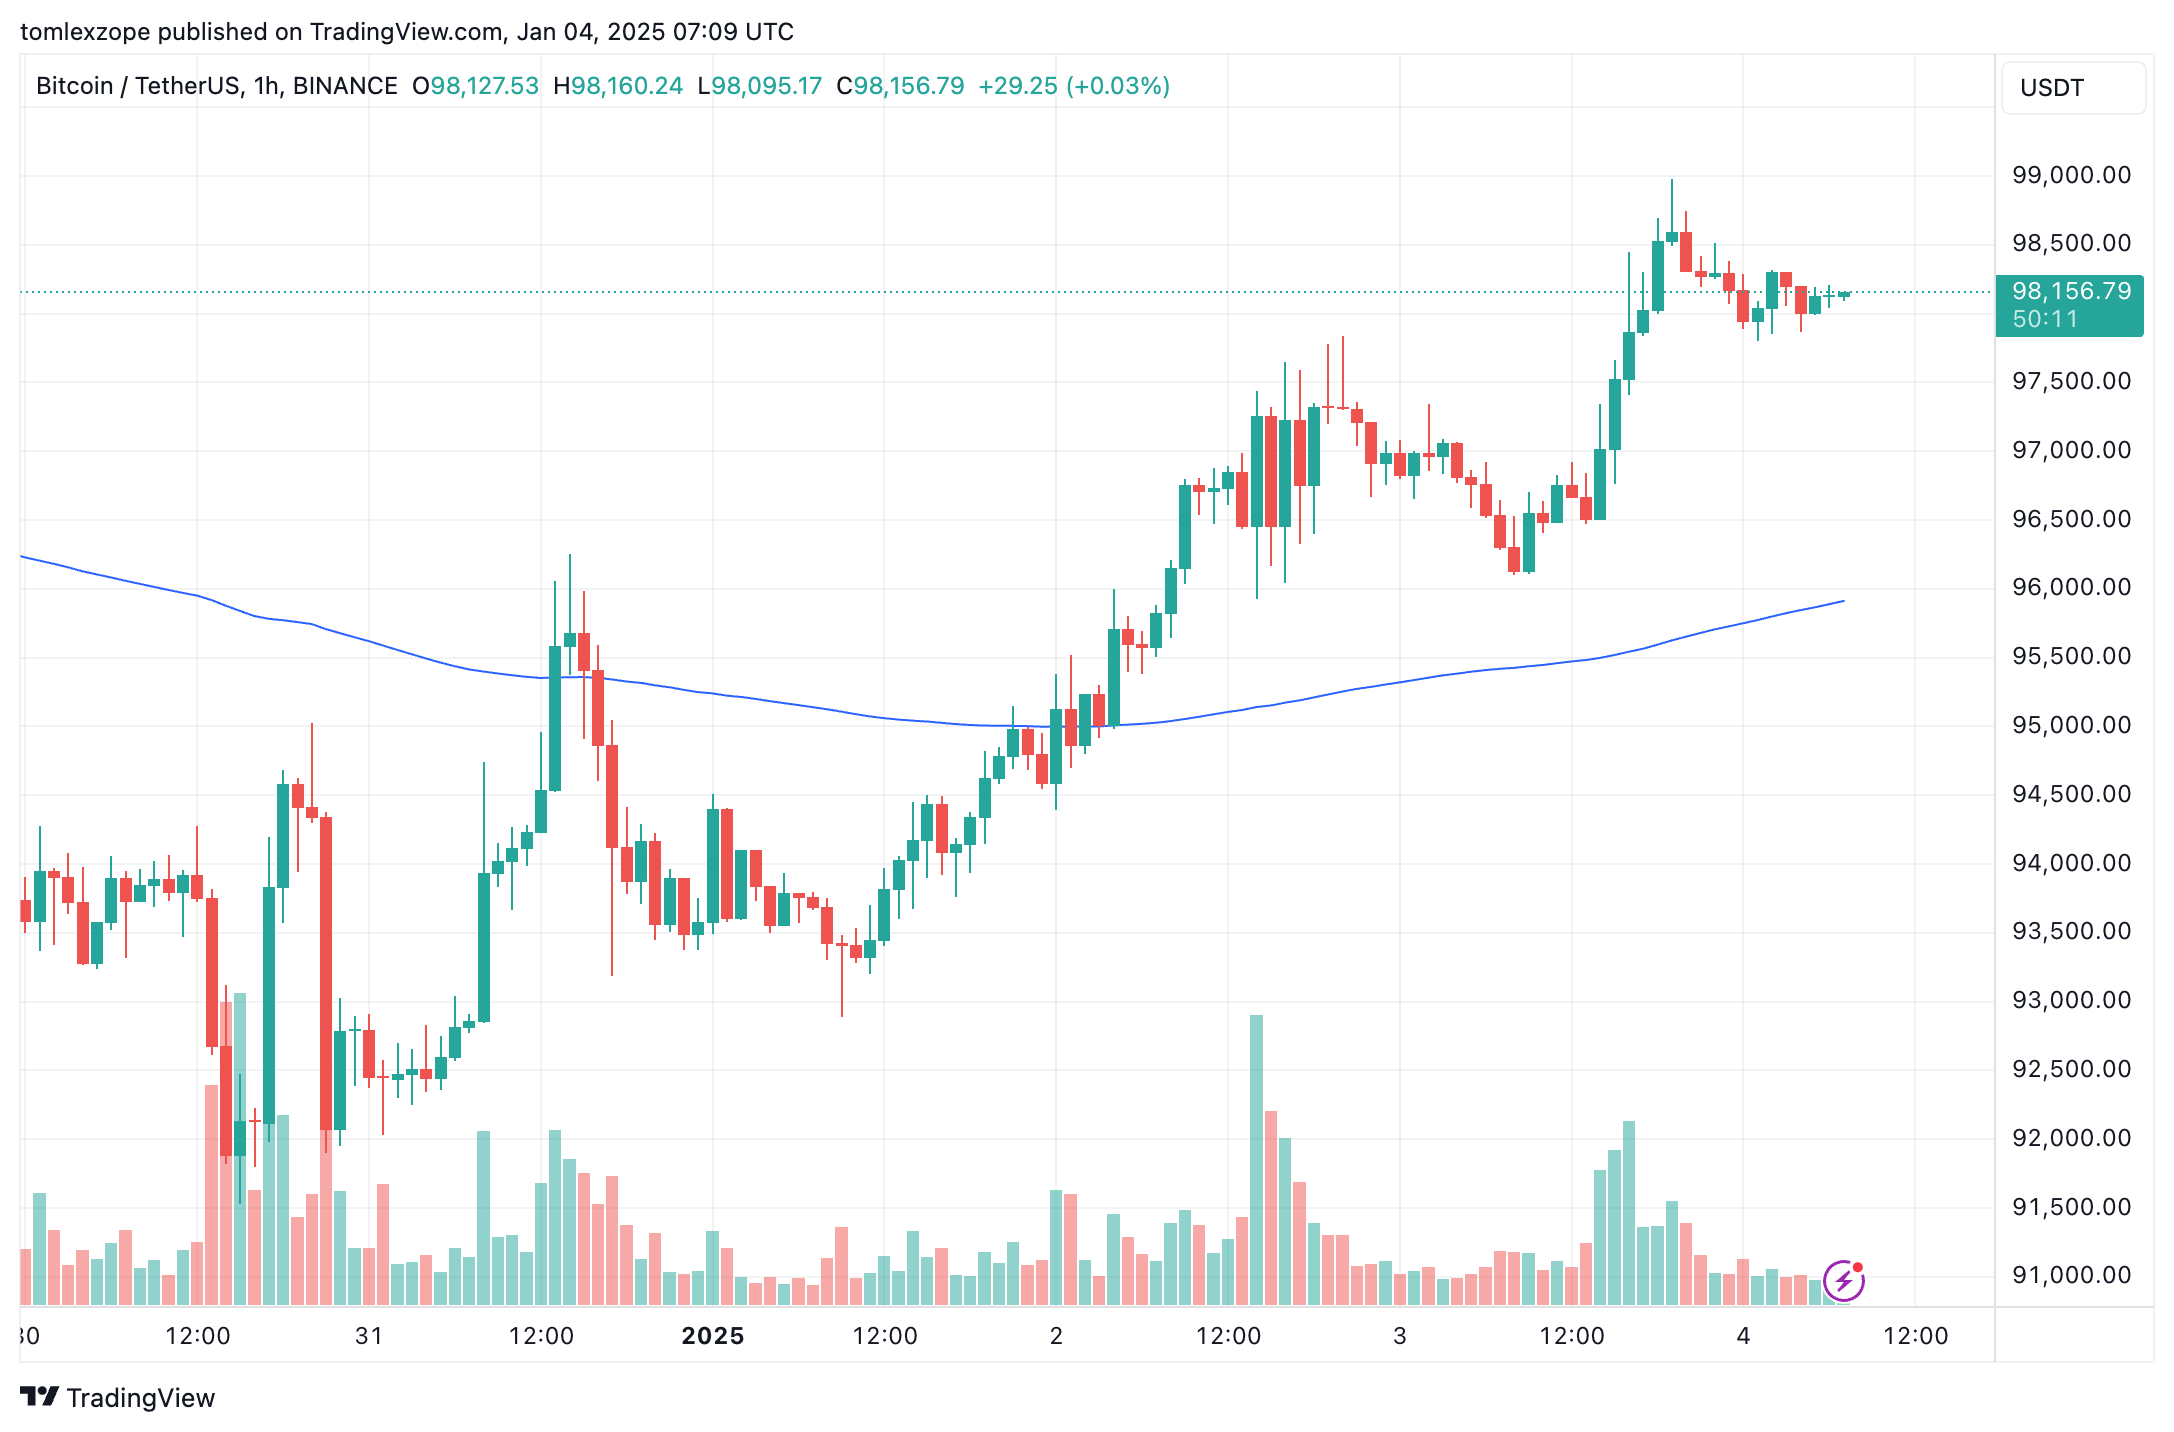
Featured image from iStock, chart from TradingView

 newsbtc.com