- Bitcoin’s market cap stands at $1.85T, with $34.56B in 24-hour trading volume.
- Breaching $92K could lead to further declines, while $98K remains a critical resistance.
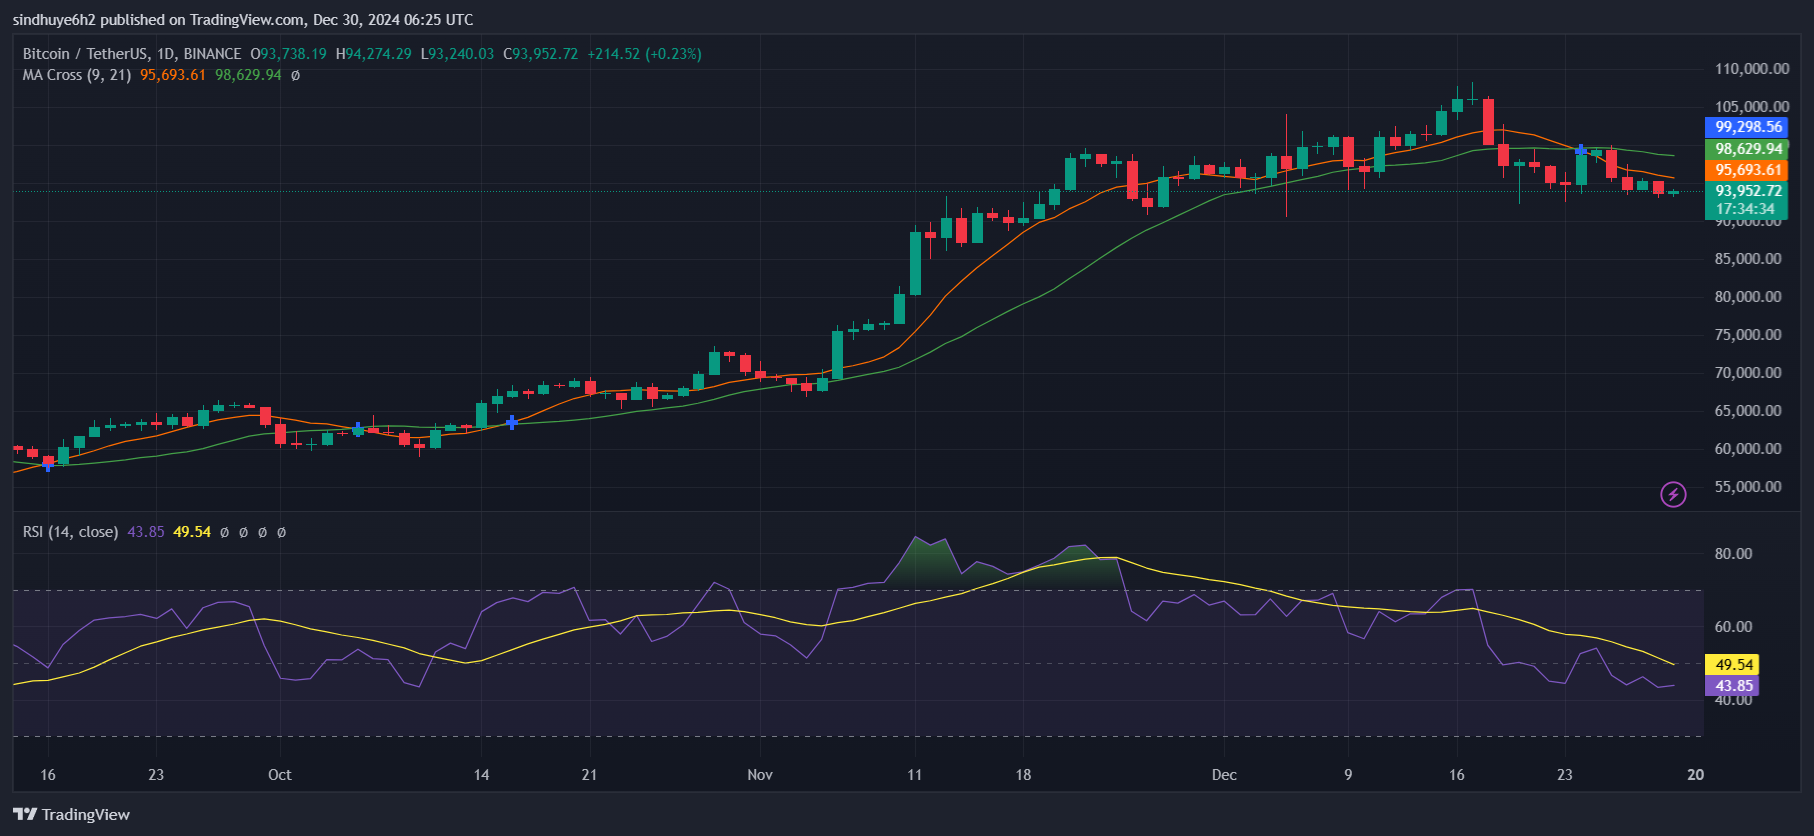
Bitcoin’s price dipped below $94,000, currently trading at $93,834.39. The cryptocurrency faced a sharp decline from its all-time high of $108,364 on December 17 to $92,118, signalling strong selling pressure in recent days. The market remains volatile as traders react to heightened market uncertainty.
The market cap of bitcoin has dropped to $1.85 trillion, down 1.27% in the last 24 hours. The trading volume surged to $34.56 billion, reflecting a 49.45% increase. Its fully diluted valuation (FDV) is $1.96 trillion, with a 1.86% market cap ratio. Bitcoin’s total supply remains at 19.8 million $BTC, approaching the maximum limit of 21 million $BTC.
Technical Indicators Signal Weak Momentum
Bitcoin’s current resistance levels are $98,630 and $99,300. If the price breaks above these levels, it could test the $105,000 mark. However, on the downside, support levels lie at $93,240 and $92,000. A sustained break below $92,000 might push the price downward, possibly toward $90,000 or lower.
The Relative Strength Index (RSI) currently reads 43.85, which indicates neutral-to-weak momentum. The 14-day RSI average is 49.54, reflecting limited buying interest. These levels suggest that Bitcoin is not yet oversold but remains far from a strong bullish trend.

Moving averages provide additional bearish signals. The 9-day moving average stands at $95,693.61, while the 21-day moving average is higher at $98,629.94. The bearish crossover between these averages suggests ongoing downward pressure.
The market cap ratio of 1.86% indicates significant trading activity relative to the overall market cap, hinting at heightened market participation amid the recent price drops. Traders should monitor these indicators closely for any signs of reversal.
Breaching critical resistance levels above $98,000 could reignite bullish momentum. However, failure to hold above $93,000 may result in further losses. Traders should watch RSI levels, moving average crossovers, and trading volumes to gauge the market’s next direction.
 thenewscrypto.com
