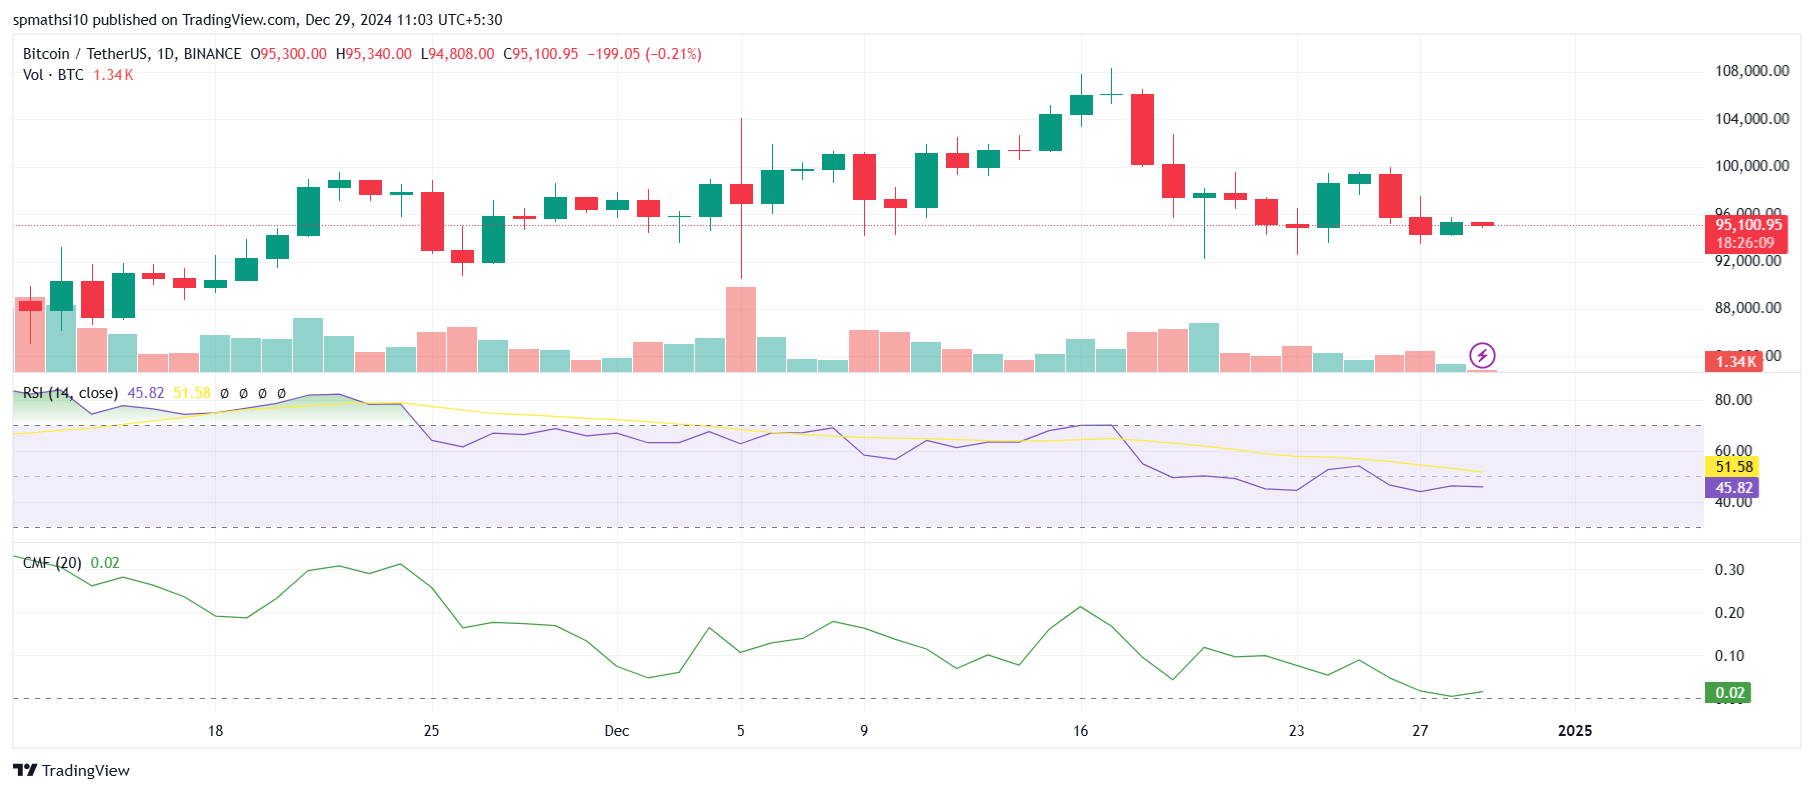
- Bitcoin price is $94,952.42, with a market cap of $1.88T and 0.38% daily growth.
- RSI is at 45.82, signalling mild bearish momentum below its 14-day average of 51.58.
The current price of Bitcoin ($BTC) stands at $94,952.42, reflecting a 0.38% increase over the last 24 hours. Bitcoin’s market cap has surged to $1.88 trillion, accounting for 52.17% of the total crypto market dominance. The 24-hour trading volume of Bitcoin is $23.26 billion, indicating a 1.23% volume-to-market-cap ratio.
The fully diluted valuation (FDV) of Bitcoin is $1.99 trillion, with a circulating supply of 19.8 million $BTC out of a total maximum supply of 21 million $BTC. The global crypto market cap has reached $3.33 trillion, with a 0.90% increase in the past day. However, the overall crypto trading volume has dropped by 34.93%, to $81.23 billion over the last 24 hours.
Technical Indicators for $BTC
Bitcoin’s daily chart shows that the cryptocurrency is currently consolidating at nearly $95,000. The immediate resistance is $96,000, while the support level is $94,000. A break above the resistance could push the price toward the $98,000 mark. Conversely, a breakdown below $94,000 might lead to a decline toward $92,000.
The Relative Strength Index (RSI) is at 45.82, indicating neutral momentum. The RSI’s moving average, at 51.58, suggests mild bearish pressure in the short term. However, the RSI has room to rise if buying interest increases.

The Chaikin Money Flow (CMF), at 0.02, signals slightly positive buying pressure. This shows that Bitcoin is attracting moderate inflows despite the recent decline in trading volume. A stronger CMF reading could further confirm a bullish sentiment.The moving averages provide additional insights.
The 50-day moving average is slightly above the current price, acting as immediate resistance. The 200-day moving average remains below the price, confirming a long-term bullish trend. No significant moving average crossover has occurred, indicating indecision among traders.
Bitcoin’s price remains in a consolidation phase, with critical resistance at $96,000 and support at $94,000. Technical indicators suggest mixed momentum. A breakout above resistance could spark a rally toward $98,000, while a breakdown might trigger a drop to $92,000.
 thenewscrypto.com
