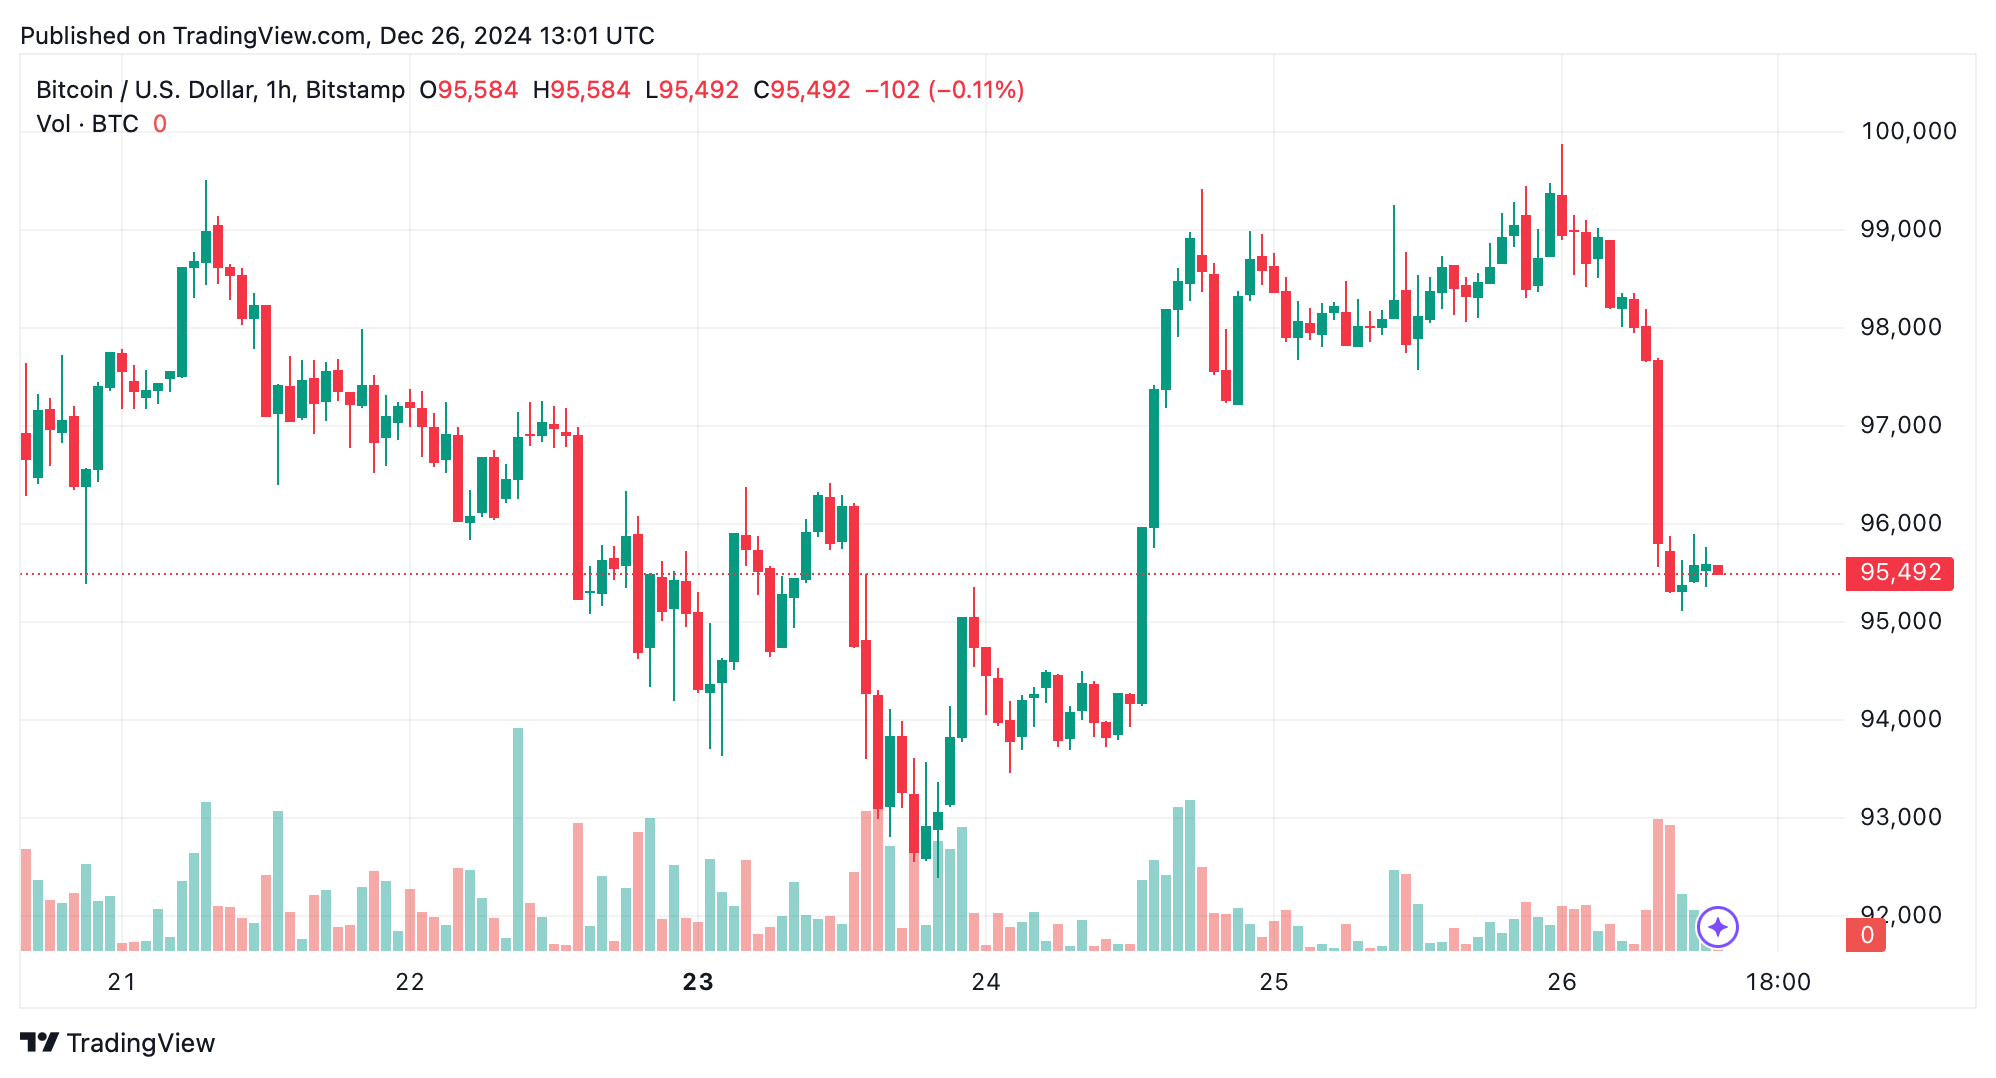
Bitcoin is rocking at $95,492, with a market cap of $1.89 trillion, a 24-hour trade whirl of $42 billion, and prices swinging between $95,134 and $99,886 today.
Bitcoin
Bitcoin‘s 1-hour chart showcases a dramatic drop from $99,881 to $95,111, with hefty selling pressure shown by big red candles. Small-bodied candles with long wicks point to a market that’s unsure at these levels. Support is holding at $95,000, while resistance hovers between $97,000 and $98,000. Oscillators like the relative strength index (RSI) at 46 and the Stochastic oscillator %K at 35 are playing it cool, but the moving average convergence divergence (MACD) is flashing a bearish signal at 586. The moving averages (MA) for 10- and 20-periods are pointing south, adding to the cautious vibes.

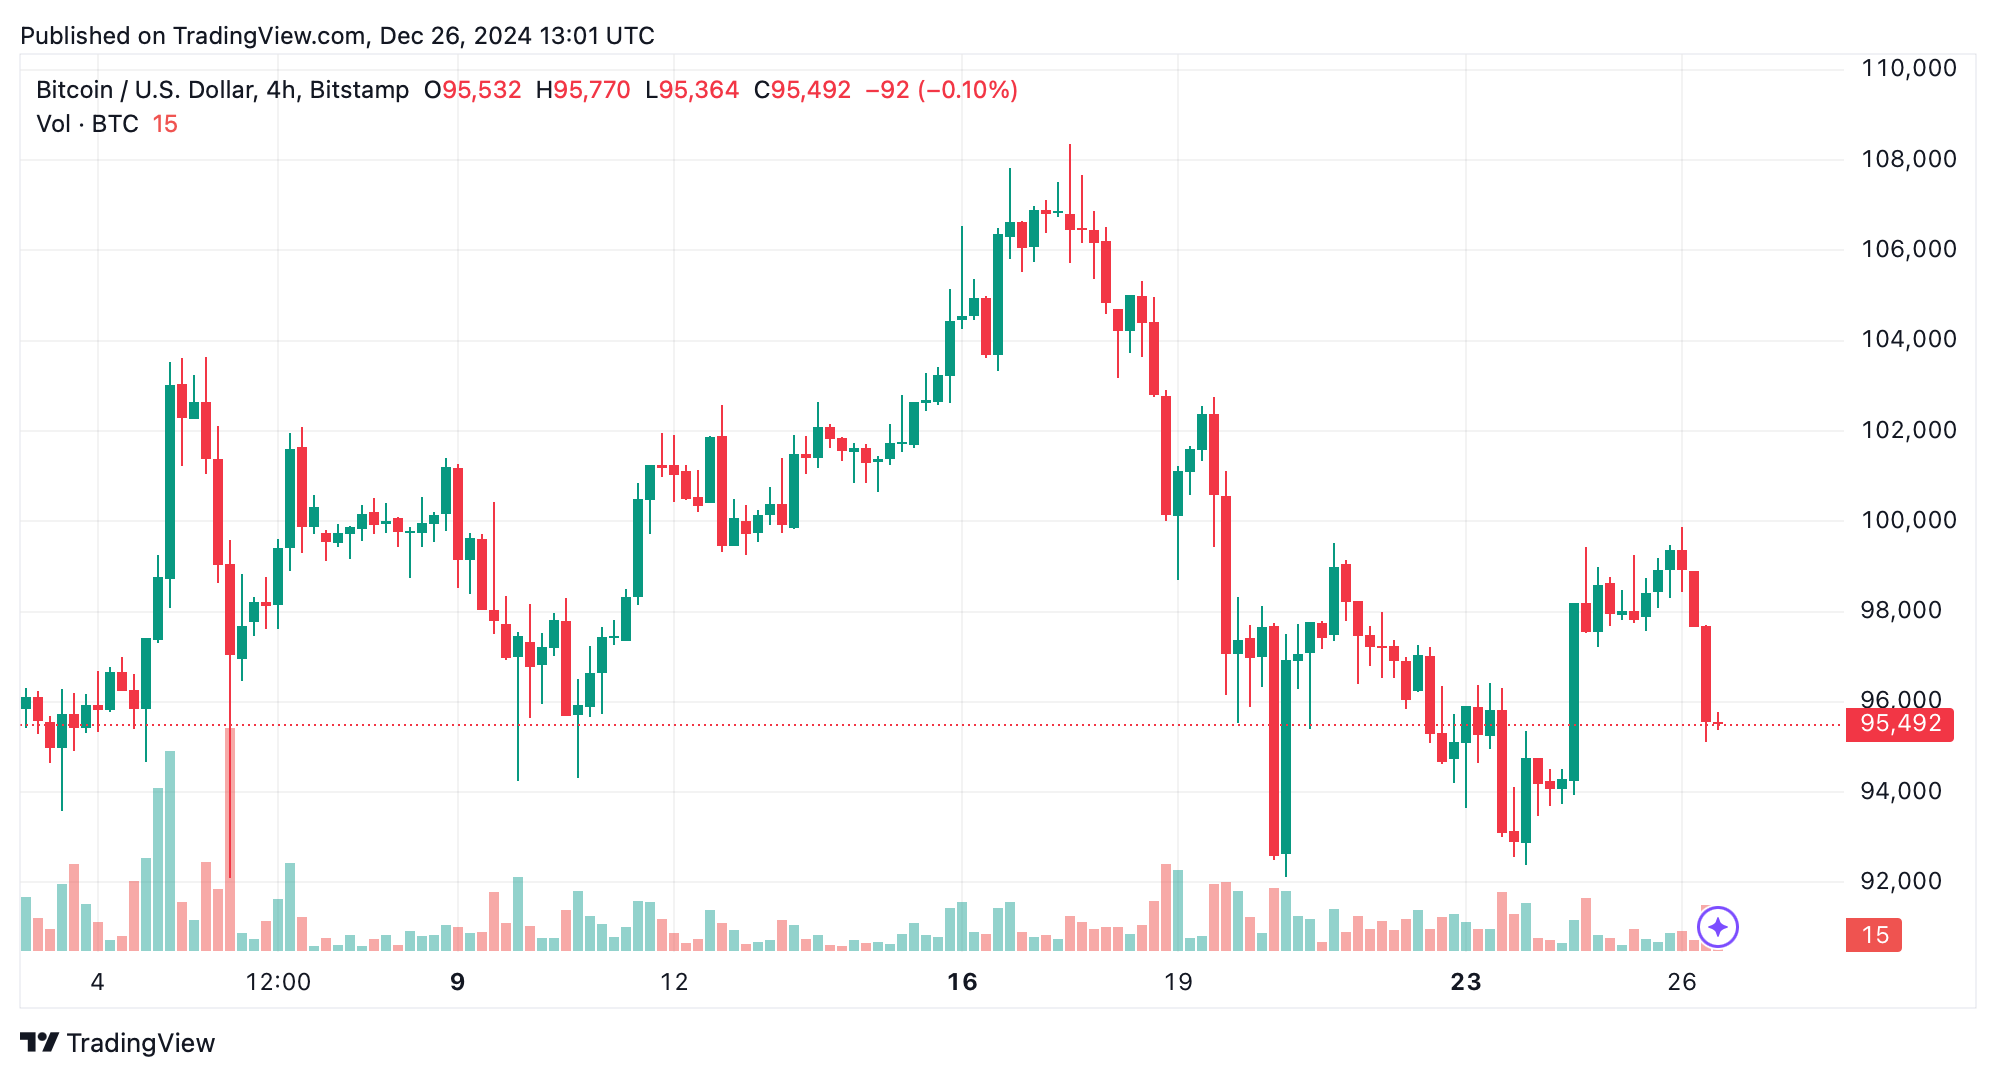
On the 4-hour chart, bitcoin throws a bearish engulfing pattern after hitting $99,881, signaling a short-term downward trend. The sell-off’s high volume underlines the negative mood. Support is critical at $95,000, with a potential drop to $93,000 if that range gives way. To spark some bullish action, prices need to break through the $98,000 to $99,000 resistance again. Indicators like the awesome oscillator and momentum, at -1,706 and -10,654 respectively, hint at more potential downside.

The daily chart sketches a bearish big picture, with bitcoin pulling back from the all-time peak high of $108,364 earlier this month. A hefty drop at $99,881 confirms the turnaround. Support zones are vital at $95,000 and $92,000, with $100,000 acting as both a mental and technical hurdle. The exponential moving averages (EMA) for 50- and 100-periods are optimistic at $93,101 and $84,592, but the shorter ones are still bearish.

Oscillator readings, with the commodity channel index (CCI) at -70 and the average directional index (ADX) at 27, maintain the neutral to bearish outlook. Traders should watch for a push above $97,000 or a solid bounce from $95,000 for short-term plays, while long positions need extra proof across longer time frames.
The shorter-term moving averages, including the 10- and 20-period simple moving average (SMA) and exponential moving average (EMA), continue to point to selling pressure, with their values consistently above bitcoin’s current price. However, longer-term moving averages like the 100- and 200-period EMA and SMA remain firmly bullish, suggesting that the broader trend may still favor accumulation if key support levels hold.
Bull Verdict:
Bitcoin must reclaim the $97,000 to $98,000 resistance zone and show sustained upward momentum on higher timeframes to shift the sentiment bullish. A confirmed breakout above $100,000 could reestablish a strong uptrend, particularly if supported by increasing volume and oscillator improvement. The long-term exponential moving averages (EMA) remain bullish, suggesting the broader trend could still favor buyers if critical support holds.
Bear Verdict:
The bearish outlook dominates in the short to medium term, with $95,000 as the key level to watch. A break below this support could accelerate selling toward $93,000 and potentially $92,000, exacerbated by sell signals across momentum indicators and shorter-term moving averages. Current technical signals imply caution for buyers, with further downside likely unless significant bullish momentum reemerges.
 news.bitcoin.com