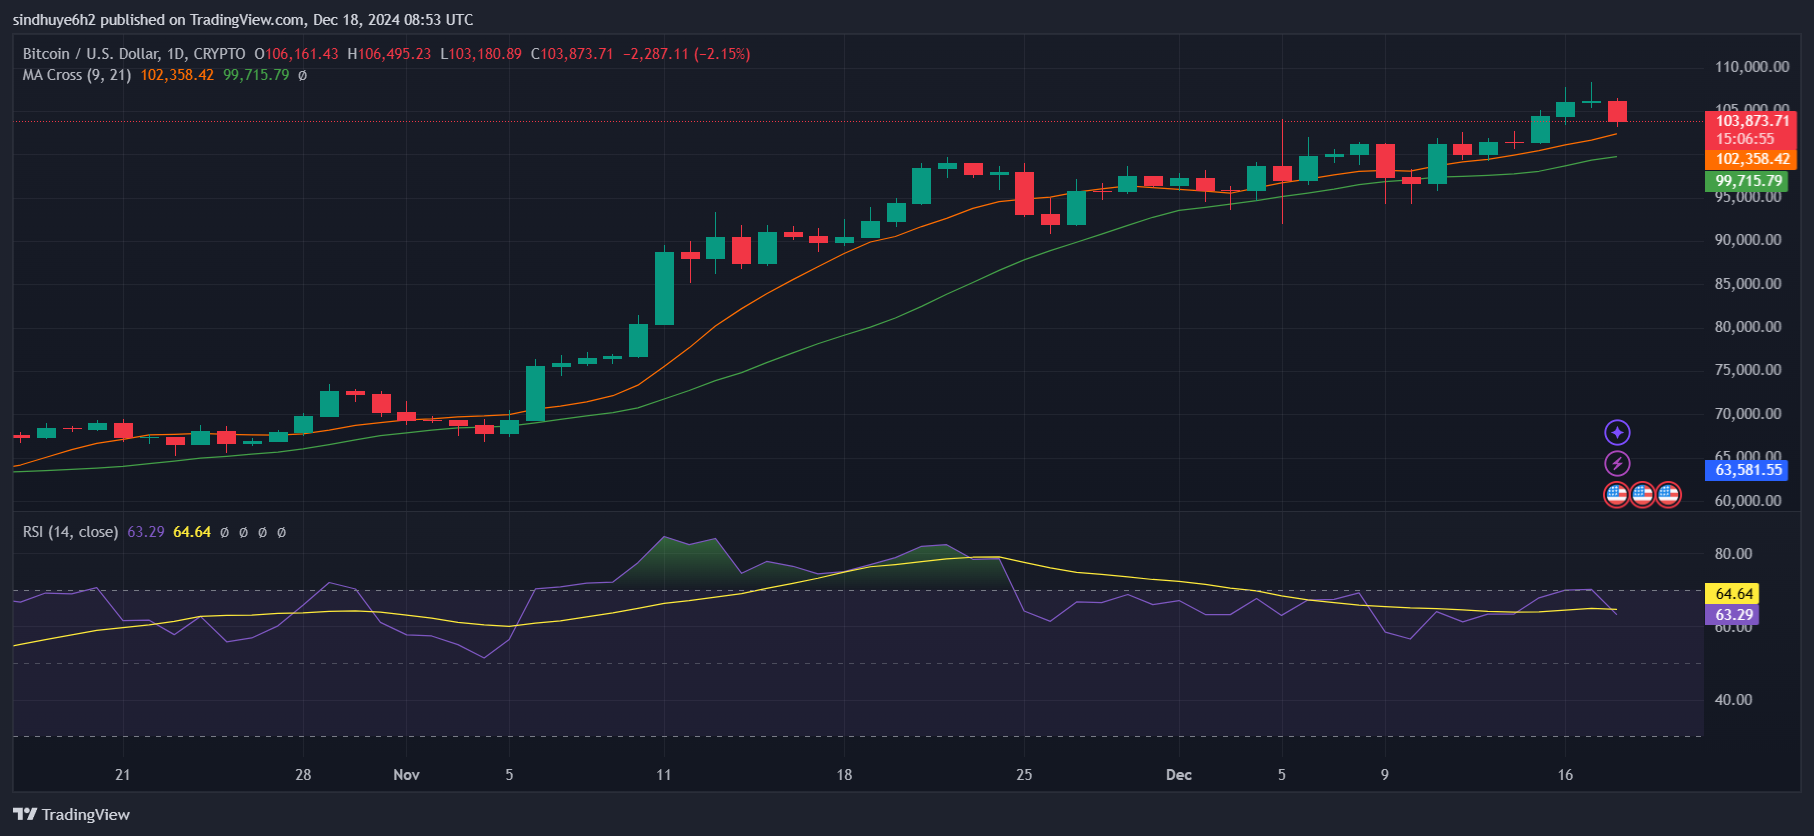
- Bitcoin fell 3.4% to $103,805 after hitting an all-time high of $108,268.
- A breakdown below $102K could push BTC toward $99,700 or lower.
The global crypto market cap dropped 3.18% to $3.63 trillion, highlighting a broad market downturn. However, the total crypto market volume surged 0.81% to $206.04 billion, indicating sustained trading activity.
Bitcoin (BTC) dropped 3.4% in the past 24 hours, trading at $103,805.29 after hitting an all-time high of $108,268.45. The decline reflects bearish sentiment, with short-term weakness emerging after the price rally. Historical trends from 2017 and 2020 indicate corrections after major milestones like $110,000, $125,000, and $150,000 before a potential bull market peak at $220,000.
BTC’s market cap dropped 3.33% to $2.05 trillion, while trading volume increased 3.37% to $77.82 billion, reflecting active market participation. The volume-to-market cap ratio stands at 3.8%. Bitcoin’s circulating supply remains at 19.79M BTC out of the 21M max supply.
Is Bitcoin at a Turning Point?
Bitcoin faces critical support at $102,358 and stronger support near $99,715. A break below $102,000 could trigger further declines, potentially retesting the $99,700 level. Resistance is currently seen at $110,000. Breaking above this level would renew bullish momentum, targeting $125,000 next.
The Relative Strength Index (RSI) currently sits at 63.29, down from its average of 64.64, indicating a cooling of buying pressure. The RSI is still in neutral territory but moving closer to bearish conditions.

The 9-day moving average (MA) at $102,358.42 remains above the 21-day MA at $99,715.79, confirming a broader bullish trend despite the short-term weakness. However, the declining price near the 9-day MA suggests a potential for further downside if the trend continues.
The current 9-day and 21-day MA crossover reflects Bitcoin’s longer-term uptrend. As long as the 9-day MA stays above the 21-day MA, the bullish trend remains intact. A crossover reversal, however, would indicate further bearish pressure.
If BTC holds support above $102,000, a rebound toward $110,000 is possible. A breakdown below this level could see BTC sliding to $99,700 or lower. Traders should closely monitor support and resistance levels as bearish sentiment dominates the short-term outlook.
 thenewscrypto.com