With a triangle breakout rally on the 4-hour chart, will Bitcoin (BTC) surpass the $103,000 milestone?
Bitcoin has reclaimed the $100,000 price level, reaching a 24-hour high of $101,961, sending a wave of positive sentiment across the market. The 24-hour recovery stands at 2.85% as the market cap approaches the $2 trillion mark.
Despite the BTC price being above the $100K level, a short-term retest raises concerns about a potential bearish slip. Will this slip lead to an extended crash, or is a post-retest reversal set to push Bitcoin to a new all-time high?
Bitcoin Price Analysis
After a quick reversal from a long-standing support trendline, Bitcoin reclaimed the $100,000 milestone. The BTC price action suggests a triangle breakout rally, having surpassed the local resistance trendline.
Currently, BTC has shown a minor pullback to retest the broken resistance trendline, retracing 0.48% over the past four hours.
The simple moving average lines remain in a positive alignment on the 4-hour chart, supporting the bullish trend. Additionally, the MACD and signal lines have crossed into positive territory, with bullish histograms showing a surge. As a result, technical indicators continue to signal a buy for BTC.
Bitcoin ETFs See Inflow Record of $223M
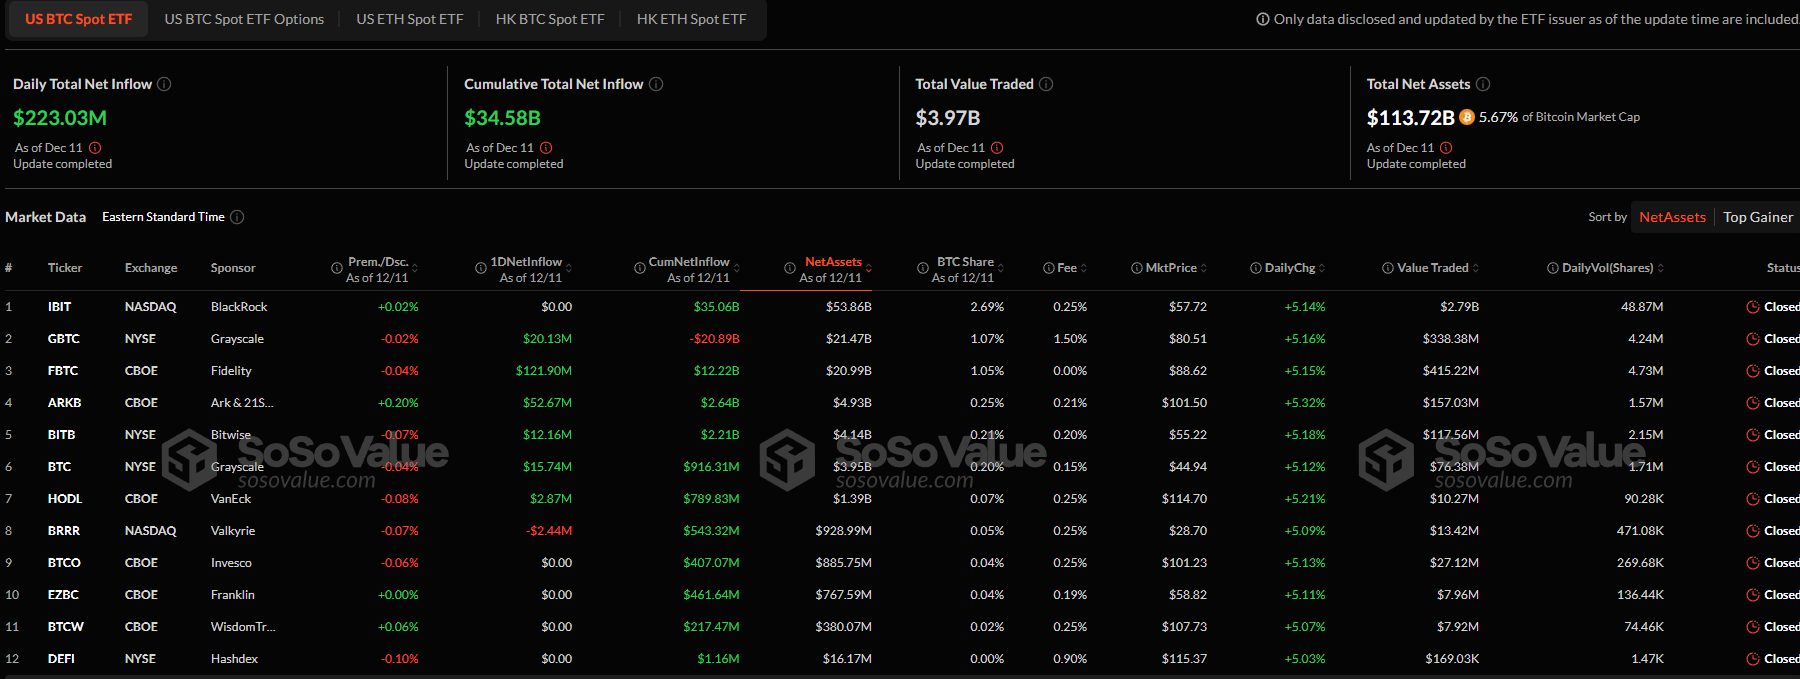
Amid the sudden surge in BTC’s price, institutional demand remains strong, with growing inflows into the U.S. Bitcoin spot ETFs. On December 11, the total daily net inflow into U.S. Bitcoin ETFs reached $223.03 million.

Leading the bullish charge, Fidelity (FBTC) recorded an inflow of $121.90 million, followed by ARK N21 shares ARKB with $52.67 million. Surprisingly, BlackRock’s buying spree has paused, with a net zero inflow.
The total net assets of U.S. spot Bitcoin ETFs have now reached $113.72 billion, accounting for 5.67% of Bitcoin’s market cap.
Bitcoin Price Targets
Currently, BTC is trading at $100,614, with a projected retest of the broken trendline. Based on Fibonacci levels, the breakout rally failed to reach the 38.20% Fibonacci level at $103,102.
Nonetheless, the potential post-retest reversal is likely to challenge the Fibonacci resistance. In the event of a bullish breakout, the immediate price target is $106,921 at the 50% level.
On the other hand, if BTC closes below the broken trendline, it will test the simple moving average line at $98,974.
 thecryptobasic.com