Bitcoin whales accumulated $1.5 billion worth of BTC, pushing reserves above 3.875M Bitcoin price. Meanwhile, BTC exchange flows to Binance hit historic lows, reflecting increased market stability. Altcoin-BTC correlations also diverge, signaling key trend shifts.
Bitcoin is currently trading at $96,394, reflecting a 1.1% rise over the past 24 hours. Key support levels to monitor are near $92,000, with resistance looming at the psychological $100,000 mark.
The cryptocurrency market has shown slight gains following the recent drop, with Bitcoin’s dominance steady at 57% of the market
Bitcoin Whale Holdings Surge Above 3.875M BTC Amid Accumulation
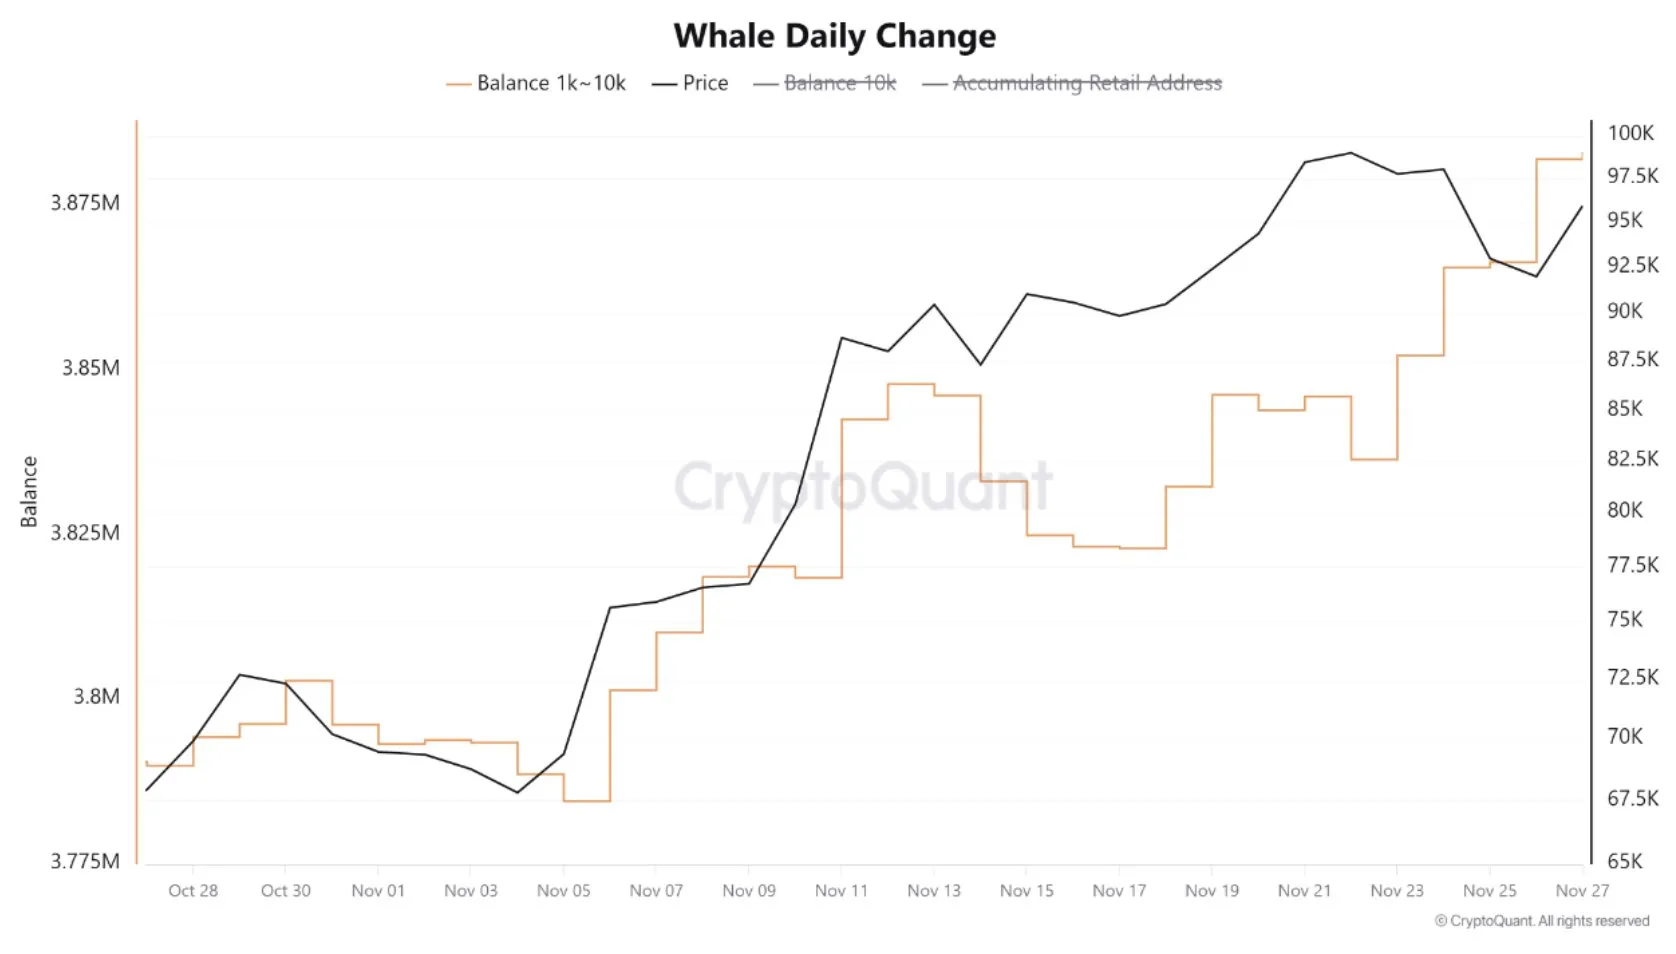
Data from CryptoQuant shows that Bitcoin whales have accumulated nearly 16,000 BTC on Tuesday, equating to approximately $1.5 billion in on-chain value.
This accumulation pushed whale reserves above 3.875 million BTC, marking a steady upward trend in large-scale Bitcoin holdings throughout November. The continued increase signals strong confidence among whales in Bitcoin’s long-term value.
There is a clear correlation between whale accumulation and Bitcoin’s price movement. As whales added to their reserves, Bitcoin’s price gradually climbed closer to the $97,000 level.
This strategic accumulation suggests whales are capitalizing on market conditions to build their positions, potentially preparing for further price increases.

This surge in whale activity underscores their influence on Bitcoin’s supply dynamics. Their growing reserves tighten circulating supply, potentially driving bullish momentum.
The steady accumulation reflects optimism about Bitcoin’s future performance, with whales taking advantage of current price levels to secure significant holdings.
Negative Correlation Signals Bitcoin price Short-term Trend Shifts
The analysis employs data from a Correlation Heatmap prepared by Alphractal, which displays the results of Bitcoin and other altcoins’ performance across different timeframes.
The heatmap, using pricing data on a 1-hour and 5-minute timeframe, shows the lowest correlation levels since January 2024. Within this visualization, we see areas of divergence that altcoins increase with Bitcoin circulating around the $100k mark.
Alphractal’s data on the shorter 5-minute timeframe also shows that shifts in Bitcoin’s short-term trends often follow negative correlations, providing traders with an important identification point.

Heatmap shows how correlated we are based on the intensity; the colder colors indicate weaker correlations and the warmer ones are stronger alignments.
This dataset shows that altcoins don’t tend to hold their independence long from the trends of Bitcoin. These insights will be of paramount importance to traders and investors who want to take advantage of shifts in a dominant trend as Bitcoin enters the $100k range.
Reduced Exchange Flows Reflect Bitcoin price Adoption and Market Stability
Data from CryptoQuant shows Bitcoin flows from all exchanges to Binance have plummeted to their lowest levels over the past decade.
What’s interesting about this trend is increasing trader faith in Binance’s stability, perhaps with its strong liquidity and the increasing adoption of stablecoins.
Outflows are less crowded, and the environment is more stable. The chart also marked a correlation between significant exchange flows and volatility in previous years.

High periods of BTC flow to the exchange vs. total trading volume correlated with sharp price decline, likely due to panic selling or speculative activity.
Further, the low exchange flows indicate less market anxiety and stronger holding behavior by traders. This puts liquidity up for grabs in the meantime instead of being moved towards selling.
CryptoQuant’s analysis highlights the stabilization effect from stablecoins and fundamental faith in Binance’s liquidity framework to curb exchange-related activity from tipping BTC prices with sudden spikes.
 thecoinrepublic.com
