Experts highlight key indicators suggesting Bitcoin still has significant room to grow before reaching its market cycle top.
Bitcoin has seen a significant price rebound after a brief dip below $91,000 on November 26. Following this drop, bullish momentum reignited, propelling Bitcoin to a high of $97,300 within the past day.
As of today, the crypto is trading at $96,268.02, reflecting a 0.81% increase in the last 24 hours but a -2.57% decline over the past seven days. Analysts suggest the crypto may still have room for further growth, with investor sentiment and market trends supporting a potential rally continuation.
Insights from Public Search Interest on Bitcoin
Recent Google Trends data, which reflects retail investor interest, shows that search interest for Bitcoin has spiked this month. However, the overall levels remain below the euphoric highs of 2021.
According to analyst Ali Martinez, the present statistics point to subdued retail participation and highlight the potential for Bitcoin to grow further before reaching a new market top.
Investor sentiment remains subdued, far from euphoric—indicating #Bitcoin $BTC may still have significant room to grow before reaching a market top. pic.twitter.com/BP7ocpSvuZ
— Ali (@ali_charts) November 29, 2024
Market sentiment also supports this view. An analyst using the Pi Cycle Top Indicator notes that Bitcoin’s market cycle peaks have historically been marked by the 111-day moving average (MA111) crossing above twice the 350-day moving average (MA350×2).
Currently, the gap between these two moving averages is narrowing, signaling the possibility of an impending parabolic rally.
This pattern mirrors trends observed in 2020, which preceded Bitcoin’s bull market peak in 2021, lending weight to the argument for further upward momentum. The analyst also stated on X that this approach has consistently proven accurate.
Technical Indicators Highlight Bullish Momentum
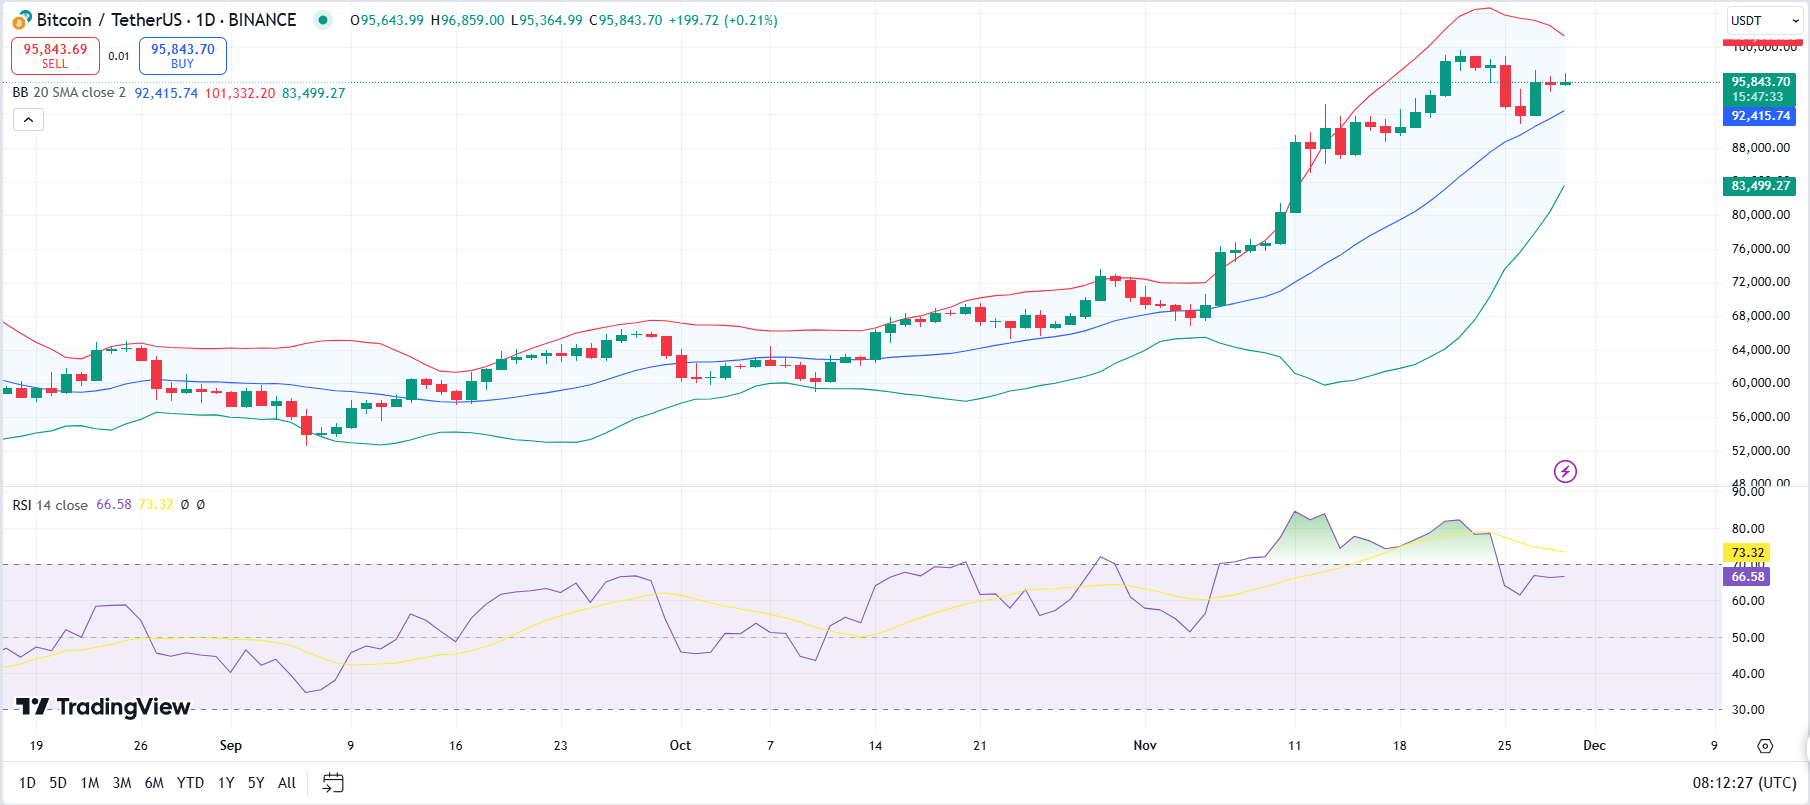
Technical indicators further bolster the bullish outlook. Bitcoin recently broke above the upper Bollinger Band in mid-November, signaling strong upward momentum. Following this rally, Bitcoin has consolidated near the middle band and is now moving toward the upper band again, suggesting the trend is likely to continue rather than reverse.

The Relative Strength Index (RSI), currently at 67.22, also supports this analysis. Since it remains below the overbought threshold of 70, it indicates that Bitcoin is still in a strong bullish trend but has not yet reached extreme overbought conditions, leaving room for further price increases.
On-Chain Data Supports Positive Sentiment
On-chain data also paints a promising picture for Bitcoin. More than 80% of Bitcoin addresses purchased their holdings at a price lower than the current market value, indicating that most holders are still in profit.

Resistance levels, notably in the $96,225 to $98,490 range, are not heavily concentrated, leaving ample space for further price growth. With minimal activity around the current price and a clear upward trajectory, market conditions appear favorable for continued bullish momentum.
 thecryptobasic.com
