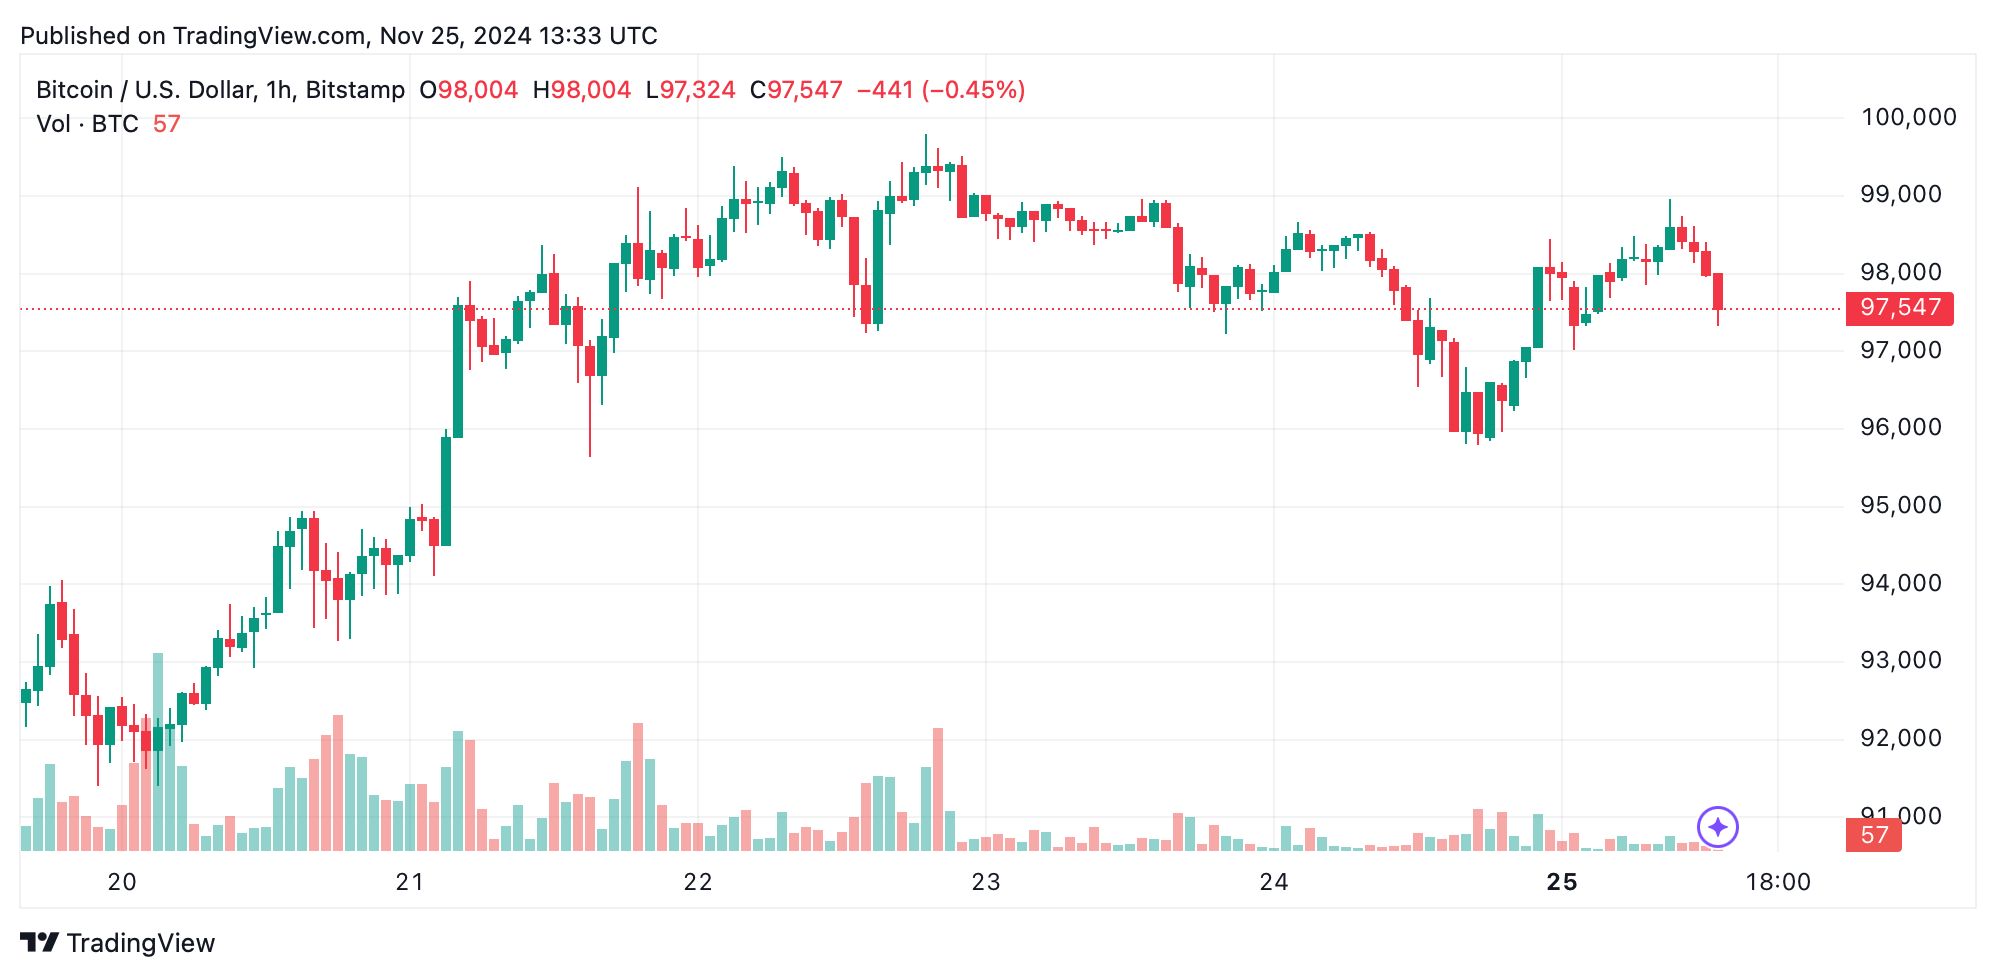
As of Nov. 25, 2024, the price of bitcoin (BTC) has traded between $97,076 and $97,547 within the past hour, displaying a strong bullish trajectory across multiple timeframes. Technical indicators suggest a mixture of neutral momentum and buy signals, highlighting the potential for further growth while signaling areas of caution.
Bitcoin
Bitcoin‘s 1-hour chart reflects a recovery from a local low near $95,796, followed by a steady climb. However, momentum appears to be waning as the price approaches $98,966, a key resistance level. Trading volume, which spiked during sharp moves, has diminished near the highs, hinting at either resistance or cautious sentiment. This timeframe suggests a possible entry near $97,000 if the price pulls back with supportive volume, while exits could be considered near $98,900 to capitalize on potential rejections.

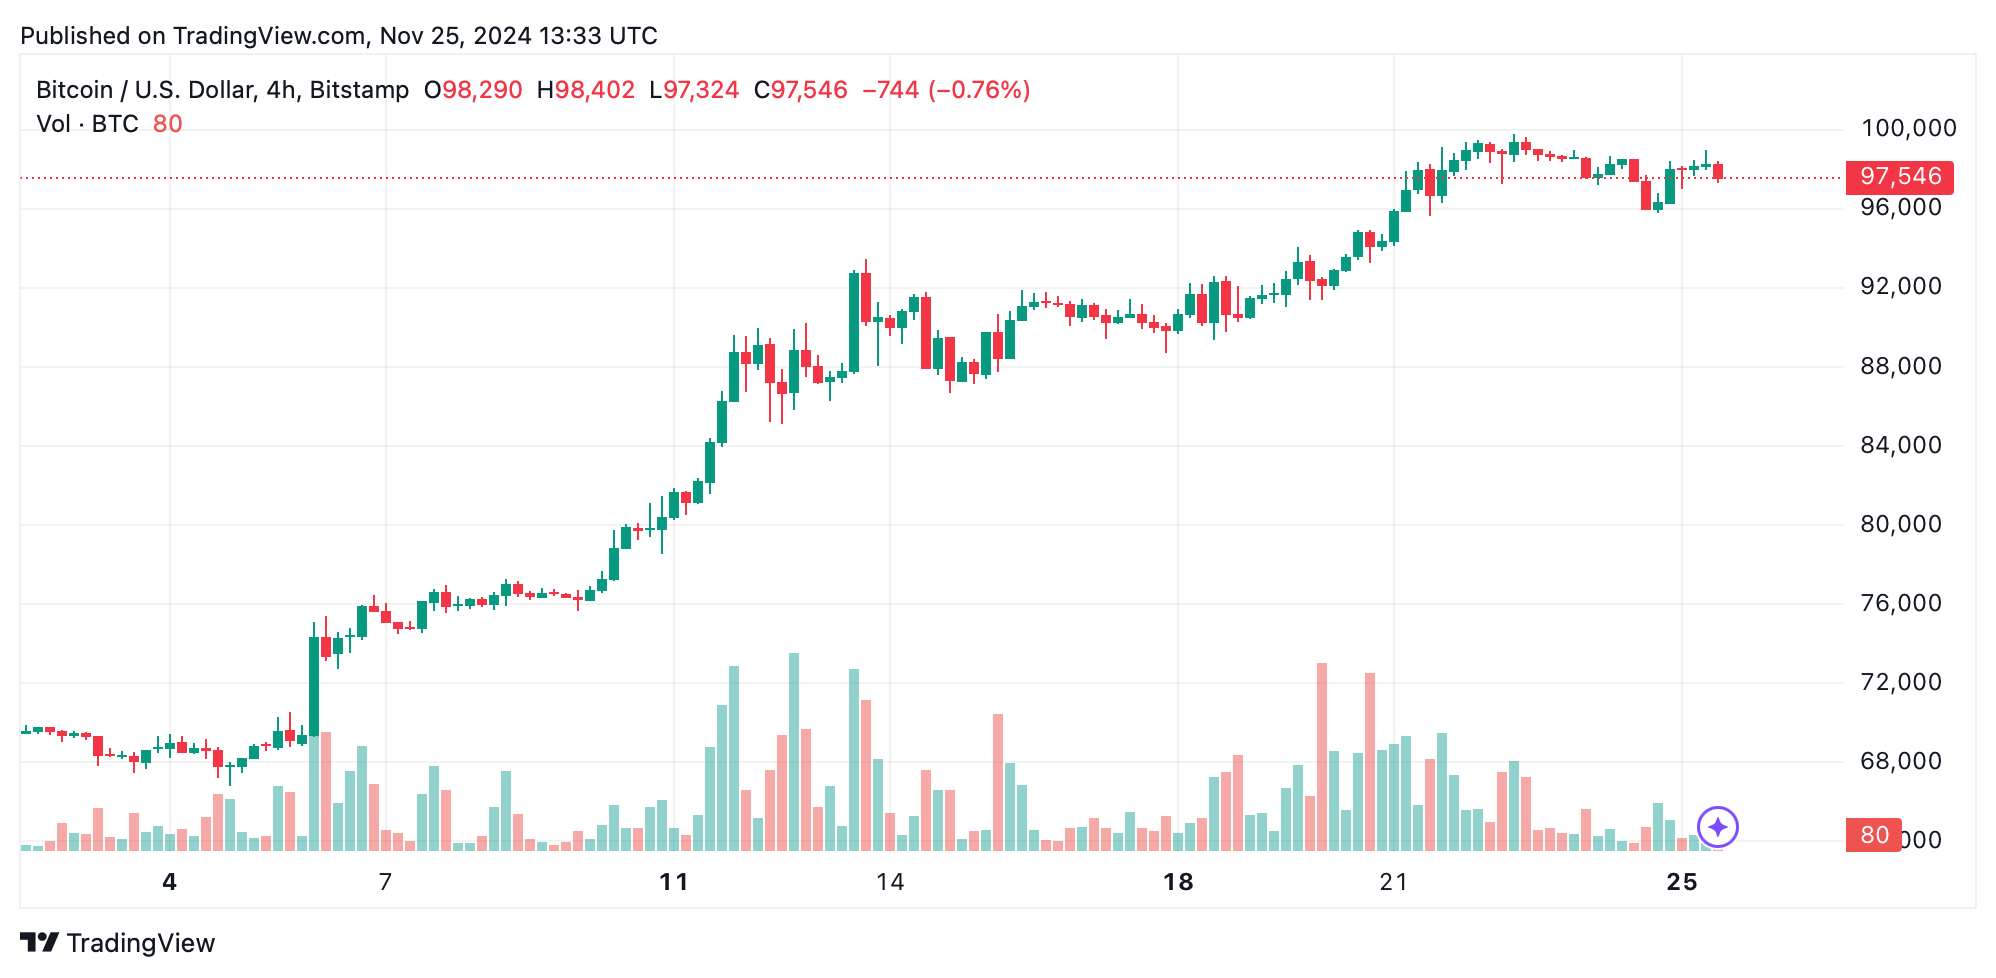
On the 4-hour chart, bitcoin has rallied significantly from the Nov. 22 low of $91,400, but resistance looms near $99,800. Volume analysis shows robust activity during the initial upward push, followed by a tapering as the price advances. Traders eyeing this timeframe might look for an entry on a breakout above $99,000 with increasing volume, targeting exits close to the psychological $100,000 mark if signs of reversal emerge.

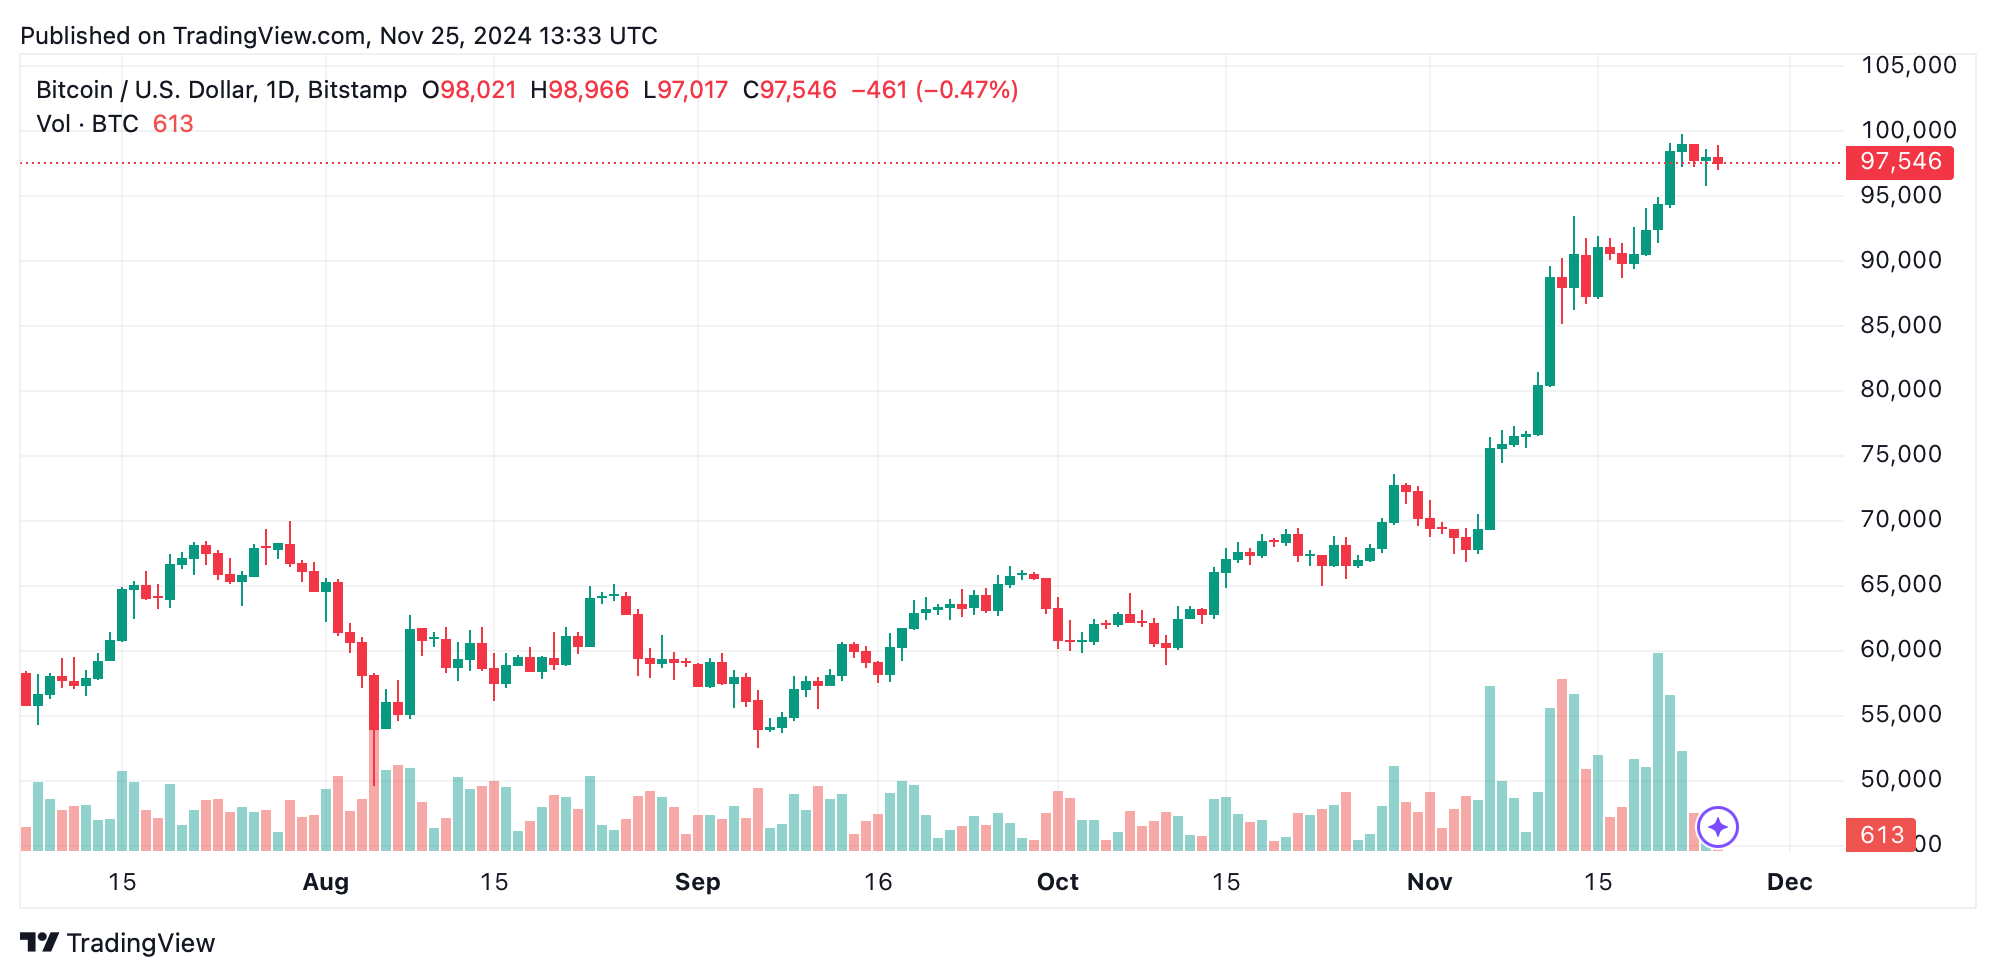
The daily chart paints a broader bullish picture, with bitcoin ascending from $65,000 to its current levels. Despite this strength, momentum is cooling as the price nears the critical $100,000 psychological resistance. Moderate but declining volume reinforces the need for caution at these levels. Breakouts above $100,000 or retests of $95,000 support offer promising entry points for long-term investors. Profit-taking near $100,000 may be prudent, barring further confirmation of upside potential.

Key oscillators such as the relative strength index (RSI), Stochastic, and commodity channel index (CCI) display neutral readings, suggesting a lack of overbought or oversold conditions. Meanwhile, the momentum oscillator indicates a sell signal, counterbalanced by the moving average convergence divergence (MACD) level, which signals a buy. Moving averages across all significant timeframes—exponential moving averages (EMA) and simple moving averages (SMA)—favor bullish action, reinforcing the long-term positive outlook.
Bull Verdict:
Bitcoin’s price movement remains firmly bullish, supported by consistent buy signals from key moving averages and a strong uptrend on the daily chart. A potential breakout above the psychological $100,000 level could signal further upside momentum, making this a favorable environment for long-term and momentum-focused traders. Cautious optimism is advised, with a watchful eye on volume and resistance levels.
Bear Verdict:
Despite the bullish trajectory, declining momentum indicators, neutral oscillator readings, and reduced volume near resistance zones signal potential vulnerabilities. If bitcoin fails to breach the $100,000 mark or falls below the $95,000 support, bearish pressure could increase, prompting a more cautious stance for traders in the short to mid-term.
 news.bitcoin.com
