Bitcoin whales are using the current Bitcoin price surge to lock in profits. One of them deposited $14.5 million of WBTC based on the confidentiality of Bitcoin’s recent all-time high (ATH) to get huge gains.
That whale in question seems to be planning to sell 195.4 WBTC, which is about 14.5 million dollars on Binance, within the last couple of hours. A decision that would cement a profit of $4.48 million. This is a solid 22.6% rise from what they paid in early August when they first invested.
Most of this came out of its balance from Binance during the accumulation phase, which saw the whale withdraw 330.4 WBTC at an average price of $60,021, buying most at the time at local lows.
Whale Continues to Hold ETH with Unrealized Gains
This whale is done with their WBTC position, but still holds a lot of Ethereum. According to WhaleStats, the whale has 4,864 ETH worth around $12.5 million in the whale’s Ethereum portfolio.
This is a gain of $1.17 million, up 10.4%. This retention of ETH also means the whale is not simply relying on Bitcoin’s performance. The receipt of so much ETH further backs both the whale’s potential confidence in the ETH price trajectory as well as Ethereum’s potential to continue rising as part of the crypto market’s already strong trend.
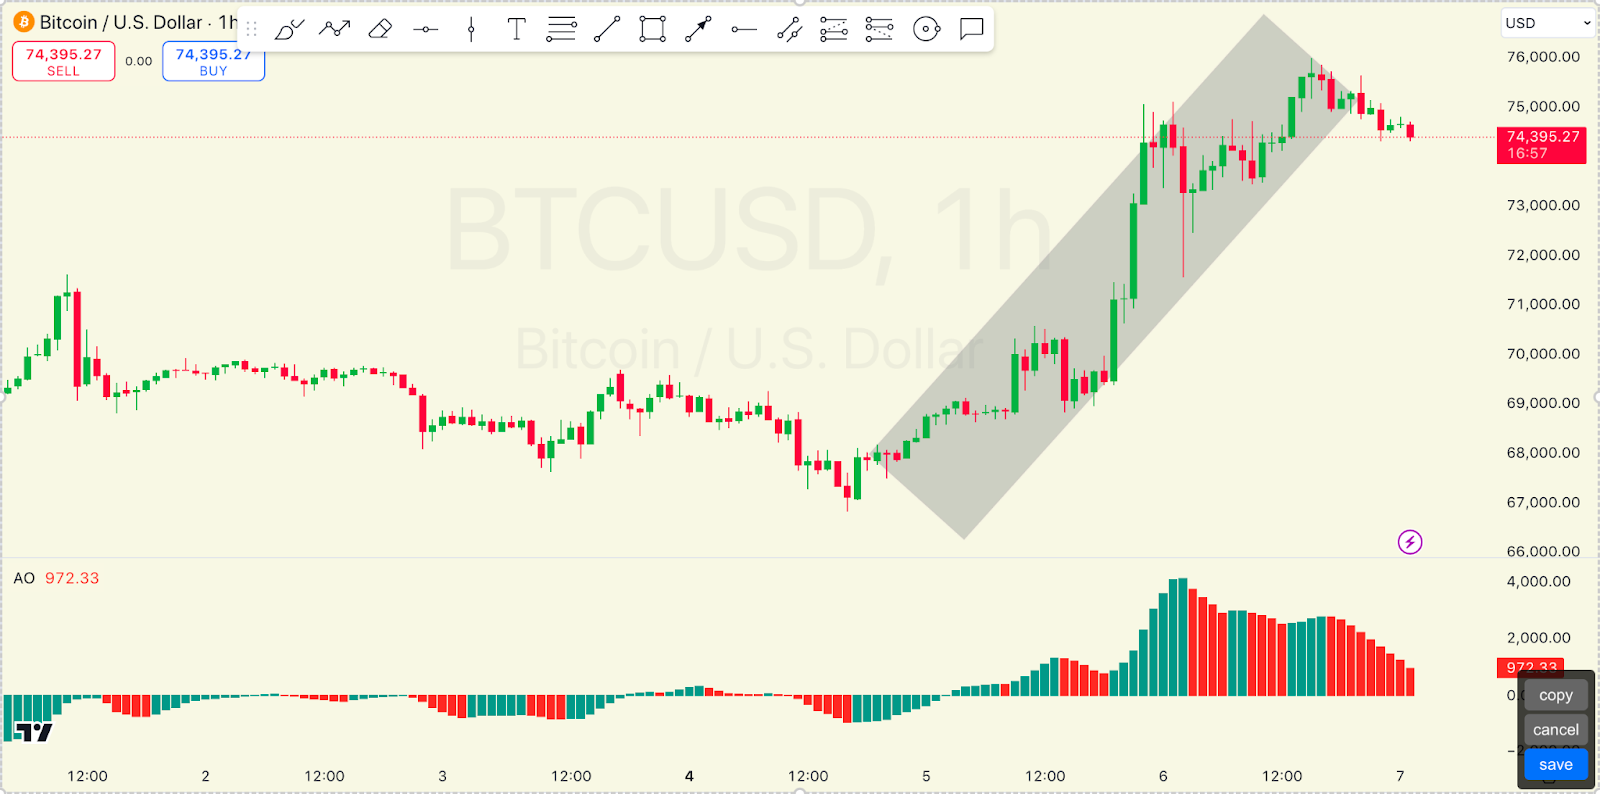
According to CoinMarketCap, Bitcoin’s price is up by approximately 0.39% day over day at $74,888, which is just about average for Ethereum. As we can see from the chart, there is a dip below $74,500, then a rebound above $75,000, and back down to this level.
Activity looks to have slightly diminished, noted the trading volume of 4.6%. The $74,500 looks like a support level and $75,000 is a resistance level. Bitcoin’s market cap reveals steady interest in the cryptocurrency, with its value standing steady at around $1.48 trillion with recent price fluctuations.
Bitcoin Technical Analysis: Corrections up Ahead?
Technical charts show a consistent uptrend in Bitcoin’s recent price action in the last few days. In the attached price chart, Bitcoin has already broken through multiple resistance levels and set new highs.
It has been trading with green candles and looks like a lift from selling pressure. However, the crypto king has now broken out of the rising wedge showing increasing selling pressure.

1-hour BTC/USD Chart | Source: TradingView
On the other hand, the Awesome Oscillator, as shown below the price chart, indicates diminishing bull momentum in Bitcoin price through the recent red bars on the AO histogram. Usually, this technical indicator signals that selling is outpacing buying, showing a possible price reversal in the near term.
 thecoinrepublic.com