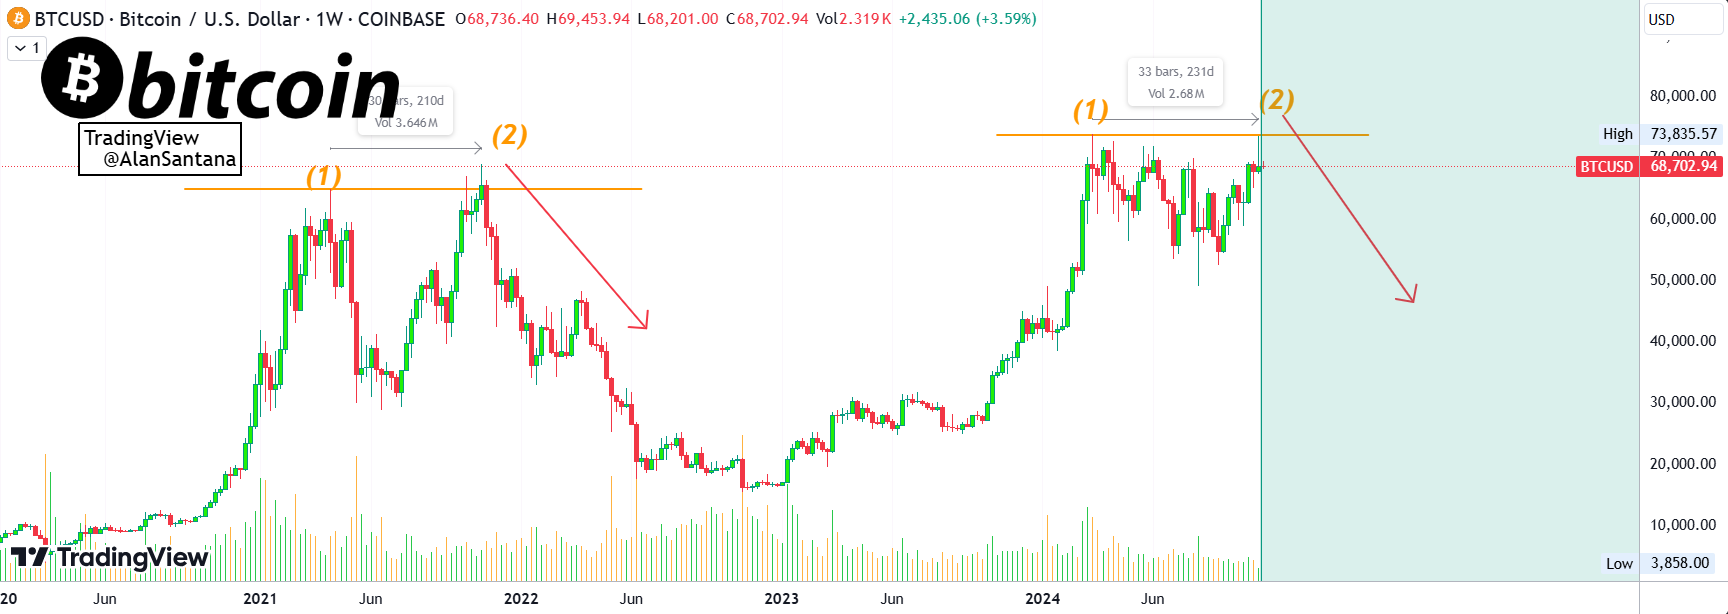
Bitcoin has been showing signs of a double-top pattern, raising concerns of a possible market correction similar to what occurred during the bull market of 2021.
Alan Santana, the market analyst who called attention to this potential structure, has warned of a possible bearish move, identifying important levels to watch should the correction materialize.
A Familiar Pattern Emerges
In a recent analysis, Alan Santana noted similarities between the current Bitcoin price action and the double-top formation observed in 2021.
During that period, Bitcoin reached a peak of $64,895 in April, followed by a higher high of $69,000 in November. This price action led to the formation of a double top, which ultimately resulted in a major downturn.
Santana called attention to the pattern of rising volume ahead of the first peak and declining volume before the second. This trend indicated a reduction in market participation, a bearish feature.
Interestingly, in 2024, a similar trend is emerging. Bitcoin experienced an initial peak of $73,794 in March amid rising volume. However, as it approached a new high in late October, volume has decreased sharply.
Santana viewed the low volume as a strong signal which shows limited retail involvement and a market mainly driven by larger players, or whales. This drop in participation could lead to a major downturn if the double top pattern holds.
Bitcoin Risks a Bull Trap
Four days ago, Santana cautioned that the latest upward move might be a “fake bullish breakout” or a “bull trap.” He noted that Bitcoin initially pushed above resistance, which often leads traders to become overly optimistic.

However, he warned that the week was still young at the time, and without a strong close above resistance, there was a risk of a sharp reversal. Market veterans such as Peter Brandt had issued similar cautionary commentaries amid recent upsurges.
Santana noted that true breakouts are usually accompanied by a surge in trading volume, which wasn’t evident in this case.
The lower-than-expected volume suggested a lack of conviction behind the move, making it likely that Bitcoin could close the week lower. He stressed that if Bitcoin closes below $68,035, it will confirm a bull trap, with a red candle and a long upper wick indicating a failed breakout.
However, Bitcoin managed to close the week above $68,035. Despite this, the close resulted in the formation of a Gravestone doji, as recently reported by The Crypto Basic. If it witnesses another weak candle this week, it will confirm this bearish pattern.
Key Bitcoin Levels to Watch
In his analysis, Santana identified $70,000 as an important threshold. A weekly close below this level would confirm the bearish scenario, while a close above $74,000 might provide more optimistic signals.
However, he emphasized that Bitcoin is trading near a top, traditionally a risky area for long positions. Santana urged caution, suggesting that even if prices briefly move higher, the market could still see a reversal.
In addition, the analyst pointed out that several top altcoins are not following Bitcoin’s upward trajectory, which is unusual in bullish conditions.
When Bitcoin rallies, altcoins generally follow suit, but the lack of such correlation now supports the idea of a “fake” move, potentially driven by a few large holders rather than broad market support.
Santana outlined important support levels to monitor in the event of a downturn. He sees $55,000 as the first major support, followed by $44,000 and $36,000. If Bitcoin fails to maintain these levels, a more severe decline could follow.
Long-Term Bitcoin Outlook
Meanwhile, in the long-term outlook, Santana believes the current market structure could lead to a deeper correction before the trend reverses. He believes Bitcoin might need several weeks of consecutive red candles to reach a new low.
However, he also expressed optimism that once the low is established, the market could experience a sustained rally. This could potentially set the stage for a bull run leading into 2025 following the U.S. presidential election.
 thecryptobasic.com