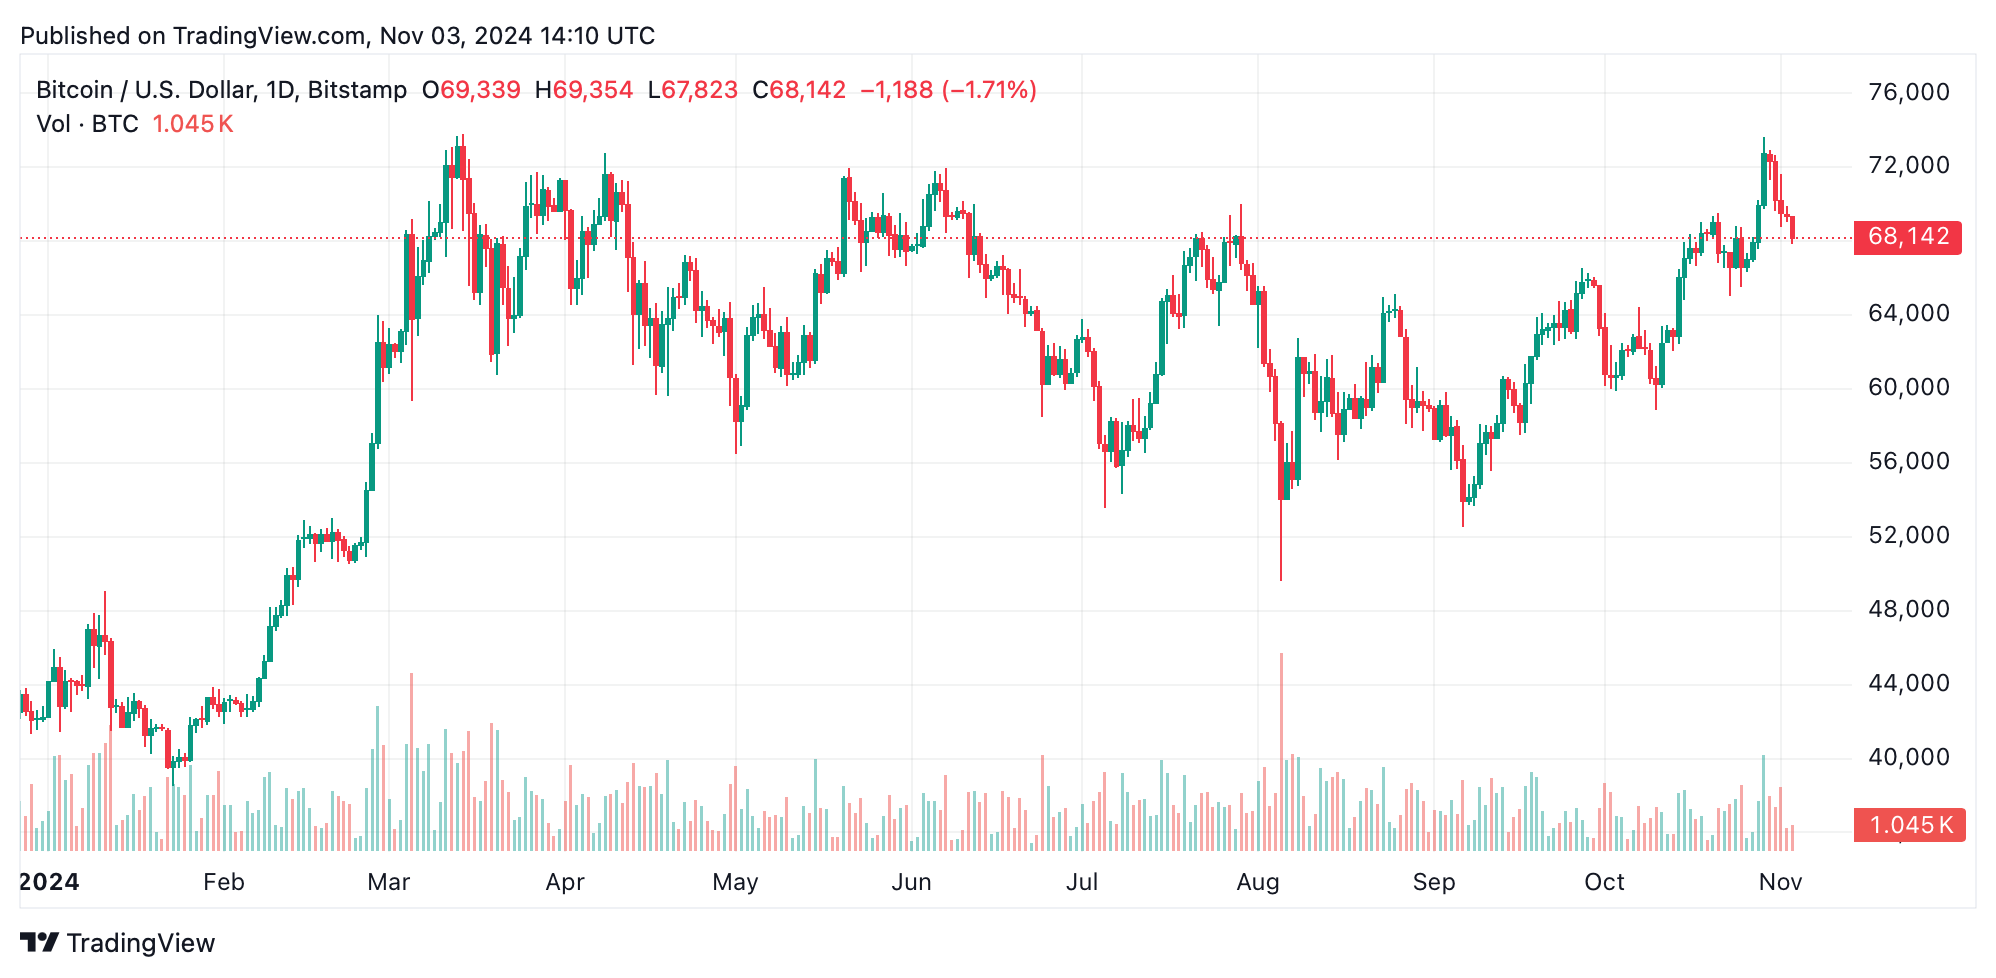
Zooming into the 4-hour chart, bitcoin’s downtrend is clear, with a pattern of lower highs and lows since the $73,600 peak. Current support appears at $67,823, with a minor resistance level at $69,500. Trading volume spiked near $67,823, hinting at some buying attempts to stabilize the price, though buying strength remains modest. Potential entry points could arise if $BTC consolidates above $68,000 or breaks past $69,500, which may suggest a reversal. A failure to maintain support at $67,823, however, could fuel further bearish movement.
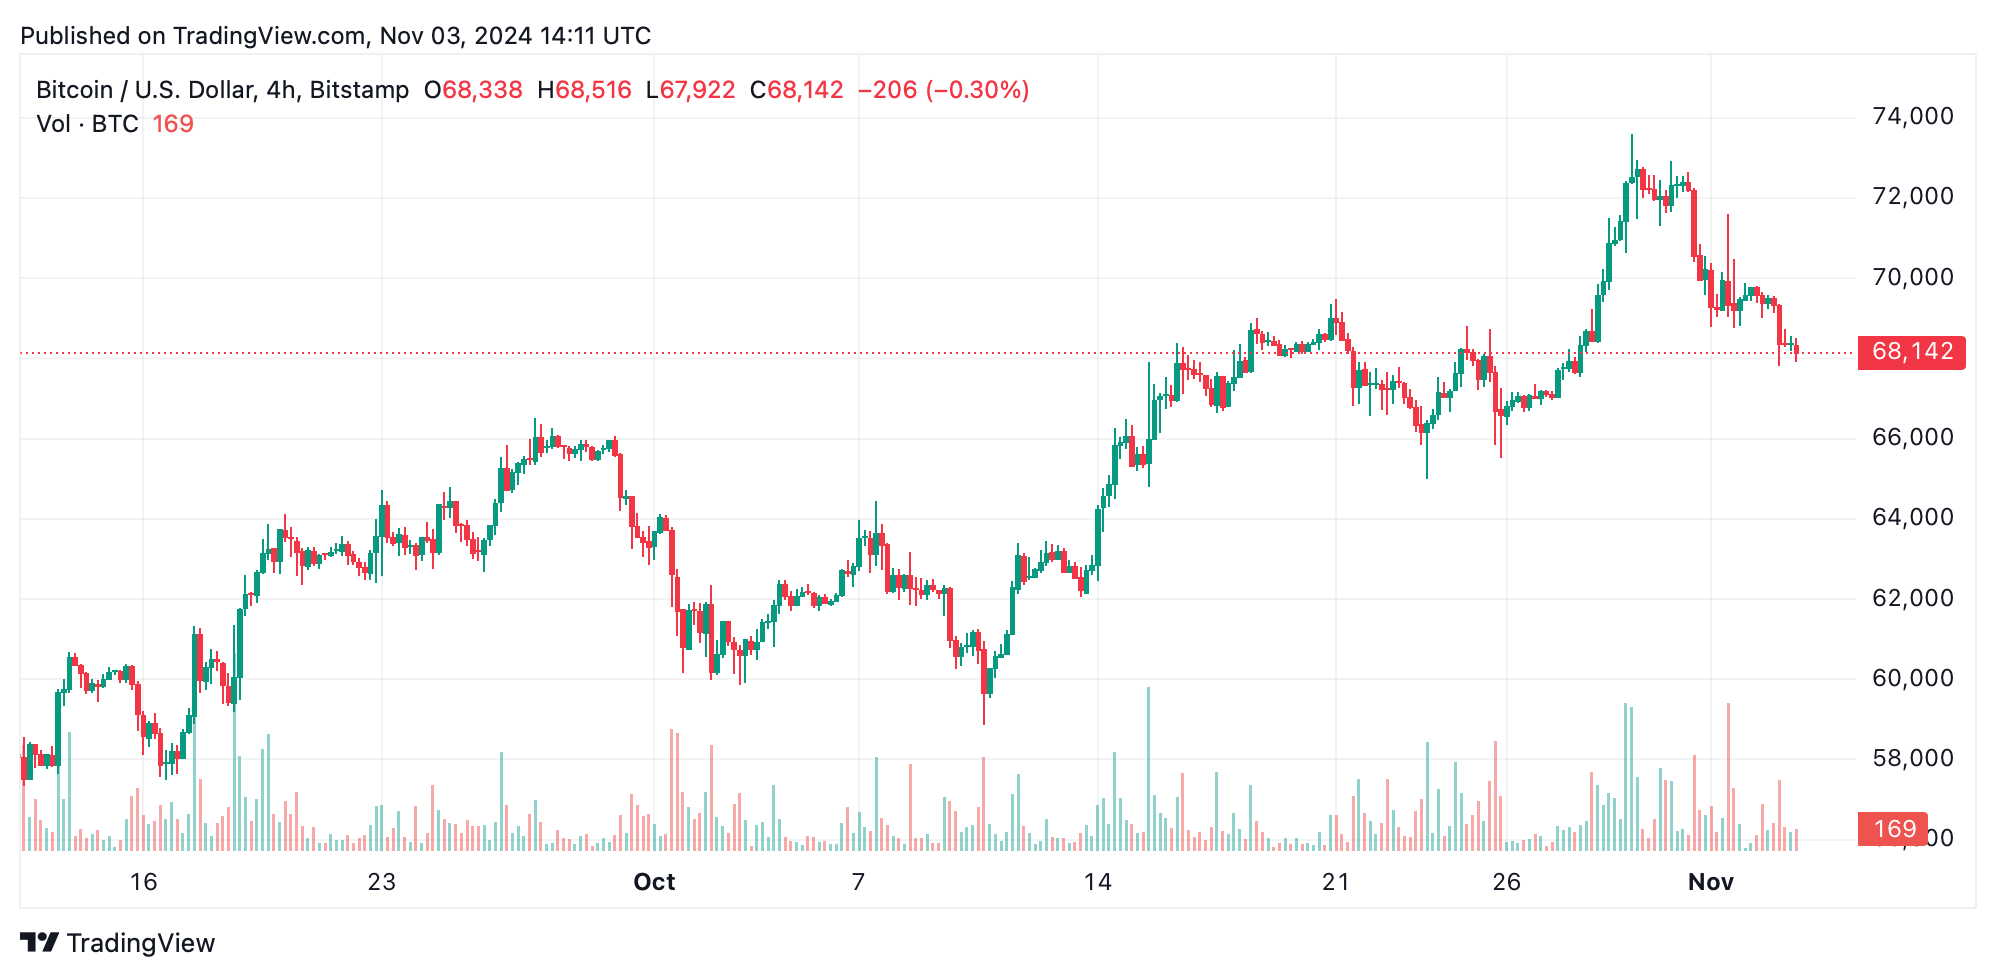
$BTC/USD 4-hour chart.
On the 1-hour chart, $BTC continues to struggle, holding just below the $69,000 resistance level. This timeframe shows immediate support holding strong at $67,823, while recent dips confirm persistent selling pressure with volume spikes. Should bitcoin cross the $69,000 mark with heightened volume, a short-term bullish reversal could be on the horizon. Conversely, a decline below $67,823 may push $BTC lower as traders react to the weakening short-term trend.
The oscillators indicate a blend of neutral and sell signals, underscoring the uncertainty of $BTC’s current trajectory. The relative strength index (RSI) remains neutral at 52, while both the commodity channel index (CCI) and Stochastic oscillator hover near neutral, signaling neither strong buying nor selling momentum. Momentum (MOM) and the moving average convergence divergence (MACD), however, lean bearish, both displaying negative signals. This combination of neutral oscillators and bearish momentum reflects a market with low conviction, slightly tilted toward a seller’s market.
Moving averages add weight to the bearish sentiment, with short- and medium-term averages pointing to sell signals. The 10-period exponential moving average (EMA) and simple moving average (SMA), alongside the 20-period EMA and SMA, all signal bearishness, with $BTC trading below these averages, indicating resistance against reclaiming higher levels. Long-term moving averages, including the 30-, 50-, 100-, and 200-period EMAs and SMAs, continue to suggest bullish optimism, hinting at an underlying positive sentiment in the broader trend despite the challenges in the shorter term.
Bull Verdict:
Despite recent bearish signals, bitcoin’s price shows potential resilience, with longer-term moving averages signaling buying strength. If $BTC can hold above $68,000 and break past short-term resistance at $69,500, it may reclaim momentum for a bullish push toward previous highs. Watch for increased buying volume and a potential shift in oscillator indicators to confirm a renewed uptrend.
Bear Verdict:
The prevailing short-term indicators and recent downward momentum suggest a challenging path ahead for bitcoin. With key oscillators showing sell signals and short-term moving averages acting as resistance, a failure to hold the $68,000 support level could trigger further declines. Should $BTC breach support at $67,823, sellers may gain the upper hand, potentially leading to a deeper pullback in the coming sessions.

 news.bitcoin.com