On October 10, Bitcoin (BTC) briefly dipped below the $60,000 mark, stirring speculation that it might miss the traditionally bullish trend known as “Uptober.” However, recent price momentum over the past week hints at a stronger end-of-month performance, aligning with historical data that often sees Bitcoin rally as October concludes.
Currently, BTC trades at $68,563. This on-chain analysis highlights indicators suggesting BTC could push past the $73,000 level soon.
Indicators Favor Bitcoin’s Uptrend
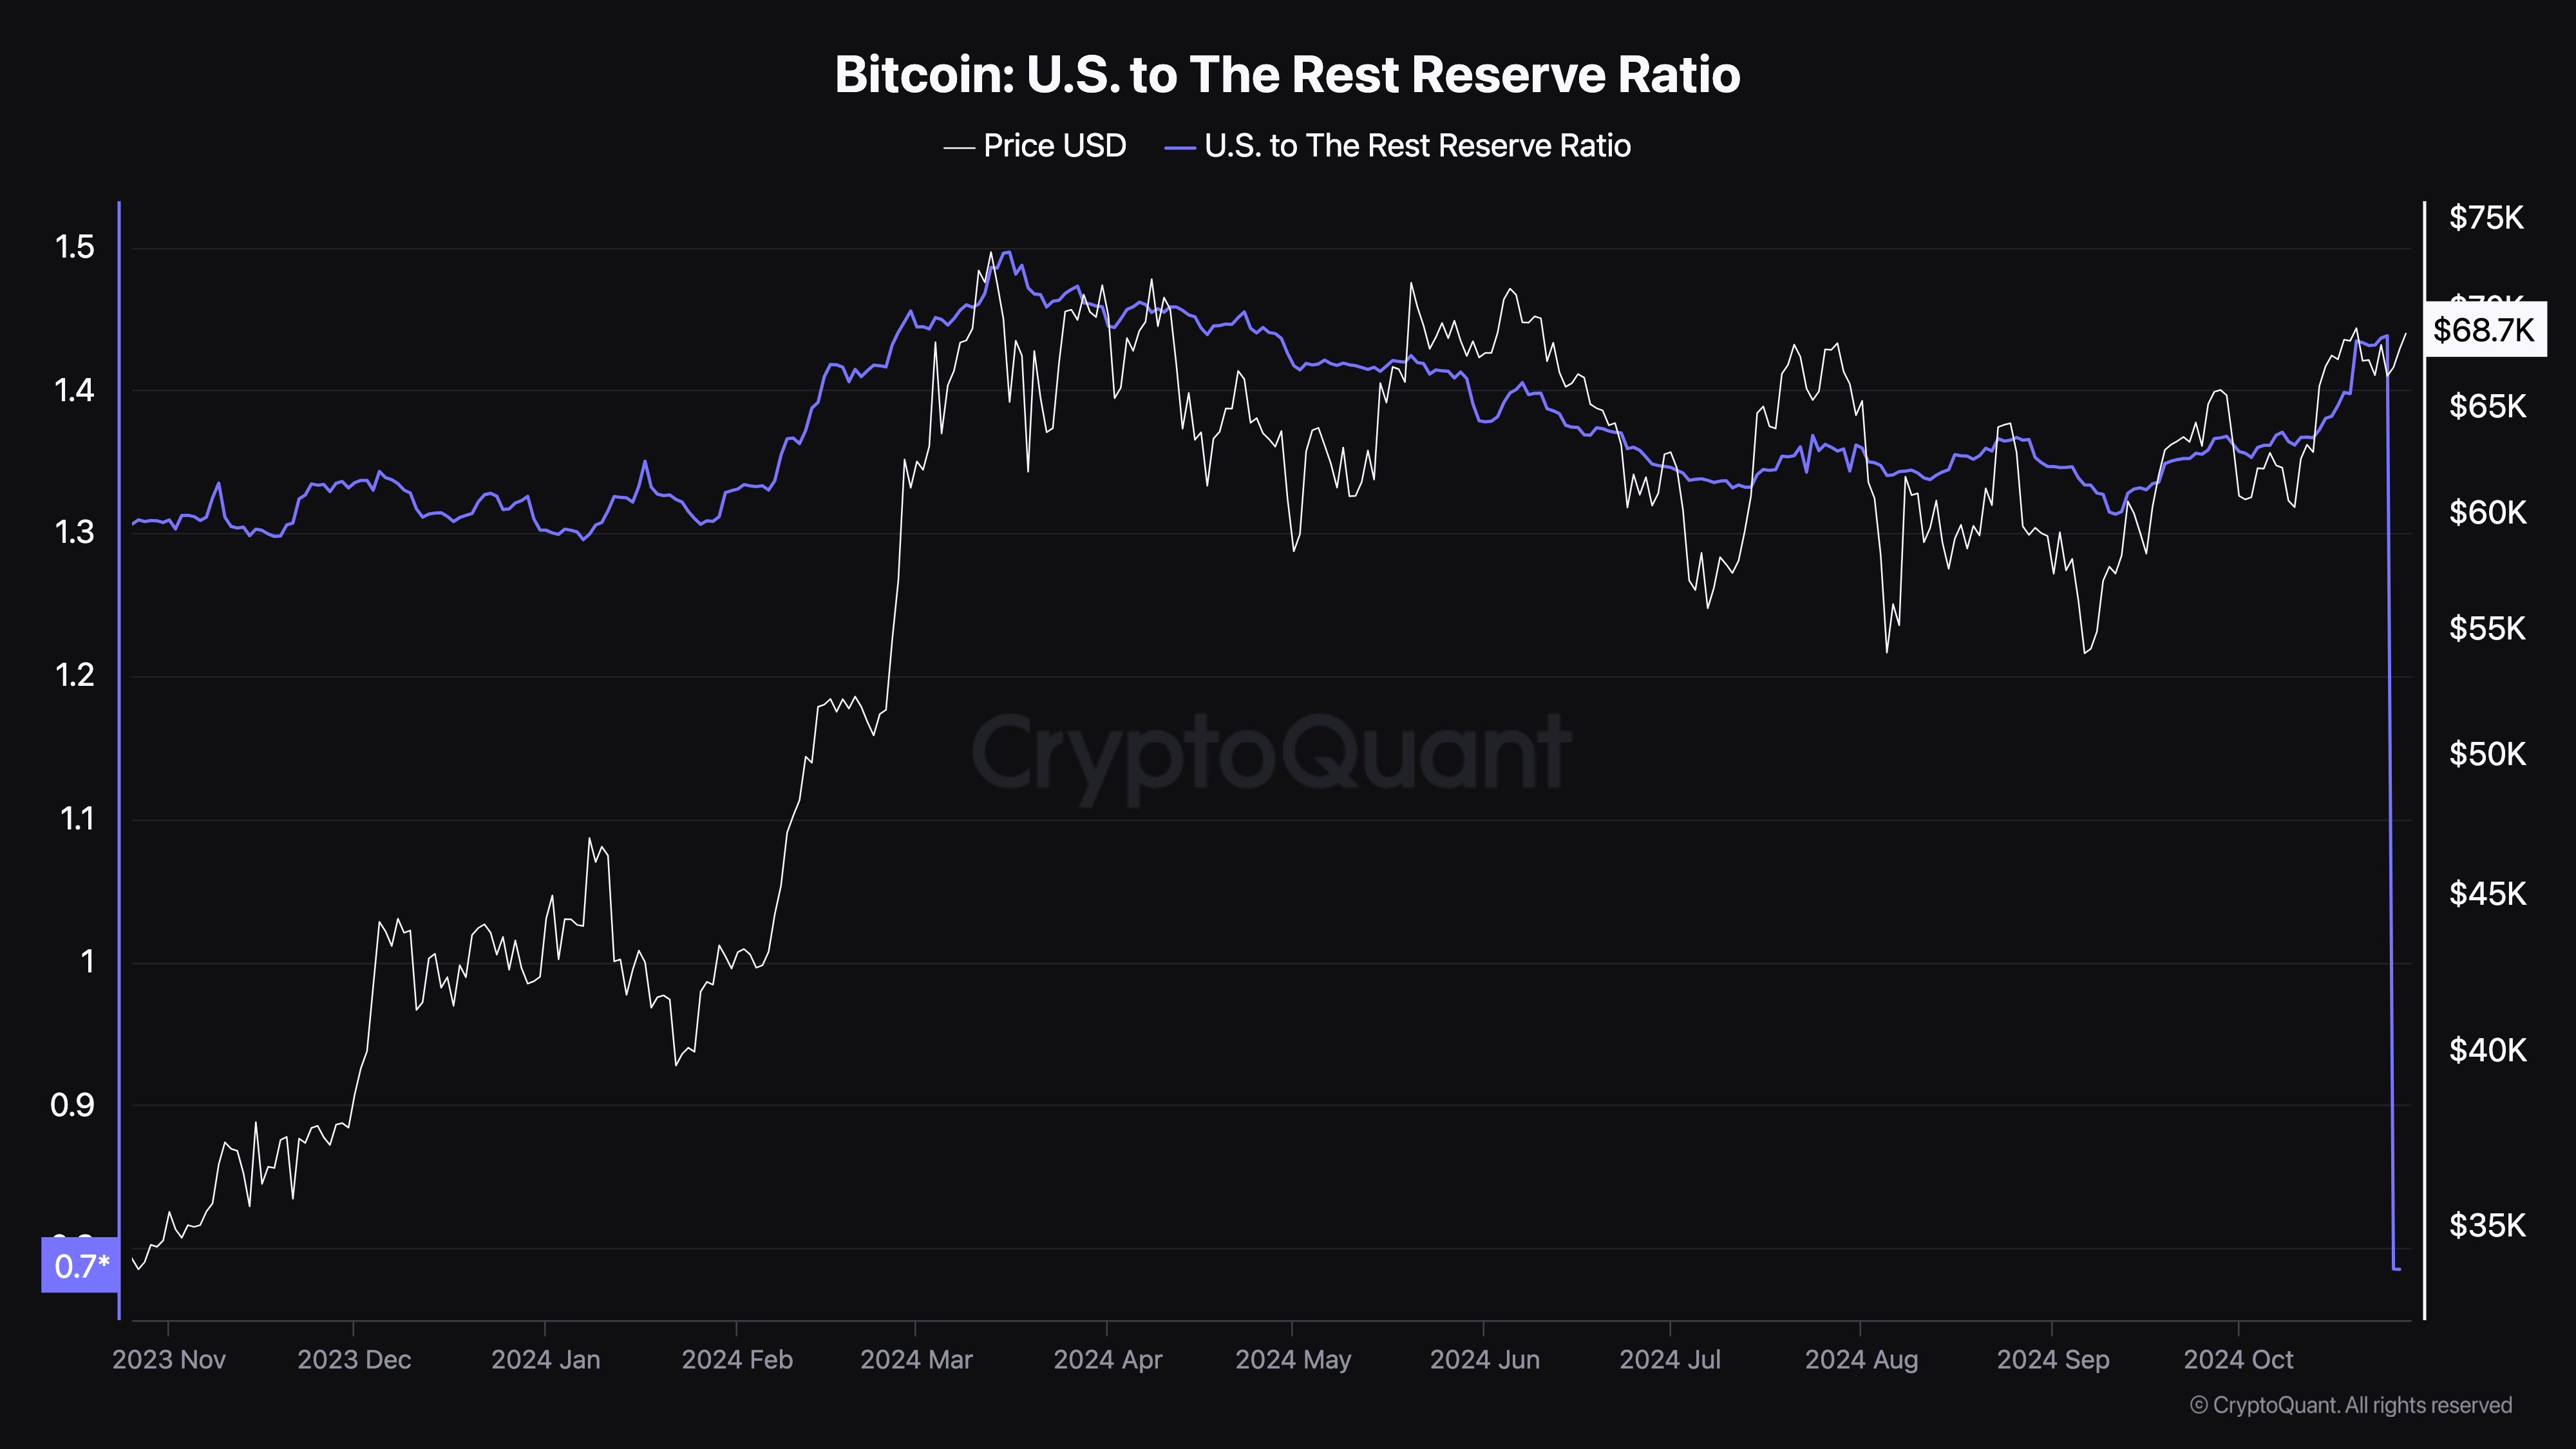
CryptoQuant’s analysis shows that the US-to-Rest Reserve Ratio—measuring Bitcoin holdings by US entities versus others globally—was a significant contributor to BTC’s surge past $73,000 in March. This metric reflects the accumulation level by US-based exchanges, asset managers, and other entities compared to non-US institutions.
When this ratio rises, it signals that US-based holdings of BTC are increasing, suggesting heightened demand from US institutions. Conversely, a decrease indicates reduced exposure from these entities.
This ratio began climbing steadily around Q4 2023, aligning with Bitcoin’s upward price trajectory. Now, with the ratio rising again since mid-October, historical patterns suggest that US institutions are again actively buying BTC.
Read more: Top 7 Platforms To Earn Bitcoin Sign-Up Bonuses in 2024

For instance, Blackrock recently accumulated billions in BTC, indicating significant institutional interest. If this trend persists, Bitcoin’s price could soon breach the $70,000 mark, potentially fueling further gains in the near term.
Further, crypto analyst Rekt Capital supports a bullish outlook for Bitcoin, noting that BTC’s recent close above a significant overhead resistance suggests the momentum favors further gains.
In a post on X (formerly Twitter), Rekt Capital highlighted that this technical breakout diminishes the likelihood of another immediate downtrend.
“The multi-month Downtrend is confirmed as over. The Downtrending Channel breakout is confirmed. BTC has turned the resistance into new support.” Rekt Capital wrote on X.
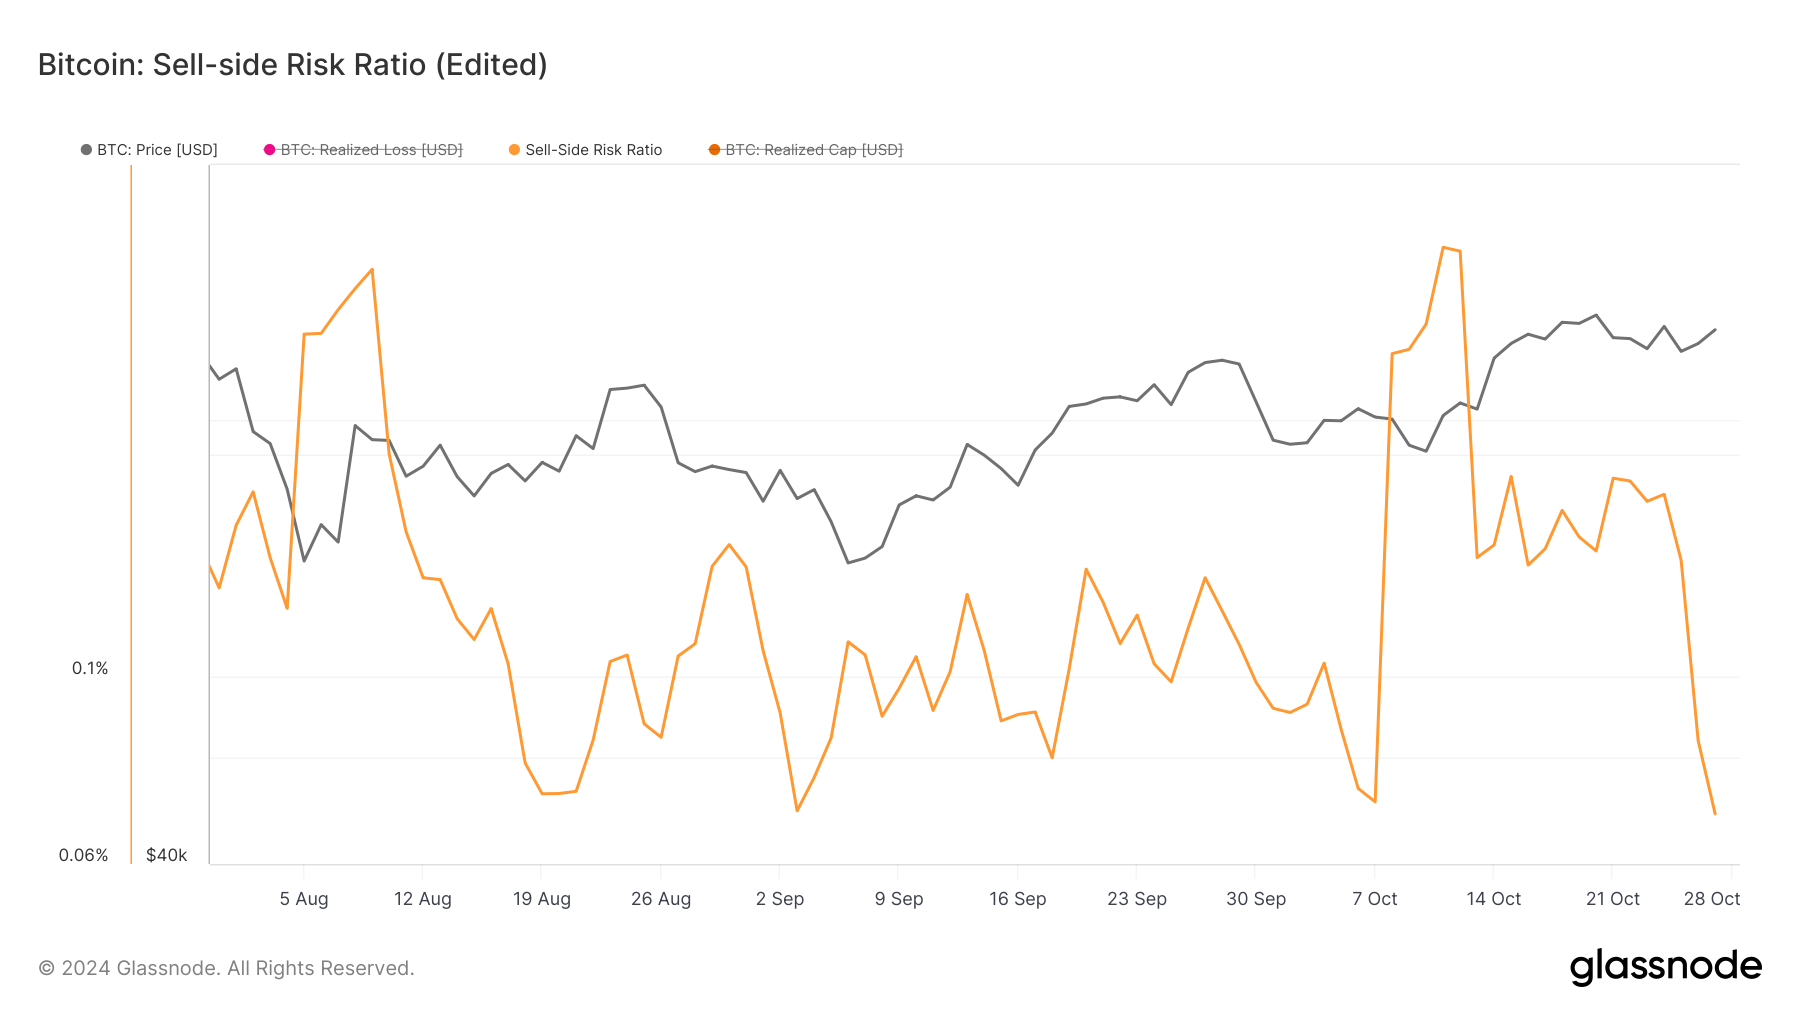
Besides this, Bitcoin’s sell-side risk ratio has fallen to its lowest point since September 3. Typically, high values of this ratio coincide with market tops or late stages of the bull market.
Low values, on the other hand, often signal macro bottoms, suggesting a high likelihood of price increases. Considering Bitcoin’s historical data and current position, the price will likely surpass $73,000 within a few weeks.

BTC Price Prediction: Coins Eyes Higher Levels
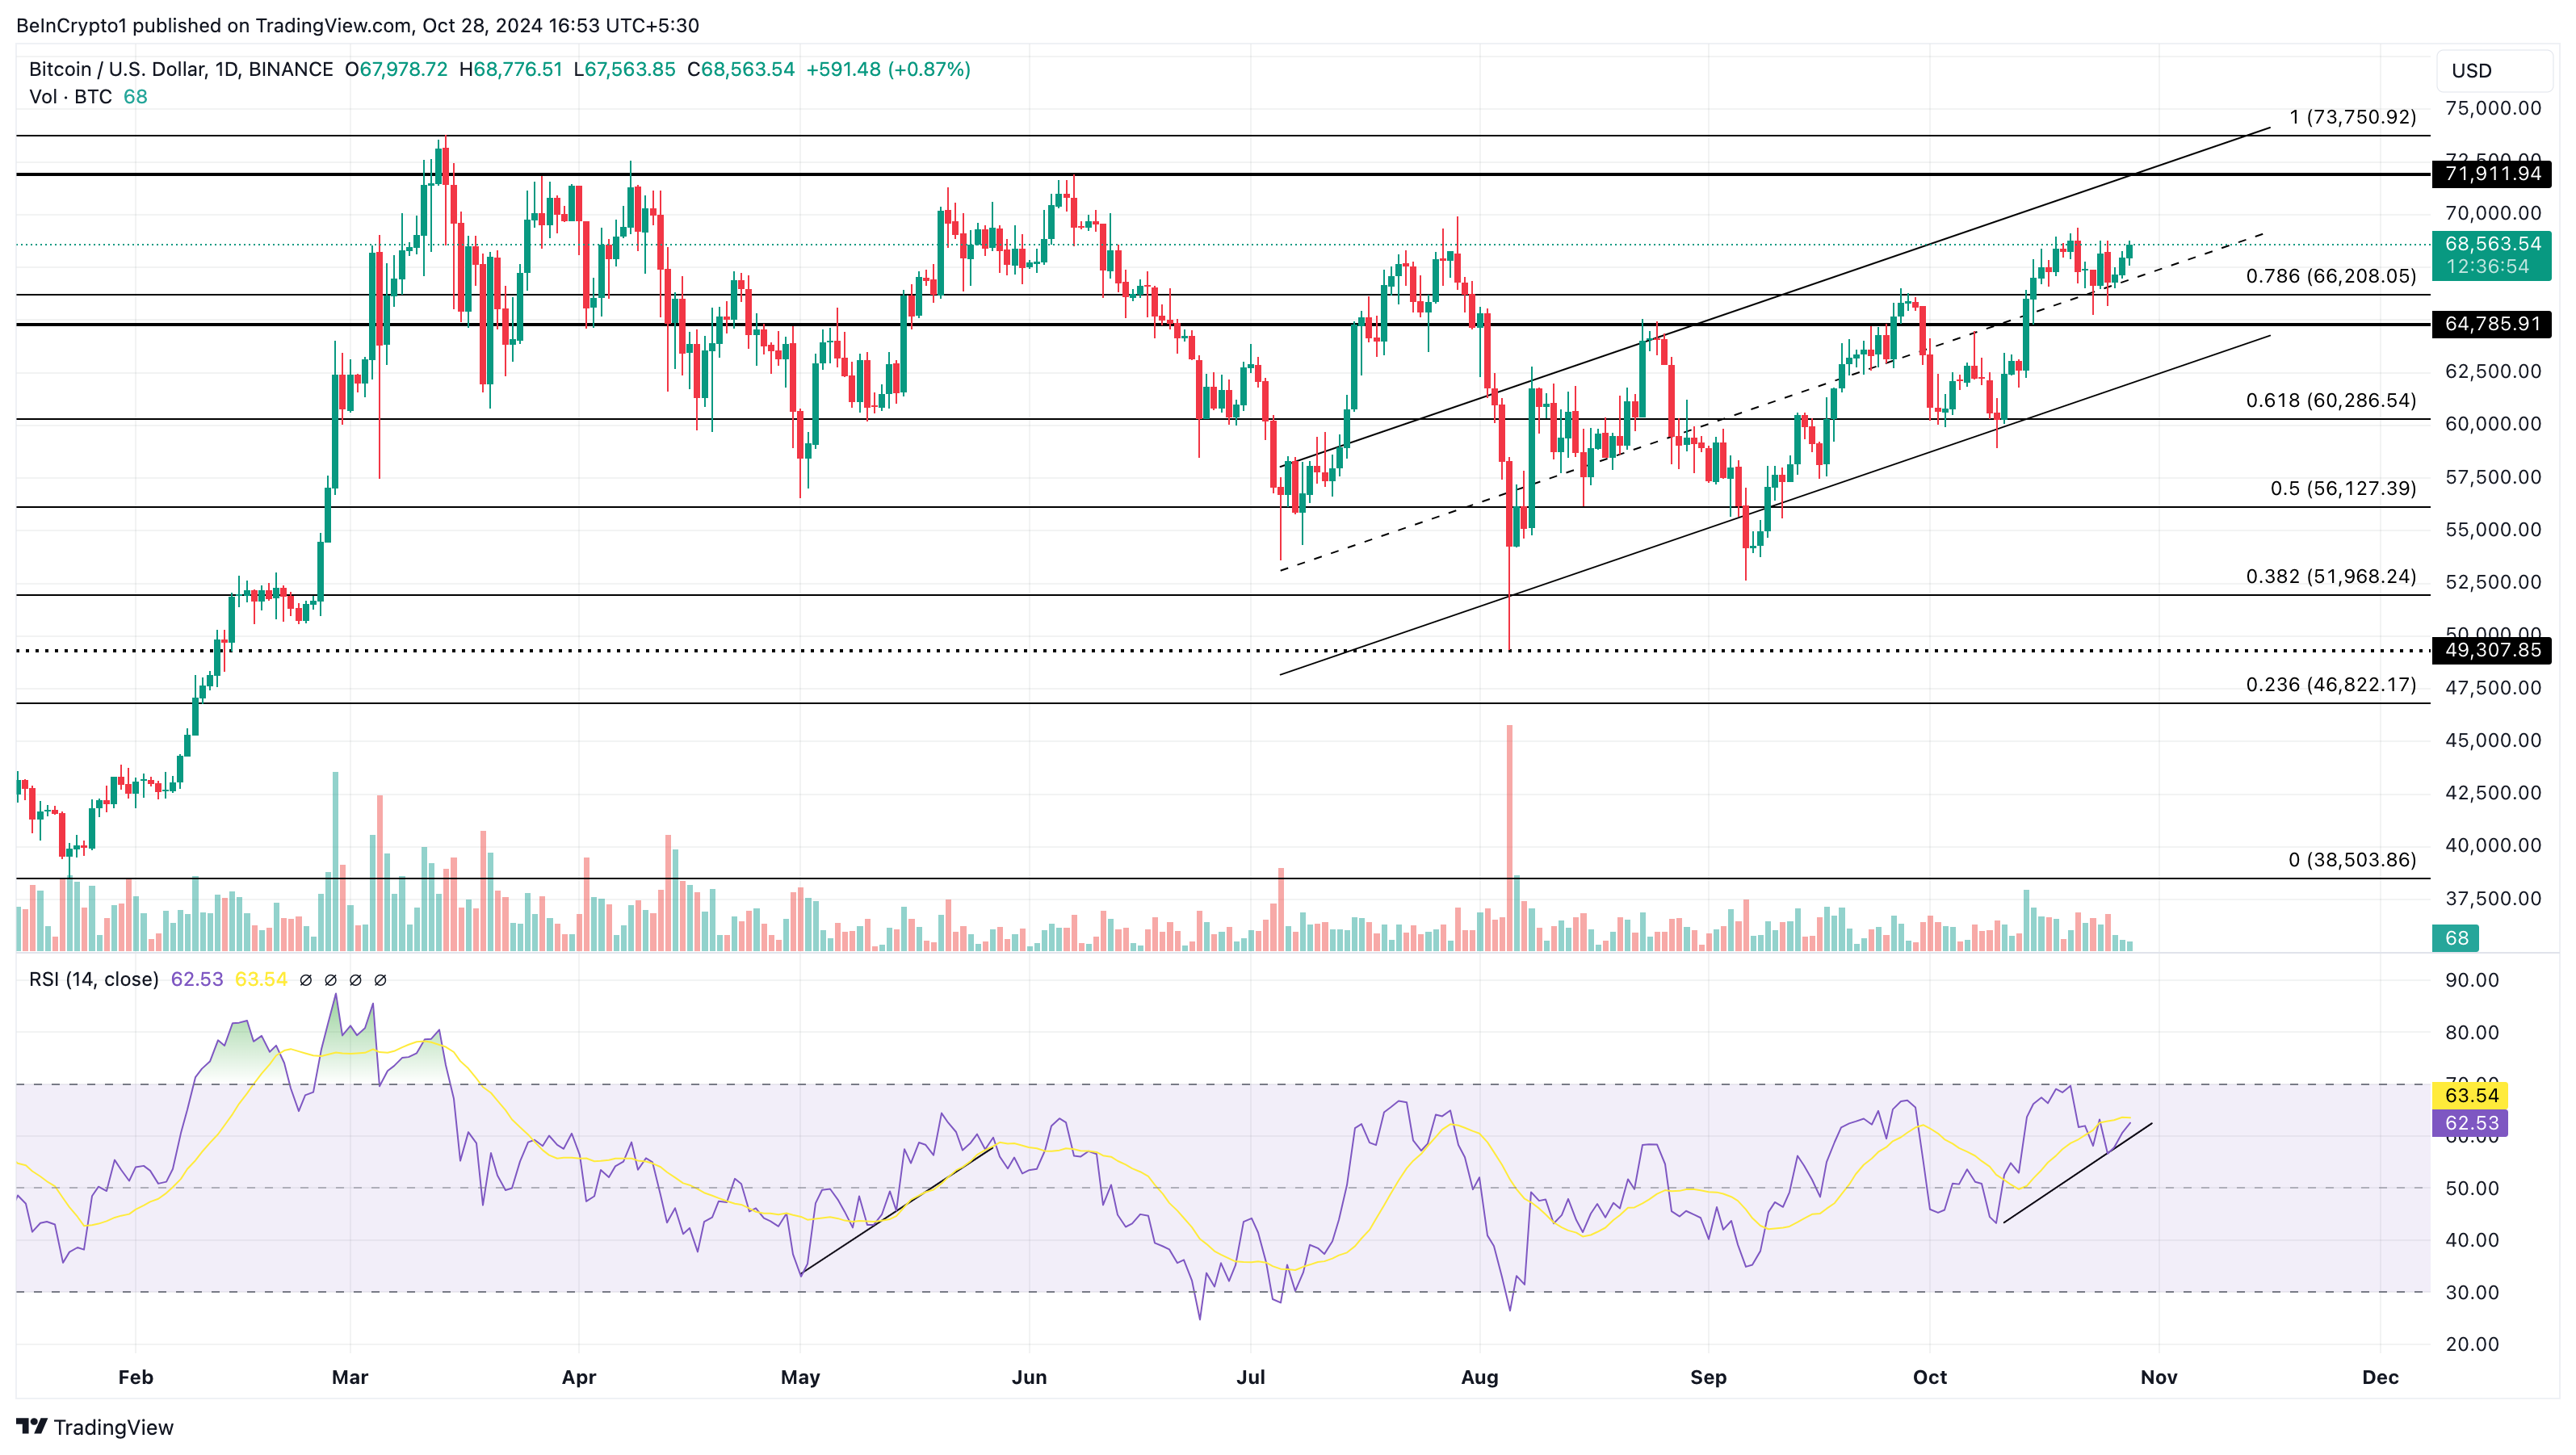
On the daily chart, Bitcoin holds support at $64,785. Beyond that, the Relative Strength Index (RSI) appears to be following the same trend as the price rallied to $71,911.
For context, the RSI uses the speed and price changes to measure momentum. When it increases, momentum is bullish, and when it decreases, momentum is bearish. Following Bitcoin’s historical data and the current ascending channel on the chart, the price is likely to break $73,750.
Read more: Bitcoin (BTC) Price Prediction 2024/2025/2030

On the other hand, if Bitcoin’s price slips below the $64,785 support, this prediction might not come to pass. Should this be the case, BTC might decline to $60,286.
 beincrypto.com
