In a recent turn of events, the Bitcoin price is starting a new week in October on a bullish note. The BTC price is trading at $63,521 and has increased by 2.45% in the past 24 hours. Following the bullish surge comes after the 1.22% jump on Sunday, creating a bullish engulfing candle, the intraday candle reveals a second consecutive bullish candle with a 1.10% jump.
The bullish recovery comes after the sudden 8% drop in Bitcoin in a span of four days during the high geopolitical tensions phase in East Asia. Despite the ongoing conflict, the global markets and crypto market are on a path to recovery, creating an optimistic outlook for BTC price predictions.
Further, the BTC price has increased by 4.76% from the 7-day lowest closing price of $60,631.
Bitcoin Price Analysis
In the daily chart, the BTC price action reveals a bull cycle regaining momentum from the 200-day EMA. With a V-shaped reversal, the Bitcoin price is heading higher to challenge the local resistance trend line. Beyond this, the largest crypto will have to challenge the long-coming resistance trend line of a bullish flag pattern.
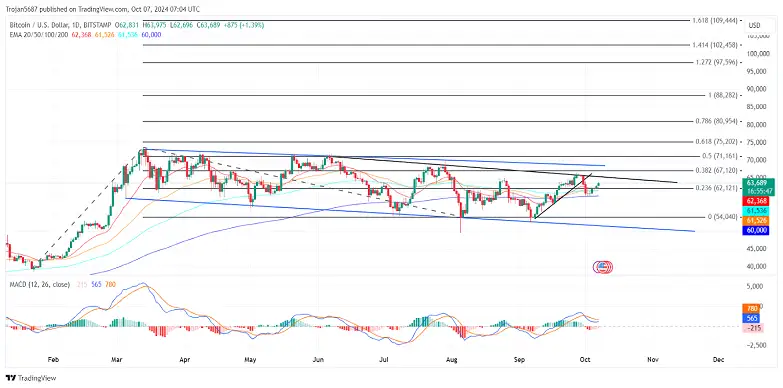
The outcome of the bullish flag pattern will determine the future price trend in Bitcoin. With the recovery over the last four days, the BTC price has surpassed the 50-day, 100-day, and 20-day EMA. This increases the possibility of a bullish crossover between the 50- and 100-day EMA.
Based on the trend-based Fibonacci level, the BTC price is back above the 23.60% Fibonacci level at $62,121. With a bullish breakout of a flag pattern, the BTC price could reach the 78.60% Fibonacci level or 100% Fibonacci level at $80,954 or $88,282, respectively.
Bitcoin’s Underlying Dynamics in 4H Chart
In the 4-hour chart, the BTC price action reveals a bullish continuation after a minor comeback in a bull cycle. Using the trend-based Fibonacci level over this minor pullback, the local resistance trend line breakout exceeds the 23.60% Fibonacci level. It increases the possibility of a bullish crossover in the 50- and 100-day EMA in the 4-hour chart.
Hence, the converging signals in the daily and 4-hour charts increase the possibility of a bullish trend in BTC.
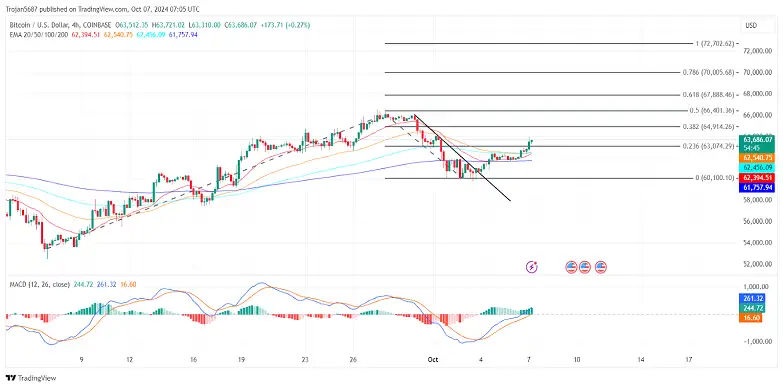
Furthermore, the 4-hour chart reveals a rounding reversal in BTC with a neckline near the 50% Fibonacci level at $66,400.
A bullish breakout will potentially put the 78.60% and 100% Fibonacci levels as potential weekly targets at $70,000 and $72,700.
The MACD indicator in the 4-hour chart maintains a positive alignment. Meanwhile, the MACD and signal lines in the daily chart are ready for a bullish crossover. Hence, the momentum indicators support the bullish side.
Bitcoin Derivatives Data Reveals $34B Open Interest
Coming to the derivatives market, the BTC Derivatives Data Analysis from CoinGlass reveals a 112% surge in volume to hit $38.21 billion. The Bitcoin Open Interest has increased by 5.11% and hit the $34 billion mark.
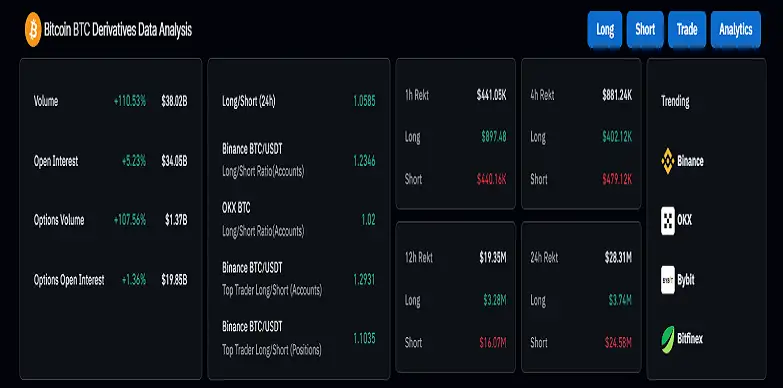
BTC Open Interest, Funding Rate, Liquidation, Long-Short Ratio And Other Derivative Data | CoinGlass
Meanwhile, the Options Open Interest is close to approaching the $20 billion mark and has increased by 1.21% in the past 24 hours. Supporting the bullish surge, the options volume has increased by more than 100% and is standing at $1.38 billion.
With the short-term recovery, the long-to-short ratio over the past 24 hours has surpassed the unit value. Standing at 1.0555, the long-to-short ratio reveals a stronger bullish side and an overall bullish sentiment.
Coming to liquidations, over the past 24 hours, the Bitcoin traders have lost $28.31 million, constituting 24.57% in short positions. Hence, as sellers lose money, the chances of a bullish market increase.
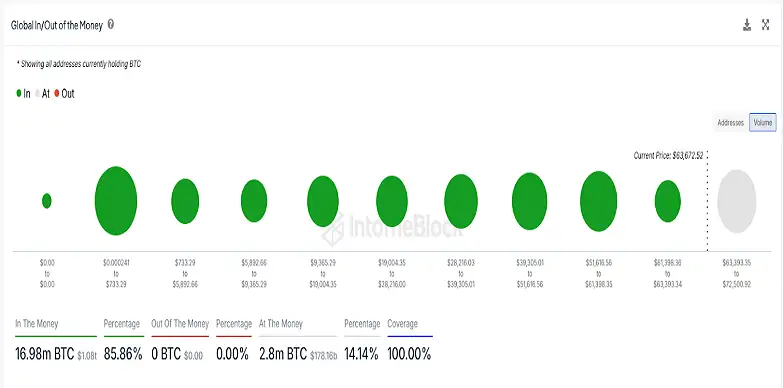
Bitcoin (BTC) On-Chain Analytics & Charts (intotheblock.com)
Furthermore, the global in and out of money over into the block reveals almost 90% of Bitcoin holding volume is in the money. Meanwhile, the ad nominee range extends from $63,393 to $72,500, encompassing all the rest of the volume accounts for $178.16 billion.
Conclusion
With the sentiments changing and improving for Bitcoin not just over the price chart but also the derivatives market and on-chain support the uptrend chances. Further, the historical data suggests the extremely bullish Q4 of a halving year keeps the crypto bulls on their toes.
Hence, a bullish breakout of the $65k or the local resistance trendline will mark a newly refreshed rally in Bitcoin.